P/E Ratio (TTM)This indicator plots the trailing P/E ratio (TTM) using GAAP EPS (TTM) sourced directly from TradingView’s fundamental data. It includes valuation‑zone color coding, yearly labels, and a clean, compressed visual layout suitable for most equities.
The goal is to provide a fast, intuitive view of how expensive or cheap a stock is relative to its historical earnings power.
Note:
The indicator caps P/E values around 120 for visual clarity.
Negative P/E ratios are intentionally excluded, since P/E is undefined when EPS is negative.
You can adjust the cap or remove it entirely if you prefer a full‑range view.
This tool is especially useful for identifying periods when a company is trading at historically elevated or discounted valuation levels.
Peratio

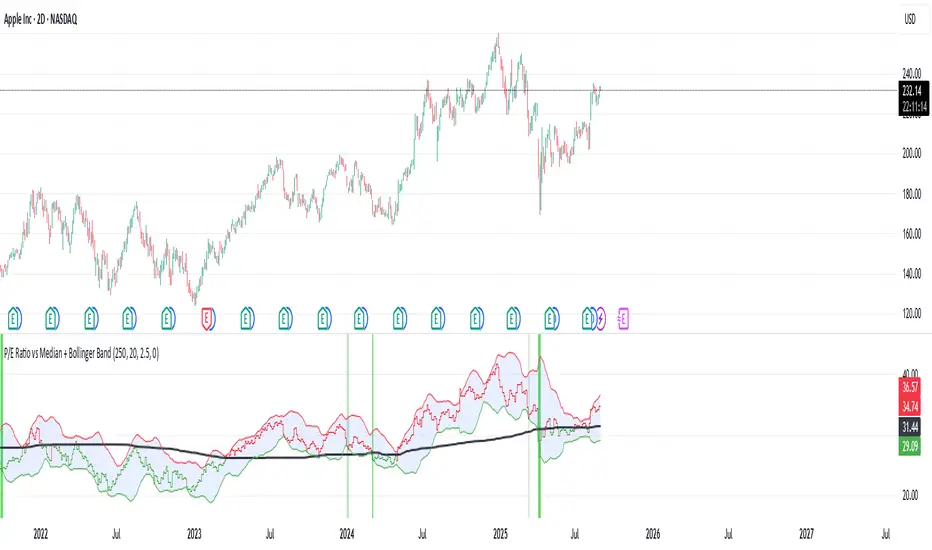
P/E Ratio vs Median + Bollinger Band- 📝 This indicator highlights potential buying opportunities by analyzing the Price-to-Earnings (P/E) ratio in relation to Bollinger Bands and its historical median.
- 🎯 The goal is to provide a visually intuitive signal for value-oriented entries, especially when valuation compression aligns with historical context.
- 💡 Vertical green shading is applied when the P/E ratio drops below the lower Bollinger Band, which is calculated directly from the P/E ratio itself — not price. This condition often signals the ticker may be oversold.
- 🟢 Lighter green appears when the ratio is below the lower band but above the median, suggesting a possible shorter-term entry with slightly more risk.
- 🟢 Darker green appears when the ratio is both below the lower band and below the median, pointing to a potentially stronger, longer-term value entry.
- ⚠️ This logic was tested using 1 and 2-day time frames. It may not be as helpful in longer time frames, as the financial data TradingView pulls in begins in Q4 2017.
- ⚠️ Note: This script relies on financial data availability through TradingView. It may not function properly with certain tickers — especially ETFs, IPOs, or thinly tracked assets — where P/S ratio data is missing or incomplete.
- ⚠️ This indicator will not guarantee successful results. Use in conjunction with other indicators and do your due diligence.
- 🤖 This script was iteratively refined with the help of AI to ensure clean logic, minimalist design, and actionable signal clarity.
- 📢 Idea is based on the script "Historical PE ratio vs median" by haribotagada
- 💬 Questions, feedback, or suggestions? Drop a comment — I’d love to hear how you’re using it or what you'd like to see changed.
PE Ratio Intrinsic ValueThe "Median PE Ratio and Intrinsic Value" indicator is designed for traders and investors who wish to evaluate the intrinsic value of a stock based on a comparative analysis of Price-to-Earnings (PE) ratios across multiple stocks. This tool not only provides insights into whether a stock is undervalued or overvalued but also allows you to visualize the intrinsic value directly on the chart.
Comparison Across Multiple Stocks:
This indicator calculates the PE ratio for up to five different stocks, allowing you to compare the target stock's valuation against four other same sector companies. By default, the stocks included are Apple (AAPL), Google (GOOG), Microsoft (MSFT), and Amazon (AMZN), but you can customize these symbols to fit your analysis needs.
Dynamic PE Ratio Calculation:
The indicator calculates the PE ratio for each stock by dividing the current price by the earnings per share (EPS). The EPS data is retrieved based on the selected period, which can be one of the following:
FY (Fiscal Year)
FH (Fiscal Half-Year)
FQ (Fiscal Quarter)
TTM (Trailing Twelve Months)
You can easily switch between these periods using the provided input options, enabling a more customized analysis based on your preferred financial timeframe.
Once the PE ratios for the selected stocks are computed, the indicator calculates the average PE ratio. The average value is a robust measure that reduces the influence of outliers and provides a balanced view of market valuation.
The intrinsic value of the stock on the chart is calculated by multiplying its EPS by the median PE ratio of the selected stocks. This gives you an estimate of what the stock should be worth if it were to trade at a fair valuation relative to the chosen peers.
The intrinsic value is plotted directly on the price chart as a step line with breaks. This step line style is chosen to represent changes in intrinsic value clearly, with breaks indicating periods where the calculated value is not valid (e.g., negative intrinsic value). Only positive intrinsic values are displayed, helping you focus on meaningful data.
You can easily customize the stocks analyzed by entering the ticker symbols of your choice. Additionally, the indicator allows you to adjust the timeframe for EPS data, giving you flexibility depending on whether you are focused on long-term trends or shorter financial periods.
How to Use:
Compare the current stock price to the plotted intrinsic value. If the current price is below the intrinsic value, the stock may be undervalued. Conversely, if the price is above the intrinsic value, the stock might be overvalued. By comparing your stock against major market players, you can gauge whether it's trading at a premium or discount relative to other key companies in the sector. Use the period selection (FY, FQ, TTM) to adapt your analysis to different market conditions or earnings cycles, giving you more control over your valuation assessment.
Ideal For:
Long-term Investors looking to assess the intrinsic value of a stock based on comparative analysis.
Fundamental Analysts who want to combine multiple stocks' PE ratios to estimate a fair valuation.
Value Investors interested in finding undervalued opportunities by comparing the market price to intrinsic value.

Stock Value Display//This study is designed to plot estimates for a stock's value:
//1) the Price to earnings ratio (PE) value based on the trailing twelve months of data
//2) the PE value based future data
//3) the Benjamin Graham value based trailing data
//4) the Dividend Discount value based on trailing data
You can adjust the period of data used to calculate the value between Fiscal Quarter "FQ" and Fiscal Year "FY."
The values displayed on the chart are subject to the financial information provided to TradingView. This is intended to be used as a quick reference and should be viewed in context with other analysis prior to making any transaction decisions.
As always, happy trading!
