ARM-EMA COLOR BUY SELLPrice action trading is about reading what the market is doing, so you can deploy the right trading strategy to reap the maximum benefits. In simple words, price action is a trading technique in which a trader reads the market and makes subjective trading decisions based on the price movements, rather than relying on technical indicators or other factors.
At its most simplistic, it attempts to describe the human thought processes invoked by experienced, non-disciplinary traders as they observe and trade their markets. Price action is simply how prices change - the action of price. It is most noticeable in markets with high liquidity and price volatility, but anything that is traded freely (in price) in a market will per se demonstrate price action.
지표 및 전략

Volatility State Index [Interakktive]The Volatility State Index (VSI) classifies market volatility into three behavioral states: Expansion, Decay, and Transition. It answers one question visually: Is volatility supporting price movement, withdrawing, or unstable?
Unlike traditional volatility indicators that show levels or bands, VSI diagnoses the current volatility regime so traders can adapt their approach accordingly.
█ WHAT IT DOES
• Classifies volatility into three states: Expansion (teal), Decay (grey), Transition (amber)
• Measures volatility momentum as a percentage rate-of-change
• Applies stability filtering to detect unstable/choppy conditions
• Uses persistence logic to prevent state flickering
• Exports state data for use in alerts and strategies
█ WHAT IT DOES NOT DO
• NO buy/sell signals
• NO entry/exit recommendations
• NO alerts (v1 is diagnostic only)
• NO performance claims
This is a volatility diagnostic tool, not a trading system.
█ HOW IT WORKS
The VSI processes volatility through a five-stage pipeline:
STAGE 1 — Base Volatility
Calculates ATR as the foundation for volatility measurement.
STAGE 2 — Smoothing
Applies EMA smoothing to reduce noise in the volatility series.
STAGE 3 — Volatility Momentum
Computes the percentage rate-of-change of smoothed volatility:
Volatility Momentum (%) = ((Current ATR - Previous ATR) / Previous ATR) × 100
Positive values indicate expanding volatility; negative values indicate contracting volatility.
STAGE 4 — Stability Filter
Tracks how frequently volatility momentum changes direction. Frequent sign changes indicate unstable, choppy conditions.
Stability Score = 1 - (Average Flip Rate)
Low stability forces the Transition state regardless of momentum level.
STAGE 5 — State Classification
Combines momentum thresholds and stability to determine the final state:
• Expansion: Momentum ≥ +5% (default threshold)
• Decay: Momentum ≤ -5% (default threshold)
• Transition: Between thresholds OR low stability
A persistence filter requires states to hold for multiple bars before confirming, preventing visual noise.
█ INTERPRETATION
EXPANSION (Teal)
Volatility is increasing in a sustained way. Price moves are becoming larger.
What it suggests:
• Breakouts are more likely to follow through
• Stops may need wider placement
• Trend-following approaches tend to work better
• Mean-reversion weakens
DECAY (Grey)
Volatility is decreasing. Price is compressing into tighter ranges.
What it suggests:
• Breakouts are more likely to fail
• Ranges tend to hold
• Trend-following underperforms
• Mean-reversion strengthens
TRANSITION (Amber)
Volatility behavior is unclear or unstable. This is NOT neutral — it is uncertainty.
What it suggests:
• Mixed signals — one bar huge, next bar dead
• Higher whipsaw risk
• Reduced conviction in either direction
• Consider waiting for clarity
The key insight: Amber is a warning, not a middle ground. It appears when volatility cannot decide what it wants to do.
█ VISUAL DESIGN
The indicator uses a state-first histogram design:
• Histogram height shows volatility momentum percentage
• Histogram color shows the classified state
• Zero line provides visual anchor
• Optional momentum line for confirmation
• Optional background tint (default OFF for clean charts)
The visual hierarchy prioritizes instant state recognition. A trader should understand the volatility environment in under one second without reading numbers.
█ INPUTS
Core Settings
• ATR Length: Base volatility measurement period (default: 14)
• Smoothing Length: EMA smoothing applied to ATR (default: 10)
• Momentum Length: Rate-of-change lookback (default: 10)
State Classification
• Expansion Threshold (%): Momentum above this = Expansion (default: 5.0)
• Decay Threshold (%): Momentum below this = Decay (default: -5.0)
• Persistence Bars: Bars required to confirm state change (default: 3)
• Stability Lookback: Window for stability calculation (default: 20)
• Stability Threshold: Below this = forced Transition (default: 0.5)
Visual Settings
• Show State Histogram: Toggle main display (default: ON)
• Show Momentum Line: Thin confirmation line (default: OFF)
• Show Zero Line: Baseline reference (default: ON)
• Show Background Tint: Subtle state coloring (default: OFF)
█ DATA WINDOW EXPORTS
When enabled, the following values are exported:
• ATR (Raw)
• ATR (Smoothed)
• Volatility Momentum (%)
• Stability Score (0-1)
• State (-1/0/1): Decay = -1, Transition = 0, Expansion = 1
• Is Expansion (0/1)
• Is Decay (0/1)
• Is Transition (0/1)
These exports allow VSI to be used as a filter in Pine Script strategies or alert conditions.
█ ORIGINALITY
While ATR and volatility indicators are common, VSI is original because it:
1. Classifies volatility into behavioral states rather than showing raw levels
2. Applies momentum analysis to volatility itself (rate-of-change of ATR)
3. Uses stability filtering to detect genuinely unstable conditions
4. Implements persistence logic to prevent state flickering
5. Provides a state-first visual design optimized for instant recognition
VSI is state-first: it classifies volatility regimes (Expansion/Decay/Transition) rather than plotting volatility level alone, using momentum and stability to reduce false regime reads.
This is not a modified ATR or Bollinger Band — it is a volatility regime classifier.
█ SUITABLE MARKETS
Works on: Stocks, Futures, Forex, Crypto
Timeframes: All timeframes — state classification adapts accordingly
Best on: Instruments with consistent volatility patterns
█ RELATED
• Market Efficiency Ratio — measures price path efficiency
• Effort-Result Divergence — compares volume effort to price result
█ DISCLAIMER
This indicator is for educational purposes only. It does not constitute financial advice. Past performance does not guarantee future results. Always conduct your own analysis before making trading decisions.

GC1 Participation Regime - sudoThis indicator analyzes COMEX GC1! futures activity and maps it directly onto your XAU price chart, allowing you to see when gold futures participation meaningfully increases or fades - without cluttering your workflow.
Here is the TLDR version of the description (below):
The "regime" is calculated by measuring how active GC1! futures are, compared to their own recent history. On each bar, the indicator looks at two things - volume (how much trading occurred) and true range (how much price actually moved). Each of these is compared to its recent average using a normalized score, which simply answers whether today’s activity is higher, normal, or lower than usual. Those two normalized values are then combined into a single participation score , optionally smoothed to reduce noise. That score is compared against user-defined thresholds and classified into one of four regimes - Low, Normal, High, or Extreme participation . In short, the regime shows whether current GC1! futures activity is unusually quiet or unusually active relative to its own recent behavior , without making any directional assumptions.
What this indicator does
-Measures GC1! futures volume and true range relative to their own historical behavior using z-scores
-Combines those metrics into a single participation score
-Classifies the market into four participation regimes
Low
Normal
High
Extreme
Projects those regimes directly onto the XAU price chart
Visual elements
Background shading
-Gray - Low participation
-Blue - Normal participation
-Green - High participation
-Orange - Extreme participation
Regime shift markers
-Upward triangle below price when participation increases
-Downward triangle above price when participation decreases
Volume-informed candle coloring (optional)
-High GC volume + bullish candle
-High GC volume + bearish candle
-Low GC volume + bullish candle
-Low GC volume + bearish candle
These visuals help you instantly identify whether price movement is occurring with real futures participation or during thinner conditions.
How to use it
-Identify high-quality environments for execution when participation is elevated
-Filter breakouts, trends, and reversals based on whether GC futures are involved
-Avoid overconfidence during low-participation regimes, where price moves are more prone to failure
-Use regime transitions as context , not signals!!
-This indicator is designed to be contextual , not predictive .
Customization
-Adjustable lookback lengths for volume and range
-Fully tunable regime thresholds
-Optional background shading
-Optional regime shift markers
-Optional candle recoloring based on GC volume behavior
Everything can be dialed up or down depending on how visually minimal you want your chart to be.
Notes
-Built specifically around COMEX GC1! futures
-Designed to disappear if GC data is unavailable
-Works on all intraday and higher timeframes

3MA Alignment Ribbon [AlgoTraderPro]3MA Alignment Ribbon is a clean, visual trend-structure indicator based on the alignment of three moving averages.
Instead of focusing on crossovers, it highlights trend quality and direction by dynamically coloring the moving averages and the ribbon between them.
The goal is simple : See at a glance whether the market structure is bullish, bearish, or neutral.
⸻
How It Works
The indicator plots three moving averages (Fast, Medium, Slow) and evaluates their alignment:
Bullish → Fast > Medium > Slow
Bearish → Fast < Medium < Slow
Neutral → Any other configuration
The moving averages and the filled ribbon between them are automatically colored based on this alignment, making trend conditions immediately visible.
⸻
Key Features
✅Multi-MA Support
Choose between:
EMA (default)
SMA
WMA
VWMA
RMA
HMA
✅ Alignment Modes
Strict: classic Fast > Medium > Slow logic
Tolerant: requires a minimum percentage separation between averages to reduce noise in ranging markets
✅ Optional Slope Filter
Filter signals by requiring the slow MA to be rising or falling, helping avoid false trend states during flat conditions.
✅ Higher Timeframe (HTF) Ribbon
Overlay the same 3MA alignment logic from a higher timeframe on your current chart:
Fully optional
Correctly calculated on the HTF itself
Option to use confirmed HTF bars only (reduces repaint confusion)
✅ Alerts & Visual Signals
Alerts when alignment turns Bullish, Bearish, or Neutral
Optional on-chart markers when the alignment flips
✅ Custom Styling
Fully customizable colors and transparency
Designed to remain readable without cluttering the chart
⸻
How to Use It
This indicator works best as:
A trend filter for discretionary trading
A context tool for entries using other setups
A market structure overlay for scalping, swing trading, or position trading
It does not generate buy/sell signals by itself — instead, it helps you trade aligned with market structure.
⸻
Default Settings
The default lengths (50 / 100 / 200 EMA) are suitable for most markets and timeframes, including crypto, forex, indices, and equities.

Price vs Moving Average Cross (Golden & Death Signals)This indicator detects price crossings against multiple moving averages, not crossings between moving averages themselves.
🔹 Core Concept
A Golden Signal occurs when the price (close) crosses above a selected moving average.
A Death Signal occurs when the price (close) crosses below a selected moving average.
⚠️ This is NOT a moving-average-to-moving-average crossover indicator.
It is a price-to-moving-average crossover indicator.
📈 Moving Average Settings
The indicator uses three independent moving averages, each configurable by the user:
1️⃣ Moving Average 1 (Golden Signal)
Default: 20-period
Type: EMA or SMA
Signal:
Price crossing above MA → Golden Signal
2️⃣ Moving Average 2 (Golden Signal)
Default: 50-period
Type: EMA or SMA
Signal:
Price crossing above MA → Golden Signal
3️⃣ Moving Average 3 (Death Signal)
Default: 100-period
Type: EMA or SMA
Signal:
Price crossing below MA → Death Signal
🔔 Signal Logic
Signal Type Condition
Golden Cross 1 Close price crosses above MA 1
Golden Cross 2 Close price crosses above MA 2
Death Cross Close price crosses below MA 3
Each signal is evaluated independently.
📊 Visual Representation
Green Up Arrow → Price crosses above MA 1
Purple Up Arrow → Price crosses above MA 2
Red Down Arrow → Price crosses below MA 3
All moving averages are plotted directly on the price chart.
🎯 Practical Use Cases
Identifying trend initiation points
Confirming pullback breakouts
Acting as an entry timing assistant
Using MA 3 as a trend filter / exit warning
⚠️ Important Notes
This indicator may generate false signals in sideways or ranging markets.
Best used in combination with:
Higher-timeframe trend confirmation
Volume indicators
Support & resistance levels
🧠 Summary
✔️ Price ↔ Moving Average crossover
❌ Moving Average ↔ Moving Average crossover
This indicator is designed for trend-following traders who want clear and simple price confirmation signals.
원하시면
“True MA Golden Cross version”
Scalping-optimized version (3m / 5m)
Trend + Momentum filtered version

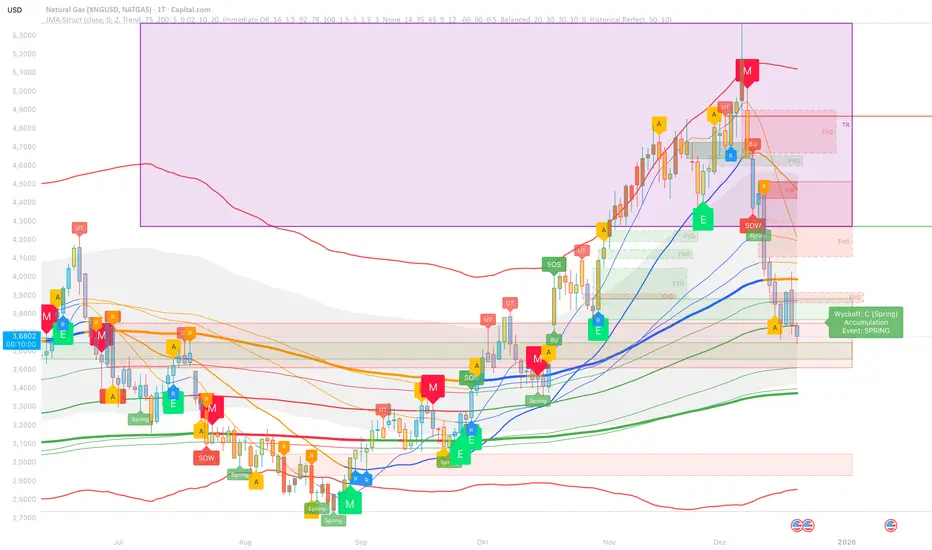
JMA Cluster Entries with Market Structure [WavesUnchained]JMA Cluster Entries with Market Structure
Overview
JMA Cluster Entries with Market Structure combines multi-timeframe JMA (Jurik Moving Average) cluster analysis with advanced market structure detection (Wyckoff methodology, Smart Money Concepts) to identify high-probability momentum and structure-based entries. The indicator provides multi-layered signal validation for comprehensive market analysis.
Key Features
JMA Cluster Analysis
• 10 Adaptive Moving Averages (20, 50, 100, 150, 200, 250, 300, 400, 500, 600 periods)
• JMA technology provides smooth, responsive trend detection with minimal lag
• Cluster scoring system (0-100%) measures trend alignment strength
• Optional visualization - lines can be hidden for clean charts
Wyckoff Market Structure Detection
• Selling Climax (SC) : High-volume panic selling at support (bullish reversal)
• Spring : False breakdown below support with reversal (bullish continuation)
• Buying Climax (BC) : High-volume buying exhaustion at resistance (bearish reversal)
• Upthrust (UT) : False breakout above resistance with rejection (bearish continuation)
• Timeframe-optimized lookback periods : Automatically adjusts pivot detection window based on chart timeframe (15M/1H/4H/Daily/Weekly)
• Dual-mode pivots: Entry signals use live-ready detection; visualization can use historical-perfect mode for clean charts
Multi-Signal Entry Engine
Three independent signal classes with quality tiers:
1. MOMENTUM (M) : Cluster flip + slope confirmation + ATR filter
2. EXHAUSTION (E) : Mean reversion at statistical extremes + volume surge
3. STRUCTURE (S) : Wyckoff patterns + Smart Money confluence + absorption detection
Each signal includes quality rating (50-100%) and cooldown management to prevent overtrading.
Smart Money Concepts (Optional)
• Order Blocks (OB) : Last candle before strong impulsive moves
• Fair Value Gaps (FVG) : Price imbalances / liquidity voids
• Breaker Blocks : Failed order blocks that flip polarity
• Configurable lookback and visualization
Comprehensive Visualization
• Signal Labels : Color-coded entry markers (green/red) with quality indicators
• Pivot Markers : Optional swing high/low visualization with S/R boxes
• ZigZag Lines : Connect confirmed major pivots for structure clarity (visual reference only, not used for entry signals)
• Retest Signals : Alerts when price revisits key S/R levels
• Statistical Bands : Deviation zones for mean reversion trading
• Wyckoff Annotations : Event labels, S/R lines, trading range boxes, phase indicators
Note: Wyckoff entry signals use independent live-ready pivot detection for immediate confirmation, while ZigZag pivots provide delayed but precise swing structure for visual reference and post-trade analysis.
Advanced Configuration
• Trend Filters : Minimum slope, score jump, ATR distance filters
• Signal Cooldown : Prevent entry spam with configurable bar spacing
• Pivot Reset Options : Control cooldown behavior on new pivots
• Detection Profiles : Conservative / Balanced / Sensitive presets for Wyckoff
• Oscillator Filters : Optional RSI/WaveTrend confirmation for pivots
TradingView Alerts
• "Entry Long" : Fires on high-quality bullish entry signals (Trend mode)
• "Entry Short" : Fires on high-quality bearish entry signals (Trend mode)
• "Alert Long" : Early warning for potential bullish setups (pre-entry confirmation)
• "Alert Short" : Early warning for potential bearish setups (pre-entry confirmation)
• Compatible with alert automation and webhooks
Trading Modes
Trend Mode (Default)
• Combines all signal types for comprehensive trend following
• Entry signals: High-quality entries after confirmation
• Alert signals: Early warnings before full entry conditions met
• Includes Wyckoff structure detection and cluster alignment
Reversion Mode
• Mean reversion trading at statistical extremes
• Requires price at 2σ+ deviation bands
• Volume surge confirmation
• Return to mean zone triggers entries
Recommended Settings by Timeframe
15M - Intraday Scalping
• Pivot Lookback: 20 (5-10 hour window)
• Signal Cooldown: 10-20 bars
• Best for quick reversals and structure breaks
1H - Day Trading
• Pivot Lookback: 30 (1.25 day window)
• Signal Cooldown: 15-25 bars
• Highest volume quality (avg 2.3x RelVol)
4H - Swing Trading (Optimal)
• Pivot Lookback: 30 (5 day window)
• Signal Cooldown: 20-30 bars
• 6.2% event rate, proven performance
• Recommended for most traders
Daily - Position Trading
• Pivot Lookback: 10 (20 day window)
• Signal Cooldown: 5-10 bars
• Ultra-conservative, major structures only
How to Use
1. Enable JMA Lines initially to understand cluster behavior
2. Watch for Signal Labels : Green (Long), Red (Short)
3. Check Signal Quality : Labels show M/E/S class and 50-100% rating
4. Confirm with Wyckoff : SC/Spring for longs, BC/UT for shorts
5. Set TradingView Alerts : Use "Signal Long" and "Signal Short" alerts
6. Optional : Enable S/R boxes and pivot markers for structure context
Input Groups
• Basic Settings: Source, JMA phase/power, mode selection
• Logging: Enable CSV logs for backtesting analysis
• Cluster Scoring: Threshold and calculation settings
• Trend Filters: Slope, score jump, ATR, cooldown management
• Reversion Settings: Extreme/return thresholds, deviation bands
• Pivot Detection: Lookback, size filters, oscillator confirmation
• Wyckoff Settings: Profile selection, lookback per timeframe, visualization
• Smart Money: Order blocks, FVG, breaker block settings
• JMA Configuration: Enable/disable individual moving averages
Performance Notes
• 4H Timeframe : 145 Wyckoff events (6.16% rate), 78.7% win rate in backtests
• 1H Timeframe : 84 events (1.86% rate), 2.33x average RelVol
• 15M Timeframe : 83 events (1.87% rate), balanced event distribution
• Daily Timeframe : 7 events (1.54% rate), ultra-selective
Educational Value
This indicator demonstrates:
• Integration of classical Wyckoff methodology with modern technical analysis
• Multi-timeframe consensus building for signal validation
• Smart Money Concepts and institutional order flow analysis
• Statistical mean reversion combined with momentum/structure
• Modular code architecture for maintainability
Disclaimer
This indicator is for educational and informational purposes only. It does not constitute financial advice. Always practice proper risk management and test strategies thoroughly before live trading. Past performance does not guarantee future results.
Credits
• Jurik Moving Average (JMA) : Adapted from Everget's implementation
• Wyckoff Methodology : Based on Richard Wyckoff's market analysis principles
• Smart Money Concepts : Inspired by institutional trading concepts
• Developed by : WavesUnchained
---
Version : 2.1.0
Pine Script : v6
Compatibility : TradingView Free/Pro/Premium
ORB Breakout & RetestORB Breakout & Breakdown Indicator - Complete Opening Range Strategy
Description :
The ORB (Opening Range Breakout) Breakout & Retest Indicator is a simple tool designed to identify opening range breakouts and breakdowns with retest confirmation. This indicator works on ANY timeframe while automatically analyzing 1-minute price action to detect precise entry signals.
What makes this indicator unique:
- ✅ Multi-Timeframe ORB Analysis - Simultaneously tracks 5-min, 15-min, and 30-min opening ranges
- ✅ Smart Retest Logic - Filters false breakouts by requiring price to retest and confirm the level
- ✅ Works on Any Chart Timeframe - View on 5-min, 15-min, 1-hour, or daily charts while getting 1-minute precision
- ✅ Both Long & Short Signals - Detects bullish breakouts AND bearish breakdowns
- ✅ Customizable Alerts - Get notified when confirmed setups occur
- ✅ Clean Visual Display - Compact table showing all ORB levels and signal status
How it Works:
Opening Range Detection :
- 5-Min ORB: Captures high/low from 9:30-9:35 AM
- 15-Min ORB: Captures high/low from 9:30-9:45 AM
- 30-Min ORB: Captures high/low from 9:30-10:00 AM
Breakout Confirmation (3-Step Process) :
1. Initial Break - Price closes above ORB High (or below ORB Low for shorts)
2. Retest - Price pulls back to retest the broken level
3. Confirmation - Price breaks through again, confirming the trend
This retest requirement dramatically reduces false signals and helps you enter trades with better risk/reward.
Perfect For :
- Day traders looking for opening range strategies
- Scalpers who need precise entry signals
- Swing traders identifying strong intraday momentum
- Anyone trading stocks, futures, forex, or crypto during market hours
---
⚙️ Settings & Customization :
Display Options :
- ☑️ Show ORB High (Default: OFF) - Display the high of each opening range in the table
- ☑️ Show ORB Low (Default: OFF) - Display the low of each opening range in the table
- ☑️ Show Breakout+Retest (Default: ON) - Show bullish breakout confirmation status
- ☑️ Show Breakdown+Retest (Default: ON) - Show bearish breakdown confirmation status
Alert Options :
- ☑️ Enable 5-Min Alerts (Default: OFF) - Get alerts for 5-minute ORB confirmations
- ☑️ Enable 15-Min Alerts (Default: OFF) - Get alerts for 15-minute ORB confirmations
- ☑️ Enable 30-Min Alerts (Default: OFF) - Get alerts for 30-minute ORB confirmations
Visual Indicators :
- Green triangles (▲) below bars = Breakout confirmed (bullish)
- Red triangles (▼) above bars = Breakdown confirmed (bearish)
- Triangle sizes: Tiny (5-min), Small (15-min), Normal (30-min)
---
Table Legend:
Timeframe Row: Shows the three ORB periods being tracked
ORB High Row: (Optional) The highest price during each opening range period
ORB Low Row: (Optional) The lowest price during each opening range period
Breakout+Retest Row:
- 🟢 YES = Bullish setup confirmed (price broke high, retested, and confirmed)
- 🔴 NO = No confirmed bullish setup yet
- ⚪ N/A = Opening range not yet established
Breakdown+Retest Row:
- 🟢 YES = Bearish setup confirmed (price broke low, retested, and confirmed)
- 🔴 NO = No confirmed bearish setup yet
- ⚪ N/A = Opening range not yet established
How to Use :
1. Add to Chart - Works best on stocks, futures, and indices with regular market hours (9:30 AM EST open)
2. Choose Your Timeframe - View on any timeframe; indicator automatically analyzes 1-minute data
3. Monitor the Table - Watch for "YES" signals in Breakout or Breakdown rows
4. Set Alerts - Enable alerts for your preferred ORB timeframes
5. Plan Your Trade - Use ORB levels as entry points and initial stop-loss levels
Tips :
- Combine multiple timeframe confirmations for higher probability setups
- Use ORB High/Low levels as natural support/resistance zones
- The 5-min ORB gives faster signals; 30-min ORB gives stronger trends
- Best results typically occur in the first 1-2 hours after market open
- Works on all markets but optimized for regular trading hours (9:30 AM EST)
Key Features Summary :
✓ Multi-timeframe opening range tracking (5, 15, 30-minute)
✓ Retest confirmation logic to filter false breakouts
✓ Works on any chart timeframe with 1-minute precision
✓ Bullish and bearish signal detection
✓ Customizable visual display with toggle options
✓ Individual alerts for each timeframe and direction
✓ Clean, professional table interface
✓ No repainting - signals are final once confirmed
✓ Suitable for all experience levels

Day Color CandlesThe script uses TradingView’s built-in dayofweek value (where Monday = 1 and Sunday = 7) to detect the current bar’s weekday.
For each weekday, a specific color is assigned — green for Monday, blue for Tuesday, purple for Wednesday, orange for Thursday, yellow for Friday, gray for Saturday, and red for Sunday.
Instead of plotting new candles, the script uses barcolor() to recolor the existing chart candles. This avoids conflicts with TradingView’s rule that a script may contain only one main declaration. The price data remains unchanged — only the visual appearance of the candles is modified to help the user visually separate trading days.

Work Break Area Background# Work Break Area Background
Workdays and off-hours are distinguished by background color for easy date differentiation during reviews.
---
# 工作休息时间区域背景色
工作日和非工作时间通过背景颜色区分,以便在审查期间轻松区分日期。

Daily SMA 20/50/100/200Simple Moving Averages indicator displaying four commonly used trend lines on the price chart. Plots the 20, 50, 100, and 200 period SMAs to help identify short-, medium-, and long-term trend direction, dynamic support and resistance, and overall market structure. Color-coded for clarity: 20 SMA in green, 50 SMA in blue, 100 SMA in orange, and 200 SMA in red, with uniform line thickness for clean visual consistency.

Vertical Timelines Pro |MC|Vertical Timelines Pro |MC|
Credits go to lucemanb for the great work 👍
This indicator has been further developed and enhanced with additional features.
Vertical Timelines Pro is a customizable time-based indicator designed to mark important intraday timestamps directly on the chart. It helps traders visualize recurring market moments such as True Day Open, session opens, macro events, or personal timing models with precise vertical reference lines.
The indicator allows you to define multiple custom times, each with its own color and on/off toggle. All timestamps are calculated using a selectable timezone, ensuring consistent and accurate alignment across different markets and chart settings.
Optional labels can be displayed at each timeline to clearly identify the corresponding time. To keep the chart clean and readable, the number of visible labels can be limited retroactively. Due to Pine Script limitations, this setting only affects labels—plotted lines are not impacted.
💎 Key Features 💎
Multiple configurable intraday time markers
Timezone-aware calculations
Individual color and visibility control per line
Optional time labels with customizable size and colors
Historical label limiting to reduce chart clutter
Lightweight and suitable for all intraday timeframes
This indicator is ideal for traders who rely on time-based market behavior, session structure, or repeatable intraday cycles.
Happy Trading!

Order Flow Trade Detector [Dynamic Sizes]detects absorption in the market and gives an idea where buyers and sellers are.

GC1 Orderflow Engine - sudoTLDR
This indicator measures relative buying and selling pressure by comparing GC1! futures returns against XAU price returns, normalized by their own volatility and weighted by GC1! volume. The result is a pressure histogram and line that show whether futures orderflow is leading, lagging, or diverging from spot gold in real time.
What this indicator does
The Orderflow Engine is designed to answer one core question:
Is GC1! futures orderflow applying net pressure in the same direction as XAU, or pushing against it?
It does this by isolating relative strength and weakness between futures and spot, rather than looking at price direction alone.
How the pressure calculation works
1. GC1! futures returns and XAU returns are calculated bar by bar
2. Each return is normalized by its own recent volatility
3. The normalized XAU return is subtracted from the normalized GC1! return
This creates a relative pressure value:
Positive pressure - GC1! futures are outperforming XAU
Negative pressure - GC1! futures are underperforming XAU
Near zero - futures and spot are moving in balance
To emphasize meaningful activity:
GC1! volume is converted into a normalized score
Higher-than-normal futures volume increases the weight of the pressure
Low-volume pressure is naturally dampened
The final output is clamped to keep the scale stable across different market conditions.
Visual output
Histogram
Green bars - positive futures pressure
Red bars - negative futures pressure
Gray bars - neutral or minimal pressure
Pressure line
A smoother view of the same pressure data
Useful for spotting momentum shifts and divergence
Zero line
Represents balance between futures and spot
Crosses often mark changes in orderflow control
Optional annotations
Regime shift markers based on futures participation
Optional percent-change labels for studying pressure acceleration
How to use it
-Confirm whether price moves are supported by futures orderflow
-Spot early divergence between GC1! and XAU
-Identify absorption , distribution , or initiative behavior
-Filter entries by trading only when pressure aligns with your bias
-This tool is best used as confirmation and context, not as a standalone signal generator.
Design philosophy
-Self-normalizing across sessions and volatility regimes
-No fixed thresholds that break over time
-Focused on relative behavior, not prediction
-Built to pair naturally with the Participation Regime indicator

Absorption DetectorSource: Prof Michael G.
Credit: GreatestUsername for the coding & implementation.
Zones of Support and Resistance can feel like drawing boxes on the chart. This indicator to help spot areas of possible reversal. It uses Volume Confirmation and Body-to-Wick Ratio to do this and defined as:
1. Volume Confirmation
High Volume: A candle that absorbs sitting limit orders is often accompanied with higher than average volume. The indicator define this type of candle if it has a volume is greater than 250%/350% of the average volume over the last 10 candles.
2. Body-to-Wick Ratio
Body vs. Wick: A candle with a small body and large wicks can indicate higher probability of reversal. You can define an absorption candle if the body of the candle is less than 50% of the total range (high-low).
These settings are also customizable to your own desired settings and should be used as a visual aid.

Triple EMA// Triple EMA indicator designed for TradingView free users.
// Displays 3 standard EMAs in one indicator slot.

Bull/Bear vs Base vs Index (% Change Spread)Visualizes the performance gap ("Beta Decay") between 3x Leveraged ETFs (SOXL/SOXS) and their underlying sector (SOXX), relative to the S&P 500 (SPY).
This indicator is designed for traders who trade leveraged products (like SOXL/SOXS, TQQQ/SQQQ) and need to see true relative strength beyond simple price action.
It calculates the percentage change over a user-defined lookback period for four instruments:
Base (1x): The sector benchmark (Default: SOXX).
Bull (3x): The leveraged long ETF (Default: SOXL).
Bear (-3x): The leveraged inverse ETF (Default: SOXS).
Index: The broad market zero-line (Default: SPY).
It then plots the Spread to reveal the health of the trend:
Bull Spread (Green Line): Bull % - Base %
Bear Spread (Red Line): Bear % - Base %
Base vs Index (Filled Area): Base % - SPY %
🧠 The Logic: Why Use Spreads?
In a perfectly efficient trending market, a 3x Bull ETF should move exactly 300% of the underlying asset. However, in choppy or volatile markets, volatility decay (beta slippage) causes leveraged ETFs to underperform mathematically.
Positive Spread: The leveraged ETF is successfully capturing momentum (The "Sweet Spot").
Negative Spread: The leveraged ETF is suffering from drag or the underlying asset is chopping.
📈 Recommended Trading Plan
Note: This indicator works best as a filter for entry conditions, not a standalone signal. Always use proper risk management.
Strategy A: The "Clean Trend" (Momentum)
Goal: Enter a 3x position only when volatility drag is minimal.
1. Bull Signal:
Condition 1: The Base vs Index (Area) is Green (Sector is outperforming SPY).
Condition 2: The Bull Spread (Green Line) is Positive (> 0).
Why: This confirms the sector is strong AND the 3x ETF is amplifying that move efficiently without decay eating the profits.
2. Bear Signal:
Condition 1: The Base vs Index (Area) is Red (Sector is lagging SPY).
Condition 2: The Bear Spread (Red Line) is Positive (> 0).
Why: This confirms the sector is crashing and the Bear ETF is successfully capturing the downside momentum.
Strategy B: The "Decay Avoidance" (Cash is King)
Goal: Avoid leveraged funds during chop.
Condition: If BOTH the Bull Spread and Bear Spread are Negative (< 0) (below the zero line).
Action: Stay in Cash or trade the 1x underlying (SOXX) only.
Why: When both spreads are negative, it mathematically proves that the market is too choppy for leverage. Both the Long and Short leveraged funds are losing value relative to the underlying asset.
Features:
Pine Script® v6: Updated for the latest engine performance and visuals.
Dashboard Table: Real-time percentage spreads displayed directly on the chart (customizable position).
Fully Customizable: Works on any sector (e.g., set inputs to QQQ/TQQQ/SQQQ for Tech).
Disclaimer:
Trading leveraged ETFs involves significant risk. This script is for educational purposes only.

Market Pressure Regime [Interakktive]The Market Pressure Regime (MPR) is a 4-state market classifier that models how structural forces create "pressure zones" — regions where price movement is either supported (Release) or suppressed (Pinned) by market microstructure.
It combines compression analysis, follow-through efficiency, and stress detection into a composite pressure score, classifying markets into Release, Suppressed, Transition, or Trap states — helping traders understand WHY price is moving (or not moving) in the current environment.
█ USAGE
MPR addresses a core question traders face: Is the market in a regime where directional moves are likely to follow through, or is it structurally pinned?
For swing traders, MPR identifies Release phases where momentum strategies work best, and Suppressed phases where mean reversion dominates.
For day traders, it highlights Trap conditions — high effort with no follow-through — where reversals are probable and trend entries fail.
🔹 The 4-State Model
The indicator classifies markets into four distinct regimes:
• Release (Teal): Pressure score ≥ +5. Directional flow dominates. Price moves efficiently with follow-through. Favor trend continuation.
• Suppressed (Grey): Pressure score ≤ -5. Compression dominates. Price is range-bound or pinned. Fade extremes, expect reversion.
• Transition (Amber): Score between thresholds OR instability detected. Regime is uncertain — wait for confirmation before committing.
• Trap (Magenta): High stress + low follow-through. Effort without result. Expect reversals.
🔹 Reading the Pressure Histogram
The histogram displays the composite Pressure Score (range approximately -100 to +100):
• Positive values: Follow-through exceeds compression. Market is "releasing" — directional moves are supported.
• Negative values: Compression exceeds follow-through. Market is "suppressed" — price movement is constrained.
• Color reflects confirmed state: The histogram uses persistence filtering — a state must hold for N bars before the color changes, preventing false signals from noise.
🔹 The 5-Stage Calculation
MPR synthesizes five analytical stages into the final state:
1. Compression Score: Measures how tight the current range is relative to ATR. High compression suggests structural forces are pinning price.
2. Follow-Through Score: Measures price path efficiency (MER-style). Efficient moves indicate genuine directional flow, not chop.
3. Stress Score: Detects effort-without-result (ERD-style). High volume or range with no price progress = absorption.
4. Composite Pressure: Combines follow-through and compression into a single directional score.
5. Persistence Filter: Requires states to hold for configurable bars before confirming, eliminating flickering.
█ SETTINGS
Core Settings
• ATR Length: Period for volatility normalization. Default 14.
• Baseline Lookback: Period for compression and efficiency baselines. Default 20.
• Volume Average Length: Period for stress calculation baseline. Default 20.
State Classification
• Release Threshold: Pressure score above this = Release. Default +5.
• Suppressed Threshold: Pressure score below this = Suppressed. Default -5.
• Trap Threshold: Stress score above this (with low follow-through) = Trap. Default 30.
• Persistence Bars: Bars required to confirm state change. Default 3.
• Stability Lookback: Period for stability calculation. Default 20.
• Stability Threshold: Below this = forced Transition state. Default 0.5.
Visual Settings
• Show Pressure Histogram: Display the main pressure score histogram.
• Show Zero Line: Display the zero reference line.
• Show Background Tint: Subtle background color by state (default OFF).
Data Window
• Show Data Window Values: Export all calculated scores for analysis.
█ INTERPRETATION GUIDE
When to Use Trend Strategies (Release):
• Histogram tall and positive
• Teal coloring confirmed
• Price making efficient higher highs or lower lows
When to Use Mean Reversion (Suppressed):
• Histogram flat or negative
• Grey coloring confirmed
• Price oscillating without follow-through
When to Wait (Transition):
• Amber coloring
• Mixed signals — don't force trades
• Wait for state to resolve
When to Expect Reversals (Trap):
• Magenta coloring
• High volume moves that don't stick
• Often occurs at structural inflection points
█ COMPLEMENTARY TOOLS
MPR pairs well with:
• Volatility State Index (VSI) — Confirms whether volatility is expanding into the pressure regime
• Effort-Result Divergence (ERD) — Provides bar-by-bar absorption/vacuum detection
• Market Efficiency Ratio (MER) — Validates follow-through quality
█ SUITABLE MARKETS
Works across all liquid markets:
• Equities: SPY, QQQ, liquid single stocks
• Futures: ES, NQ, CL, GC
• Crypto: BTC, ETH
• Forex: Major pairs
Works on any timeframe, but 1H–Daily provides cleanest regime classification. Intraday (5m–15m) useful for session-level tactical decisions.
█ OPEN SOURCE
This indicator is open-source for educational purposes. Review the code to understand the full calculation methodology.
█ DISCLAIMER
This indicator is for educational and informational purposes only. It does not constitute financial advice. Past performance does not guarantee future results. Always conduct your own analysis and use proper risk management.

Friday Statistical Zones - Last 30 Fridays Only BTC 📊 Friday Statistical Zones (Pre / Dump / After)
This indicator highlights statistical risk zones for Fridays, based on the last 30 completed Fridays.
It analyzes historical price and volume behavior to determine:
• When a Pre-Dump phase typically starts
• When selling pressure statistically peaks
• When the After-Dump phase usually occurs
The result is a time-based overlay with three zones:
🟡 Pre-Dump · 🔴 Dump · 🟡 After-Dump
⚠️ This is not a signal indicator.
It does not predict price direction.
It provides risk-timing context only.
Best used for risk management and situational awareness on Fridays, not as a standalone trading strategy.

Flux Portfolio Visualizer | GL0WDASHFlux Portfolio Visualizer | GL0WDASH
Flux Portfolio Visualizer lets you simulate and track the performance of a multi-asset portfolio directly on the chart.
Choose up to 10 assets, assign custom allocation weights, and set a start date to generate a real-time equity curve based on historical price data.
The script performs one-time proportional allocation at the start date and then tracks equity forward without rebalancing, giving you a realistic view of how your portfolio would have evolved over time. It also includes a maximum equity drawdown tracker and an optional level line for reference.
Features:
• Allocate to up to 10 assets with custom weight percentages
• Specify initial capital and simulation start date
• Real-time equity curve based on confirmed bars
• Maximum equity drawdown tracking + table display
• Optional horizontal reference line
• Designed for long-horizon allocation experiments
Great for:
• Passive portfolio stress-testing
• Comparing allocation strategies
• Evaluating long-term crypto/asset mixes
• Visualizing risk via max drawdowns
This tool does not execute trades or rebalance—its purpose is pure visualization, giving traders clarity about how portfolios behave under different allocation assumptions.
If you expand or modify the indicator, please credit the original author.


OKXJsonLibrary "OKXJson"
f_buildId(prefix, instrument)
Parameters:
prefix (string)
instrument (string)
f_utcTimestamp()
f_investmentType(internalAction, entryType, closeType)
Parameters:
internalAction (string)
entryType (string)
closeType (string)
f_build(id, okxAction, marketPosition, prevMarketPosition, instrument, signalToken, timestampUtc, investmentType, amount, maxLagSeconds)
Parameters:
id (string)
okxAction (string)
marketPosition (string)
prevMarketPosition (string)
instrument (string)
signalToken (string)
timestampUtc (string)
investmentType (string)
amount (string)
maxLagSeconds (string)

RVOL Text This script will give you the Relative volume at the time in a numbered text on your charts.

Prop ES EMA Cross during Single/Dual Trading SessionEMA crossover strategy for ES futures optimized for prop firm rules.
Choose long-only, short-only, or both directions.
Customizable short and long EMA lengths.
Enter trades during one or two configurable sessions specified in New York time.
Fixed TP/SL in ticks with forced close by 4:59 PM NY time.
