Participation-Weighted Orderflow Bubbles (HTF / LTF Context ToolThis indicator visualizes participation-weighted market pressure by aggregating lower-timeframe price and volume data into higher-timeframe context bubbles. It is designed to help identify directional dominance, balance, and absorption across timeframes. This is a context and bias tool, not a trade signal generator.
What the indicator shows
Each bubble represents a single chart bar, built from lower-timeframe candles.
Total Notional
Aggregated volume multiplied by price from lower-timeframe candles.
Buy / Sell Proxies
Lower-timeframe candles are classified based on where they close within their range:
– Close near the high → buy-side proxy
– Close near the low → sell-side proxy
– Middle of the range → neutral
Delta (USD and %)
Buy proxy notional minus sell proxy notional, expressed as both absolute USD delta and percentage of total notional.
Bubble colors
Green
Buy-side participation dominance.
Sell color (user configurable)
Sell-side participation dominance. The default is chosen for visibility on bearish candles and can be changed in settings.
Grey
Balanced participation. Indicates two-way trade, consolidation, or auction.
Yellow (Absorption)
High notional with limited price movement, suggesting potential absorption or distribution.
Coloring uses both relative dominance (delta percentage) and absolute dominance (minimum delta in USD), which improves behavior on higher timeframes.
Bubble size and visuals
Bubble size scales with total notional.
HD glow layers adapt automatically by timeframe.
Bubbles are drawn in front of candles for clarity.
Optional text displays delta and total notional.
Hovering over a bubble shows detailed information including total notional, buy/sell/neutral proxies, delta values, absorption status, and the number of lower-timeframe candles used.
Timeframe behavior
The indicator is designed to work across multiple timeframes. On higher timeframes, more grey bubbles are expected due to natural auction and balance behavior. Colored bubbles on higher timeframes represent sustained participation rather than short-term momentum. Visual density and performance are automatically adjusted on higher timeframes.
How to use it
Recommended workflow:
1. Higher timeframe (1H, 4H, Daily)
Use the bubbles to identify dominant buy or sell participation, balance zones, and absorption near highs or lows.
2. Lower timeframe (5m, 15m)
Take trades in alignment with the most recent higher-timeframe dominance. Be cautious or range-focused inside higher-timeframe balance zones. Use structure and price action for entries.
What this indicator is not
This indicator does not show true bid/ask data.
It does not display actual market versus limit orders.
It does not replace a DOM or exchange orderflow feed.
It should not be used as a standalone entry signal.
The indicator works within TradingView’s available data and provides a probabilistic, participation-weighted view of market pressure rather than true tape or orderflow data.
Best practices
Use a 1-minute lower timeframe for best results.
Avoid setting the lower timeframe too high relative to the chart timeframe.
Combine this tool with structure, levels, and session context.
Treat grey bubbles as information about balance, not as noise.
This tool is intended for traders who want better context and bias, not more signals.
지표 및 전략

Engulfing Strategy Core Concept:
This is a price action trading strategy that identifies high-probability trade setups by combining multi-timeframe engulfing patterns with Current Market Price (CMP) validation.
How It Works:
H4 Setup Zone (Primary Timeframe)
Identifies Bullish or Bearish Engulfing patterns on the 4-hour timeframe
When detected, marks a zone at the high and low of the engulfed candle
This zone represents the initial setup area
M30 Trade Control Zone (Confirmation Timeframe)
Looks for Engulfing patterns on the 30-minute timeframe
These patterns must form within or near the H4 setup zone
Acts as a confirmation that the setup is valid
CMP Validation (Current Market Price)
Monitors where price is currently trading relative to the zones
Validates whether the pattern is still active or has been invalidated
Helps determine entry timing and stop loss placement
Trade Setup:
Bullish Setup: Red candle engulfed by green candles → Zone marked at red candle's high/low → Wait for M30 confirmation → Enter when CMP validates the pattern
Bearish Setup: Green candle engulfed by red candles → Zone marked at green candle's high/low → Wait for M30 confirmation → Enter when CMP validates the pattern

Highs & LowsIntroduction: This indicator marks highs and lows from the previous New York, Asian, and London sessions, including the daily high and low. It is made to be as user friendly/adjustable as possible.
It was designed around trading during the New York morning session, using the 1 hour and 1 minute(or similar) timeframes in conjunction.
Settings: Common settings for the cleanest viewing are as follows:
1 Hour Chart Settings:
Box #3 "Label Vertical Offset" to "18".
Box #4 "Label X Offset" to "2".
1 Minute Chart Settings:
Box #3 "Label Vertical Offset" to "2".
Box #4 "Label X Offset" to "0".
Note: Adjusting text to the darkest "black" setting may provide the best contrast.


RSI Divergence Indicator (Fixed RSI Color + MTF Table)This script combines a classic RSI divergence indicator with a multi–timeframe RSI dashboard.
Main features:
Detects and plots:
Regular bullish & bearish RSI divergence
Hidden bullish & hidden bearish RSI divergence
Dynamic RSI line color:
Green in strong bullish zone
Red in strong bearish zone
Yellow in neutral zone
Standard RSI levels:
70 / 30 overbought–oversold
50 midline with highlighted band
MTF RSI table:
Compact RSI dashboard on the right side of the chart
Timeframes: 1m, 5m, 15m, 30m, 1h, 4h, 8h, 12h, 1D (each can be turned on/off)
Background color highlights extreme RSI:
Red / orange for overbought
Lime for oversold
This tool is designed to help traders quickly see divergence signals on the current chart while also monitoring RSI conditions across multiple timeframes in one place.

CryptoFlux Dynamo [JOAT]CryptoFlux Dynamo: Velocity Scalping Strategy
This Pine Script v6 strategy is designed for cryptocurrency markets operating on 5-minute and faster timeframes. It combines volatility regime detection, multi-path signal confirmation, and adaptive risk management to identify momentum-based trading opportunities in perpetual futures markets.
Core Design Principles
The strategy addresses three challenges specific to cryptocurrency trading:
24/7 market operation without session boundaries requires continuous monitoring and execution logic
Volatility regimes shift rapidly, demanding adaptive stop and target calculations
Tick-level responsiveness is critical for capturing momentum moves before they complete
Strategy Architecture
1. Signal Generation Stack
The strategy uses multiple technical indicators calibrated for cryptocurrency momentum:
MACD with parameters 8/21/5 (fast/slow/signal) optimized for crypto acceleration phases
EMA ribbon using 8/21/34 periods with slope analysis to assess trend structure
Volume impulse detection combining SMA baseline, standard deviation, and z-score filtering
RSI (21 period) and MFI (21 period) for momentum confirmation
Bollinger Bands and Keltner Channels for squeeze detection
2. Volatility Regime Classification
The strategy normalizes ATR as a percentage of price and classifies market conditions into three regimes:
Compression (< 0.8% ATR): Reduced position sizing, tighter stops (1.05x ATR), lower profit targets (1.6x ATR)
Expansion (0.8% - 1.6% ATR): Standard risk parameters, balanced risk-reward (1.55x stop, 2.05x target)
Velocity (> 1.6% ATR): Wider stops (2.1x ATR), amplified targets (2.8x ATR), tighter trailing offsets
ATR is calculated over 21 periods and smoothed with a 13-period EMA to reduce noise from wicks.
3. Multi-Path Entry System
Four independent signal pathways contribute to a composite strength score (0-100):
Trend Break (30 points): Requires EMA ribbon alignment, positive slope, and structure breakout above/below recent highs/lows
Momentum Surge (30 points): MACD histogram exceeds adaptive baseline, MACD line crosses signal, RSI/MFI above/below thresholds, with volume impulse confirmation
Squeeze Release (25 points): Bollinger Bands compress inside Keltner Channels, then release with momentum bias
Micro Pullback (15 points): Shallow retracements within trend structure that reset without breaking support/resistance
Additional scoring modifiers:
Volume impulse: +5 points when present, -5 when absent
Regime bonus: +5 in velocity, -2 in compression
Cycle bias: +5 when aligned, -5 when counter-trend
Trades only execute when the composite score reaches the minimum threshold (default: 55) and all filters agree.
4. Risk Management Framework
Position sizing is calculated from:
RiskCapital = Equity × (riskPerTradePct / 100)
StopDistance = ATR × StopMultiplier(regime)
Quantity = min(RiskCapital / StopDistance, MaxExposure / Price)
The strategy includes:
Risk per trade: 0.65% of equity (configurable)
Maximum exposure: 12% of equity (configurable)
Regime-adaptive stop and target multipliers
Adaptive trailing stops based on ATR and regime
Kill switch that disables new entries after 6.5% drawdown
Momentum fail-safe exits when MACD polarity flips or ribbon structure breaks
5. Additional Filters
Cycle Oscillator : Measures price deviation from 55-period EMA. Requires cycle bias alignment (default: ±0.15%) before entry
BTC Dominance Filter : Optional filter using CRYPTOCAP:BTC.D to reduce long entries during risk-off periods (rising dominance) and short entries during risk-on periods
Session Filter : Optional time-based restriction (disabled by default for 24/7 operation)
Strategy Parameters
All default values used in backtesting:
Core Controls
Enable Short Structure: true
Restrict to Session Window: false
Execution Session: 0000-2359:1234567 (24/7)
Allow Same-Bar Re-Entry: true
Optimization Constants
MACD Fast Length: 8
MACD Slow Length: 21
MACD Signal Length: 5
EMA Fast: 8
EMA Mid: 21
EMA Slow: 34
EMA Slope Lookback: 8
Structure Break Window: 9
Regime Intelligence
ATR Length: 21
Volatility Soothing: 13
Low Vol Regime Threshold: 0.8% ATR
High Vol Regime Threshold: 1.6% ATR
Cycle Bias Length: 55
Cycle Bias Threshold: 0.15%
BTC Dominance Feed: CRYPTOCAP:BTC.D
BTC Dominance Confirmation: true
Signal Pathways
Volume Baseline Length: 34
Volume Impulse Multiplier: 1.15
Volume Z-Score Threshold: 0.5
MACD Histogram Smoothing: 5
MACD Histogram Sensitivity: 1.15
RSI Length: 21
RSI Momentum Trigger: 55
MFI Length: 21
MFI Momentum Trigger: 55
Squeeze Length: 20
Bollinger Multiplier: 1.5
Keltner Multiplier: 1.8
Squeeze Release Momentum Gate: 1.0
Micro Pullback Depth: 7
Minimum Composite Signal Strength: 55
Risk Architecture
Risk Allocation per Trade: 0.65%
Max Exposure: 12% of Equity
Base Risk/Reward Anchor: 1.8
Stop Multiplier • Low Regime: 1.05
Stop Multiplier • Medium Regime: 1.55
Stop Multiplier • High Regime: 2.1
Take Profit Multiplier • Low Regime: 1.6
Take Profit Multiplier • Medium Regime: 2.05
Take Profit Multiplier • High Regime: 2.8
Adaptive Trailing Engine: true
Trailing Offset Multiplier: 0.9
Quantity Granularity: 0.001
Kill Switch Drawdown: 6.5%
Strategy Settings
Initial Capital: $100,000
Commission: 0.04% (0.04 commission_value)
Slippage: 1 tick
Pyramiding: 1 (no position stacking)
calc_on_every_tick: true
calc_on_order_fills: true
Visualization Features
The strategy includes:
EMA ribbon overlay (8/21/34) with customizable colors
Regime-tinted background (compression: indigo, expansion: purple, velocity: magenta)
Dynamic bar coloring based on signal strength divergence
Signal labels for entry points
On-chart dashboard displaying regime, ATR%, signal strength, position status, stops, targets, and risk metrics
Recommended Usage
Timeframes
The strategy is optimized for 5-minute charts. It can operate on 3-minute and 1-minute timeframes for faster scalping, or 15-minute for swing confirmation. When using higher timeframes, consider:
Increasing structure lookback windows
Raising RSI trigger thresholds above 58 to filter noise
Extending volume baseline length
Markets
Designed for high-liquidity cryptocurrency perpetual futures:
BTC/USDT, BTC/USD perpetuals
ETH perpetuals
Major L1 tokens with sufficient volume
For thinner order books, increase volume impulse multiplier and adjust quantity granularity to match exchange minimums.
Limitations and Compromises
Backtesting Considerations
TradingView strategy backtesting does not replicate broker execution. Actual fills, slippage, and commissions may differ
The strategy uses calc_on_every_tick=true and calc_on_order_fills=true to reduce bar-close distortions, but real execution still depends on broker infrastructure
At least 200 historical bars are required to stabilize regime classification, volume baselines, and cycle context
Market Structure Dependencies
BTC dominance feed ( CRYPTOCAP:BTC.D ) may lag during low-liquidity periods or weekends. Consider disabling the filter if data quality degrades
Volume impulse detection assumes consistent order book depth. During extreme volatility or exchange issues, volume signatures may be unreliable
Regime classification based on ATR percentage assumes normal volatility distributions. During black swan events, regime thresholds may not adapt quickly enough
Parameter Sensitivity
Default parameters are tuned for BTC/ETH perpetuals on 5-minute charts. Different assets or timeframes require recalibration
The composite signal strength threshold (55) balances selectivity vs. opportunity. Higher values reduce false signals but may miss valid setups
Risk per trade (0.65%) and max exposure (12%) are conservative defaults. Aggressive scaling increases drawdown risk
Execution Constraints
Same-bar re-entry requires broker support for rapid order placement
Quantity granularity must match exchange contract minimums
Kill switch drawdown (6.5%) may trigger during normal volatility cycles, requiring manual reset
Performance Expectations
This strategy is a framework for momentum-based cryptocurrency trading. Performance depends on:
Market conditions (trending vs. ranging)
Exchange execution quality
Parameter calibration for specific assets
Risk management discipline
Backtest results shown in publications reflect specific market conditions and parameter sets. Past performance does not indicate future results. Always forward test with paper trading or broker simulation before deploying live capital.
Code Structure
The strategy is organized into functional sections:
Configuration groups for parameter organization
Helper functions for position sizing and normalization
Core indicator calculations (MACD, EMA, ATR, RSI, MFI, volume analytics)
Regime classification logic
Multi-path signal generation and composite scoring
Entry/exit orchestration with risk management
Visualization layer with dashboard and chart elements
The source code is open and can be modified to suit your trading requirements. Everyone is encouraged to understand the logic before deploying and to test thoroughly in their target markets.
Modification Guidelines
When adapting this strategy:
Document any parameter changes in your publication
Test modifications across different market regimes
Validate position sizing logic for your exchange's contract specifications
Consider exchange-specific limitations (funding rates, liquidation mechanics, order types)
Conclusion
This strategy provides a structured approach to cryptocurrency momentum trading with regime awareness and adaptive risk controls. It is not a guaranteed profit system, but rather a framework that requires understanding, testing, and ongoing calibration to market conditions.
You should thoroughly understand the logic, test extensively in their target markets, and manage risk appropriately. The strategy's effectiveness depends on proper parameter tuning, reliable execution infrastructure, and disciplined risk management.
Disclaimer
This script and its documentation are for educational and informational purposes only. They do not constitute financial advice, investment recommendations, or trading advice of any kind. Trading cryptocurrencies and derivatives involves substantial risk of loss and is not suitable for all investors. Past performance, whether real or indicated by backtesting, does not guarantee future results.
This strategy is provided "as is" without any warranties or guarantees of profitability
You should not rely solely on this strategy for making trading decisions
Always conduct your own research and analysis before making any financial decisions
Consider consulting with a qualified financial advisor before engaging in trading activities
The authors and contributors are not responsible for any losses incurred from using this strategy
Cryptocurrency trading can result in the loss of your entire investment
Only trade with capital you can afford to lose
Use this strategy at your own risk. The responsibility for any trading decisions and their consequences lies entirely with you.

Gold Smart Scalper V3 - Clean ChartOverview
The Gold Smart Scalper V3 is a trend-following momentum strategy specifically optimized for XAU/USD (Gold). It focuses on catching "value pullbacks" within a strong trend, avoiding the noise of sideways markets. Unlike many scalpers that use lagging indicators for exits, this version uses fixed ATR-based targets to lock in profits during high-volatility moves common in Gold.
Core Methodology
The strategy operates on three layers of confirmation:
Macro Trend (HTF Filter): Uses a 50-period EMA to ensure trades are only taken in the direction of the higher-timeframe momentum.
The Value Zone: Instead of "chasing" green or red candles, the script waits for a pullback to the space between the 9 EMA and 21 EMA. This ensures a better risk-to-reward entry point.
The Trigger: A trade is only executed when price confirms the resumption of the trend by crossing back over the signal EMA after the pullback.
Key Features
Fixed Profit Targets: Replaced dynamic trailing stops with fixed Take Profit (TP) and Stop Loss (SL) levels based on ATR, ensuring exits aren't "hunted" by Gold's signature volatility spikes.
C lean Chart Interface : All moving average plots are hidden. The only visuals provided are the active TP/SL levels when a trade is live, keeping your workspace clutter-free.
Single-Trade Logic: The script includes a "One Trade Per Cross" gate, preventing the strategy from over-trading or "stacking" positions during choppy price action.
Settings & OptimizationATR Multipliers :
Stop Loss (SL): Default $2.0 \times ATR$. Protects against standard market noise.Take Profit (TP): Default $3.0 \times ATR$. Designed for a high Risk/Reward profile.Timeframe Recommendation: Optimized for 15m and 1H for swing scalping, or 5m for aggressive scalping.Instrument: Specifically tuned for Gold (XAU/USD), but applicable to other high-volatility pairs like GBP/JPY or NASDAQ.
Disclaimer
This script is for educational and backtesting purposes only. Past performance does not guarantee future results. Always practice proper risk management.

Bhuvana Retrace Predictor It’s a “retracement warning + confirmation” tool. Nothing more.
Concept in simple words
Price runs too far too fast
The script uses EMA + ATR bands to detect when price is “stretched” (far from normal).
The run is losing power
It checks RSI divergence:
Price makes a new high but RSI doesn’t → buyers are getting weaker.
Price makes a new low but RSI doesn’t → sellers are getting weaker.
It waits for proof the pullback started
It then waits for a small structure break:
For a drop: price closes below a recent minor low.
For a bounce: price closes above a recent minor high.
What each label means
SETUP = “Retracement is likely soon” (don’t chase).
CONFIRM = “Retracement probably started” (now it’s tradable).
Brutal truth
This doesn’t predict perfectly. It just stacks 3 common signs:
overextended + weakening momentum + structure break.


Trade Secrets by Pratik - Dual Intraday StrategyThe "Trade Secrets by Pratik" strategy is a high-momentum, dual-direction trading system designed to capture explosive moves after brief market pullbacks. It relies on a rigorous combination of trend-following moving averages and a strength filter.
1. Core Concept
The strategy identifies "Clean Pullbacks"—brief pauses in a strong trend where the price stays strictly away from the short-term average (10 EMA). This indicates extreme momentum, as buyers (in an uptrend) or sellers (in a downtrend) are too aggressive to allow a deeper correction.
2. Technical Filters
Trend Direction: Price must be above both 10 and 35 EMAs for Buys, and below both for Sells.
Strength Filter (RSI): Requires an RSI > 60 for Longs (to ensure high demand) and RSI < 40 for Shorts (to ensure heavy selling pressure).
3. Trade Execution
The Setup: Look for a "Floating Candle"—a Red candle for Buys or a Green candle for Sells that does not touch the 10 EMA.
The Trigger: A trade is entered only if the very next candle breaks the "Setup Candle's" high (Buy) or low (Sell).
Risk-Reward: Aim for a fixed 1:3 Ratio, ensuring that one winner covers three losing trades.
4. Safety Logic
The system includes a "No-Same-Candle-Exit" rule, preventing the script from triggering a Stop Loss on the same bar as the Entry. This filters out immediate price "whipsaws" and ensures the trade has room to develop.

extradestrategy.limited.editiom 2026cocok untuk btc usd tidak di perjual belikan harap tidak menggunakan sembarangan

The Engulfing Liquidity Signal with Adjustable Trailing StopEngulfing Liquidity Signal with Adjustable Trailing Stop
This strategy is designed to enter long trades based on the Engulfing Liquidity Signal combined with a Trailing Stop. The strategy uses custom volume analysis and price action to detect potential market opportunities. The Trailing Stop is adjustable, allowing traders to customize the distance at which the stop will trail the price.
Key Features:
Engulfing Liquidity Signal: The strategy enters a trade when the market shows signs of strong liquidity and price action, typically when there is a strong reversal signal (bullish engulfing) accompanied by higher volume.
Trailing Stop: A dynamic exit strategy that locks in profits by trailing the stop level behind the highest price achieved since the trade entry. This prevents the position from being closed prematurely while still protecting profits if the market reverses.
Customizable Trailing Stop: Users can adjust the trailing stop percentage via the settings. This allows for greater flexibility in how closely the stop will trail the price.
No Fixed Take Profit: The strategy uses only the trailing stop, ensuring that profits are maximized based on price action without a fixed profit target.
How the Strategy Works:
Buy Signal (LongC):
The strategy triggers a buy signal when a bullish engulfing pattern occurs, and the liquidity conditions align (i.e., the volume is increasing and price action shows signs of a potential reversal).
The strategy enters a long position when the signal conditions are met.
Trailing Stop Logic:
Once the trade is initiated, a trailing stop is applied. The stop level follows the highest price achieved since entry, trailing the price based on a user-defined percentage.
The stop level adjusts upward as the price increases, locking in profits. If the price reverses and hits the trailing stop, the trade is closed.
The trailing stop is dynamic, meaning it moves only in the direction of profit, but it will not move lower once it has been set.
Sell Signal (ShortC):
The position will also be closed if a sell signal (ShortC) is generated. This ensures that the strategy exits the trade when a potential reversal is detected in the market.
No Fixed Take Profit:
The strategy does not use a fixed take profit level. Instead, the profit is managed entirely by the trailing stop, which ensures that positions remain open as long as the market is moving in favor of the trade, allowing the position to capture the maximum possible profit.
Settings:
Trailing Stop Percentage: The user can adjust the trailing stop distance by setting a percentage value between 10% and 100%. This controls how tightly or loosely the trailing stop will follow the price.
Benefits:
Maximized Profits: By using a trailing stop, the strategy aims to capture as much profit as possible without prematurely exiting trades.
Customizable: The adjustable trailing stop allows traders to tailor the strategy to their risk tolerance and market conditions.
Simple & Effective: The strategy is straightforward, relying on price action and volume signals, making it easy to understand and implement.
Ideal Use Case:
This strategy is suitable for traders who prefer to let their profits run and manage risk with a trailing stop. It is particularly useful in trending markets where the price continues to move in one direction for an extended period. By using a trailing stop, the strategy allows you to stay in the market and capture large moves while protecting profits.
This strategy provides an excellent combination of automated trade management with a Trailing Stop and Engulfing Liquidity Signal, making it a solid choice for traders seeking to automate their trades with customizable risk management.

ICT ORB Killzones by MaxN (15 / 30m)Trading session open/close with first 15/30 min orbs
will just have to adjust time zones to your current time line
GMT +0
I use
Asia 23.00 - 06.00
London 07.00 - 16.00
New York 12.00 - 22.00

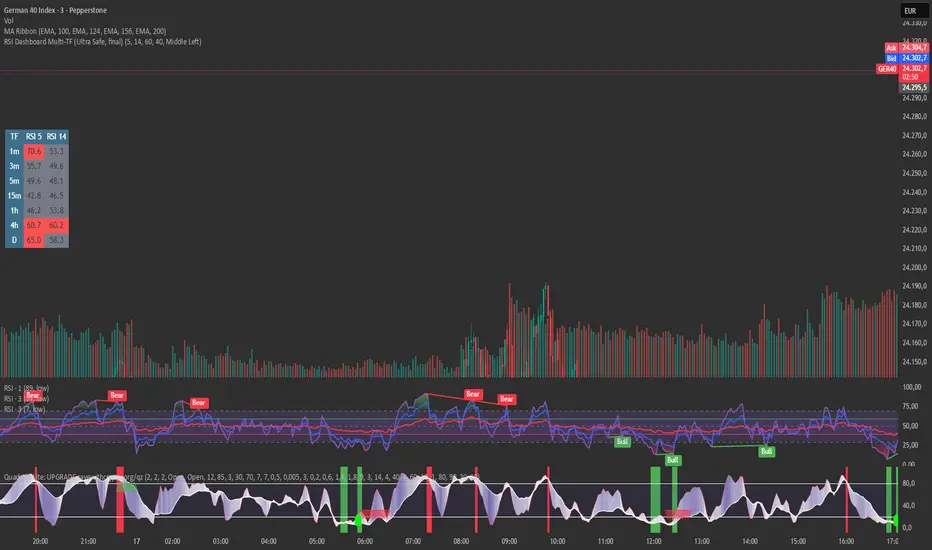
RSI Dashboard Multi-TF This script displays RSI values from multiple timeframes in a compact dashboard directly on the chart.
It is designed for traders who want to quickly identify whether the market is overbought, oversold, or neutral across different timeframes, without constantly switching chart intervals.
The dashboard shows the RSI simultaneously for the following timeframes:
- 1 minute
- 3 minutes
- 5 minutes
- 15 minutes
- 1 hour
- 4 hours
- Daily
Typical use cases:
- Scalping & intraday trading
- Multi-timeframe analysis at a glance
- Entry confirmation (e.g. pullbacks, breakouts)
- Avoiding trades against overbought or oversold market conditions
- Complementing EMA, VWAP, or price action strategies
⚙️ Notes
This dashboard is an analysis tool, not an automated trading system.
No repainting (uses request.security).
Suitable for indices, forex, crypto, and commodities.
This RSI dashboard provides a fast, clear, and visually clean market overview across multiple timeframes, making it an ideal tool for active traders who want to make efficient and well-structured trading decisions.
Malama's Pre-Market BoxThis script is a comprehensive Pre-Market range visualizer designed to replace older, single-candle analysis tools. It automatically highlights the full pre-market session (04:00–09:30 EST) and extends key support/resistance levels into the regular trading day.
Why this script was created (Evolution from previous versions): This is a complete architectural rewrite of the older "Malama's KAYCAP Pre-Market Box."
Old Logic: The previous version focused on isolating a single, specific 1-minute candle (e.g., exactly 4:00 AM) to determine levels.
New Logic: This version tracks the entire pre-market session range. It dynamically updates the True High and True Low as the pre-market develops, providing a much more accurate support/resistance zone for the open.
Visual Overhaul: Instead of static plots, this version uses Pine Script v6 box and line objects to draw a clean, shading-customizable range that automatically extends rightward until the trading session ends.
How it works:
Session Tracking: The script monitors the user-defined session (default 04:00-09:30).
Dynamic Box: As price moves during pre-market, a box is drawn covering the highest high and lowest low of that period.
Level Extension: At 09:30 (Market Open), the script locks the High and Low values. It then projects two horizontal lines (Resistance and Support) across the chart for the rest of the day.
Breakout Detection: If the price closes outside these levels during regular hours, the script can optionally trigger Alerts and plot "BREAK" labels on the chart.
Settings:
Time Settings: Customizable session string (default captures standard US Pre-Market).
Visuals: Fully adjustable box colors, border transparency, and line width.
Signals: Toggle breakout labels on/off.
Alerts Included:
Bullish Breakout: Triggers when price crosses and closes above the Pre-Market High.
Bearish Breakdown: Triggers when price crosses and closes below the Pre-Market Low.

Trend Dip-BuyerThis strategy is a simplified, high-probability Dip Buying System designed for active growth stocks. Instead of chasing breakouts at the top, it waits for the stock to take a "breather" (pullback) within an uptrend and buys the discount.
It combines a classic Trend Filter (50 EMA) with a sensitive Momentum Oscillator (RSI 2) to pinpoint the exact moment a pullback is likely to reverse back up.
How It Works:
1. The Trend Filter (50 EMA)
The strategy ONLY trades Long.
It requires the price to be above the 50-period Exponential Moving Average (EMA) (Blue Line). This ensures you are trading with the momentum of the market, not against it.
2. The Dip Signal (RSI 2)
It uses a fast 2-period RSI.
When RSI(2) drops below 50, it signals that the stock is temporarily "oversold" or resting. This is your cue that a discount entry is available.
3. Dynamic Exits
Profit Taking: The primary target is dynamic. The strategy looks to exit when RSI(2) spikes above 70, allowing you to capture the bulk of the momentum swing. (A fixed ATR target option is also included).
Safety: A 3x ATR Stop Loss protects the trade from sudden reversals.
✅ Simple Entry Checklist
Before taking a trade, ensure all 3 boxes are checked:
Trend Check: Is the current price ABOVE the Blue Line (50 EMA)?
Dip Check: Is the RSI (2) value BELOW 50?
Time Check: Is it past 12:00 PM? (Recommended for cleaner trends, but optional).
👉 If YES to all: Enter Long on the next candle open.
Best Settings (Customizable):
RSI Threshold: Default is 50 (Balanced). Lower to 30 for fewer, higher-quality trades.
Exit Method: "RSI > 70" is recommended for maximizing wins in strong trends.
Time Filter: "Trade > 12pm" is enabled by default to avoid morning volatility.

Clock&Flow: Elements of Cycle Analysis 1st partClock&Flow – Elements of Cycle Analysis (ECA) | Complete Suite
Elements of Cycle Analysis (ECA) is an advanced cyclic analysis suite designed to interpret the market through time, structure, strength, and energy, combining cycles, volatility, and participation into a single operational framework.
The suite consists of two complementary modules:
🔹 ECA 1 – Cycles, Structure, and Volatility (Overlay: True)
ECA 1 is dedicated to the structural and temporal analysis of the market.
Cyclic SMAs (Cyclic Ratio) Moving averages are calibrated according to nominal cycles and timeframes to monitor multiple cycles simultaneously (from the lower cycle to the upper cycles). Crossovers between fast and slow SMAs certify the closing or transition of the cycle related to the faster SMA. The specific cycle is identified in the Info Table at the bottom right (for 15m - 1h - 2h - 1D timeframes). You can select the number of cycles to observe and the asset type to apply them to:
Index: Standard quotes (e.g., Cash sessions).
Future: Extended quotes (24h).
50-200: Classic institutional references for the medium-long term.
ATR-based Dynamic Cyclic Channels The channels represent a lower cycle and its upper counterpart; their width is determined by the observed timeframe and calculated based on average volatility (ATR). Volatility is not treated as noise but as a structural component of the cycle, essential for contextualizing excesses, compressions, and expansions.
Info Table and Quick Guide Dynamic tables automatically link SMAs, timeframes, and time cycles, providing an immediate reading of the current cyclic context.
Time Bands (Weekly / Daily) Temporal visualization helps identify cyclic pivots and rhythm transitions.
🔹 ECA 2 – Market Excesses, Strength, and Energy
ECA 2 analyzes how the market moves within the cyclic structure.
Excesses and Divergences (Cyclic Stochastic) An oscillator calibrated on the same cyclic ratio as the suite. Crossovers between the lower cycle (blue) and upper cycle (red) signal potential phase changes. In areas of excess, divergences often confirm the closing and restart of a cycle.
Directional Movement System (DMS) The ADX measures the strength of the movement, while +DI and -DI indicate direction. A simultaneous crossover of ADX, +DI, and -DI signals imminent acceleration, even before the strength is fully expressed.
Market Pulse – Real Market Energy The Market Pulse measures the amount of real energy moving through the market by relating three factors:
Price Velocity
Normalized Volume
Volatility (ATR relative to price)
These three factors are combined multiplicatively: if one is missing, the impulse weakens. The zero line represents a state of energy equilibrium; values above or below indicate a real imbalance (bullish or bearish). Note: Market Pulse is not a classic oscillator and should not be interpreted as overbought or oversold; it is used to evaluate the energetic quality of a movement.
Operational Convergence
The maximum operational effectiveness of the ECA suite is achieved when all modules converge on the same market phase.
When cyclic timing, volatility, price structure, trend strength, and movement energy align, the context signals a high-probability operational phase. The system is applicable to any timeframe or asset because it is not bound by dogmatic or subjective interpretations of technical or fundamental analysis; instead, it leverages what is actually happening in the market. Major chart patterns and Volume Profile (technically not includable in this specific suite) provide further confirmation.
Under these conditions, the signal does not originate from a single indicator but from the consistency of the entire system: time, volatility, and energy moving in the same direction.
Entries should always be accompanied by proper risk management.
––––––––––––––––––––––––––––––––––––––––––––––––––––––––––––––––––––––––
Clock&Flow – Elements of Cycle Analysis (ECA) | Suite Completa
Elements of Cycle Analysis (ECA) è una suite avanzata di analisi ciclica progettata per leggere il mercato attraverso tempo, struttura, forza ed energia, combinando cicli, volatilità e partecipazione in un unico framework operativo.
La suite è composta da due moduli complementari:
🔹 ECA 1 – Cicli, Struttura e Volatilità (overlay true)
ECA 1 è dedicato all’analisi strutturale e temporale del mercato.
SMA cicliche (ratio ciclica)
Le medie mobili sono calibrate in funzione dei cicli nominali e del timeframe per monitorare più cicli simultaneamente (dal ciclo inferiore fino ai cicli superiori).
Gli incroci tra SMA veloci e lente certificano la chiusura o transizione del ciclo correlato alla SMA più veloce. Il ciclo in questione è segnalato nella info table in basso a destra (per i time frame 15’ - 1h - 2h - 1D) Puoi selezionare il numero dei cicli da osservare e su quali asset applicarle (Index = quotazioni standard / Future = quotazioni estese / 50-200 i classici riferimenti istituzionali per il medio-lungo periodo
Canali ciclici dinamici basati su ATR
I canali rappresentano un ciclo inferiore e il suo superiore, l’ampiezza è data dal time frame osservato e calcolata sulla volatilità media (ATR).
La volatilità non è trattata come rumore, ma come componente strutturale del ciclo, utile per contestualizzare eccessi, compressioni ed espansioni.
Info Table e Quick Guide
Tabelle dinamiche collegano automaticamente SMA, timeframe e cicli temporali, fornendo una lettura immediata del contesto ciclico in corso.
Time Bands (Weekly / Daily)
La visualizzazione temporale aiuta a individuare pivot ciclici e transizioni di ritmo.
––––––––––––––––––––––––––––––––––––––––––––––––––––––––––––––––––––––
🔹 ECA 2 – Eccessi, Forza ed Energia del Mercato
ECA 2 analizza come il mercato si muove all’interno della struttura ciclica.
Eccessi e divergenze (Stochastic ciclico)
Oscillatore calibrato sulla stessa ratio ciclica della suite.
Gli incroci tra ciclo inferiore (blu) e superiore (rosso) segnalano potenziali cambi di fase; in area di eccesso, le divergenze certificano spesso la chiusura e ripartenza del ciclo.
Directional Movement System (DMS)
L’ADX misura la forza del movimento, mentre +DI e –DI ne indicano la direzione.
L’incrocio simultaneo di ADX, +DI e –DI segnala un’accelerazione imminente, anche in assenza di forza già espressa.
Market Pulse – Energia reale del mercato
Il Market Pulse misura quanta energia reale sta attraversando il mercato mettendo in relazione:
velocità del prezzo
volume normalizzato
volatilità (ATR rapportato al prezzo)
I tre fattori sono combinati in modo moltiplicativo: se uno manca, l’impulso si indebolisce.
La linea dello zero rappresenta una condizione di equilibrio energetico; valori sopra o sotto indicano uno sbilanciamento reale, rialzista o ribassista.
Il Market Pulse non è un oscillatore classico e non va interpretato in termini di ipercomprato o ipervenduto: serve a valutare la qualità energetica del movimento.
La massima efficacia operativa della suite ECA si ottiene quando tutti i moduli convergono sulla stessa fase di mercato.
Quando tempi ciclici, volatilità, struttura del prezzo, forza del trend ed energia del movimento risultano allineati, il contesto segnala una fase ad alta probabilità operativa.
È applicabile su qualunque time frame o asset perché non è vincolato a dogmatiche e soggettive interpretazioni di analisi tecnica - fondamentale ma sfrutta ciò che realmente sta accadendo sul mercato.
I principali pattern grafici e il Volume Profile (in questa suite tecnicamente non inseribili) forniscono ulteriori conferme e/o indicazioni.
In queste condizioni il segnale non nasce da un singolo indicatore, ma dalla coerenza dell’intero sistema: tempo, volatilità ed energia si muovono nella stessa direzione.
Gli ingressi vanno sempre accompagnati da una corretta gestione del rischio.

ICT ORB Killzones by MaxN (15 / 30m)Trading session London, Asia, New York
orb 15/30 min selectable breakout zones with buy/sell signals

LJ Parsons Adjustable expanding MRT Fib Version 2Based on premium/discount/fair-value levels the indicator will expand with the market by settable dates.
The levels are not fib based as such but are resonant levels within an multiplicative /12 log scale using the LJ Parsons Market resonance hypothesis.

Range EncapsulatorWhen a user selects a start date and the desired duration, the specified date range will be highlighted. High and low data lines corresponding to this range will be drawn. Additionally, quarter-point interval lines from the previous data range will be displayed between the high and low lines of the current range, provided they fall within those boundaries.

Global Sessions Pro NY/London/Tokyo - O/C/H/LGLOBAL SESSIONS PRO — NY / LONDON / TOKYO
Session Opens, Highs, Lows, Midpoints, Closes, Ranges & Killzones
OVERVIEW
Global Sessions Pro is a comprehensive session-mapping indicator designed for traders who rely on market structure, session context, and time-based behavior.
The indicator automatically plots New York, London, and Tokyo sessions, including:
• Session Open, High, Low, Midpoint, and Close
• Prior session levels projected forward
• Session range boxes
• Right-side labeled price levels (clearly identified)
• Stacked session summary labels (no overlap)
• Optional killzones and overlap windows
• Breakout alerts (prior or current session levels)
The script is fully timezone-aware, DST-safe, and works on any chart timeframe.
KEY FEATURES
SESSION MAPPING
For each session (NY / London / Tokyo), the indicator can display:
• Open
• High
• Low
• Midpoint (High + Low) / 2
• Close
Each level is drawn with its own horizontal line and optional right-side label, so there is never confusion about which line represents which level.
SESSION RANGE BOXES
Optional shaded boxes highlight the true session range as it develops in real time.
These are useful for visualizing:
• Compression vs expansion
• Relative session volatility
• Strength or weakness between sessions
Opacity and visibility are fully configurable.
RIGHT-SIDE LEVEL LABELS
Each session level can be labeled on the right edge of the chart, showing:
• Session name (NY / Lon / Tok)
• Level type (O / H / L / M / C)
• Optional price value
Examples:
NY H: 18234.25
Lon L: 18098.50
Tok M: 18142.75
This eliminates ambiguity when multiple session levels overlap or share similar colors.
SESSION SUMMARY LABELS (AUTO-STACKED)
At the top of each session range, an optional summary label displays:
• Session name
• Open / High / Low / Close
• Total range (points)
• Range in ticks
• ATR multiple
Summary labels are automatically stacked vertically using ATR-based or tick-based spacing, preventing overlap even when multiple sessions occur close together.
PRIOR SESSION LEVELS
The indicator can project prior session levels into the next session, including:
• Prior High and Low
• Optional prior Open, Close, and Midpoint
These levels are commonly used for:
• Support and resistance
• Liquidity sweeps
• Mean reversion
• Failed breakouts
Projection length is configurable and safely capped to comply with TradingView drawing limits.
KILLZONES AND SESSION OVERLAPS
Optional background shading highlights key institutional windows:
• London Open
• New York Open
• London / New York overlap
These zones help identify high-probability volatility windows and time-based trade filters.
All killzones respect the selected session timezone basis.
ALERTS
Built-in alerts are available for:
• Break of prior session high
• Break of prior session low
• Break of current session high
• Break of current session low
Alerts can be configured to trigger on wick or close.
Alert logic is written using precomputed crossover detection to ensure historical consistency and avoid missed or false alerts.
TIMEZONE AND SESSION HANDLING (IMPORTANT)
SESSION TIME BASIS OPTIONS
The indicator supports three session-time modes:
Market Local (DST-aware) – Recommended
• New York uses America/New_York
• London uses Europe/London
• Tokyo uses Asia/Tokyo
• Automatically adjusts for daylight saving time
UTC (Fixed)
• Sessions are interpreted strictly in UTC
• Best for crypto or non-DST workflows
• Requires manual adjustment during DST changes
Custom Timezone
• Define a single custom timezone for all sessions
This ensures sessions display correctly regardless of the chart’s timezone.
DEFAULT SESSION TIMES
(Default values assume Market Local (DST-aware) mode)
Tokyo: 09:00 – 15:00
London: 08:00 – 16:30
New York: 09:30 – 16:00
These defaults are optimized for cash and index trading.
FX traders may adjust session windows as needed.
BEST USE CASES
This indicator is particularly effective for:
• Index futures (ES, NQ, RTY, DAX, FTSE)
• Forex session-based strategies
• Time-based breakout systems
• Liquidity sweep and mean-reversion models
• London Open and New York Open trading
• Multi-session market context analysis
PERFORMANCE AND SAFETY NOTES
• All future-drawn objects are capped to comply with TradingView limits
• Crossover logic is evaluated every bar to prevent calculation drift
• Old session drawings are automatically culled to reduce chart clutter
• Works on all intraday and higher timeframes
RECOMMENDED SETTINGS
For most traders:
• Session Time Basis: Market Local (DST-aware)
• Show Open / High / Low / Midpoint: ON
• Prior Session Levels: ON
• Summary Labels: ON
• Killzones: ON
• Alerts: ON (Close-based)
FINAL NOTES
This indicator is designed to provide objective session structure without opinionated trade signals. It works best as a context layer combined with your own execution rules, confirmations, and risk management.
If you trade time, structure, and liquidity, this script provides the framework.

Volume And ROC Surge DetectorSharing this indicator I made for myself.
Volume and ROC are early indicators of long moves. When ROC + Volume happens together, it's BOOM.
This indicator called, Volume + ROC Surge Detector is a real-time momentum alert indicator designed to spot early institutional activity and explosive price moves. It combines Volume Surge analysis with Price Rate of Change (ROC) to identify when price and participation align.
The script monitors abnormal volume relative to a moving average and confirms direction using ROC strength. When both volume expansion and directional momentum occur together, it triggers high-confidence “Boom” signals for bullish or bearish moves.
To avoid noise, the indicator includes state-based alert control, ensuring each signal fires only once per condition change and only in real-time, not on historical bars.
Key Features
1. Detects bullish and bearish ROC momentum shifts
2. Identifies positive and negative volume anomalies
3. Flags combined Volume + ROC “Boom” events
4. Real-time alerts only (no repaint, no bar-close spam)
5. Duplicate alert prevention using internal state tracking
6. Clean on-chart visual markers for instant recognition. Disable visuals for cleaner chart.
Best Use Cases:
1. Catching breakouts and breakdowns early
2. Spotting smart money participation
3. Momentum confirmation for trend, intraday, and swing trading
4. Works across stocks, crypto, and indices
Alerts:
1. ROC Bullish Alert
When it fires:
Price Rate of Change (ROC) crosses above the positive ROC threshold
Alert messages:
🟢 ROC Change Bullish → TICKER @ price
What it means: Price momentum has turned strongly bullish. Early sign of upside acceleration
2. ROC Bearish Alert
When it fires:
Price ROC crosses below the negative ROC threshold
Alert message:
🔴 ROC Change Bearish → TICKER @ price
What it means:
Price momentum has turned strongly bearish. Early sign of downside acceleration
3. Positive Volume Surge Alert
When it fires:
Current volume exceeds
Average Volume × Volume Surge Multiplier
Alert message:
📈 +Ve Vol Change → TICKER @ volume
What it means:
Unusual participation / smart money activity. Strength entering the move
4. Negative Volume Alert (Volume Dry-Up)
When it fires:
Current volume drops below
Average Volume ÷ Volume Surge Multiplier
Alert message:
📉 -Ve Vol Change → TICKER @ volume
What it means:
Participation is fading. Trend exhaustion or consolidation risk
5. Boom Bull Alert (High-Conviction Signal)
When it fires:
Both conditions occur together:
Bullish ROC AND Volume Surge (high participation)
Alert message:
💥 Boom Volume + ROC Bull → TICKER @ price
What it means: Momentum + volume alignment. Strong breakout / continuation probability
6. Boom Bear Alert (High-Conviction Signal)
When it fires:
Both conditions occur together: Bearish ROC AND Volume Surge (high participation)
Alert message:
💣 Boom Volume + ROC Bear → TICKER @ price
What it means: Momentum + volume alignment to the downside. Strong breakdown / continuation probability
This indicator is built for traders who want clarity, speed, and signal discipline—not lagging confirmations or noisy alerts.

NQ SNIPER ## 🎯 WHAT MAKES THIS CHALLENGE-SAFE:
### **1. CHALLENGE MODE (DEFAULT: ON)**
- **ONLY shows S-Tier GOD MODE signals** - the absolute best of the best
- Turns OFF all A-Tier, B-Tier, EXCELLENT, MEDIUM signals
- **Red indicator top-right** shows you're in ULTRA-SAFE mode
### **2. TIMEFRAME INTELLIGENCE**
- **1-minute charts**: STRICT thresholds (9.5 score, 75% fat body, 75% delta)
- **2-minute charts**: 5% easier (allows 9.0 score) - more reliable
- **3-minute charts**: 10% easier (allows 8.6 score) - even more filtered
- **5-minute charts**: 15% easier (allows 8.1 score) - **INSTITUTIONAL BEAST MOVES**
**WHY?** A 5-minute candle with 8.1 score is MORE powerful than a 1-minute candle with 9.5 score. It's 5 FULL MINUTES of institutional dominance.
### **3. VISUAL TIMEFRAME LABELS**
- Shows `1M`, `2M`, `3M`, `5M` below each signal
- You INSTANTLY know: "This is a 5-minute GOD MODE = BIG MOVE"
### **4. THE MATH TO $53K:**
**Current Position:** $48,800
**Target:** $53,000
**Needed:** $4,200
**IF trading 1 MNQ contract ($5/point):**
- Need: 840 points total
- **5-minute S-Tier GOD MODE** typically gives 20-30 points
- That's **28-42 trades** (too many for challenge safety)
**IF trading 2 MNQ contracts ($10/point):**
- Need: 420 points total
- **5-minute S-Tier GOD MODE** at 25 points avg
- That's **17 winning trades** ✅
**IF trading 1 NQ contract ($20/point):**
- Need: 210 points total
- **5-minute S-Tier GOD MODE** at 25 points avg
- That's **8-9 winning trades** ✅✅✅ **BEST OPTION**
---
## 💎 YOUR BATTLE PLAN (3-7 DAYS TO VICTORY):
### **STEP 1: Setup**
1. Load this on **2-minute, 3-minute, AND 5-minute NQ charts** (open 3 chart windows)
2. Turn **CHALLENGE MODE: ON** (default)
3. **Session filters**: London ON, NY Open ON
4. Set alerts for GOD MODE signals
### **STEP 2: Trading Rules (NO EXCEPTIONS)**
```
✅ ONLY trade signals marked "Gˢ" with "5M" timeframe
✅ Enter when 5-minute candle CLOSES (confirmed signal)
✅ Stop loss: 10 points below/above entry
✅ Target: 25 points (can trail after +15)
✅ Risk: 1 NQ contract = $200 risk per trade
