ABC Pro Ultimate S/RABC Pro Ultimate is a high-precision trading tool designed to identify harmonic ABC (Zigzag) patterns and combine them with institutional Support & Resistance levels. Unlike standard indicators that clutter your chart with noise, this script filters for high-relevance pivot points from the distant past to provide truly meaningful trade setups.
지표 및 전략

ATR Volatility FilterA Basic Volatility Filter
3 Modes
1- Absolute ATR filter
2- Filter Based on ATR threshold relative percentage of the price
3- ATR Threshold relative to its moving average

NeuroPolynomial ChannelNeuroPolynomial Channel is a structure-oriented price channel designed to model price curvature, balance, and realized deviation using recursive non-linear smoothing.
Rather than relying on standard moving averages or statistical volatility assumptions, the indicator separates structure estimation from deviation measurement, allowing each to adapt independently.
Structural Core (Recursive Curvature Line)
The centerline is generated using a recursive smoothing process with controlled curvature.
By blending current price with historical estimates and introducing a curvature term, the line forms a non-linear structural path that adapts gradually to changing market conditions.
This approach emphasizes:
Structural continuity over short-term noise
Gradual regime transitions instead of abrupt shifts
User-controlled responsiveness via curvature and blending parameters
The result is a centerline that reflects price structure, not just short-term averages.
Deviation Field (Adaptive Bands)
Channel width is derived from the observed absolute deviation between price and the structural core.
Instead of assuming a normal distribution, deviation is measured directly from realized price behavior and expressed through multiple band layers:
Inner structure boundary
Intermediate deviation zone (optional)
Outer deviation boundary (optional)
As price behavior changes, the deviation field expands or contracts organically, providing a contextual view of compression, balance, and expansion.
Interpretation Framework
Balance & Control
Persistent acceptance on one side of the structural core reflects directional control.
Compression
Narrow deviation bands signal reduced realized movement and potential energy buildup.
Expansion
Widening bands indicate increasing deviation and active range development.
..................................................................................................................
The indicator is intended for contextual interpretation, not mechanical signal generation.
Configuration
Length – Structural memory depth
Morph Factor – Degree of historical blending
Flatten Factor – Curvature sensitivity control
Deviation Multipliers – Band spacing
Visual Controls – Theme and candle tinting
Notes:
Deviation is derived from realized price movement and adapts gradually.
Recursive calculations initialize from available chart history.
This tool does not forecast future prices.
Disclaimer:
This indicator is provided for analytical and educational purposes only.
It does not constitute financial advice or a trading recommendation.

PDH PDL PWH PWL + IMB 15m / 1H / 4H + Weekly LogicPDH PDL PWH PWL indycators
weekly indycators automaticly generated.
for a every week

Witch-Fire ALMA signals: Dynamic Liquidity & Trend GlowThe Witch-Fire ALMA is a high-precision trend bias and liquidity mapping tool designed for price action traders and Smart Money practitioners. Unlike traditional indicators that clutter your chart with lagging signals, this script provides a "clean-yet-powerful" visual anchor to help you stay on the right side of the market while identifying key Points of Interest (POIs).
At its core, the script utilizes an optimized Arnaud Legoux Moving Average (ALMA). Known for its superior ability to balance smoothness and responsiveness, the ALMA effectively filters out market noise and "whipsaws" that often plague standard EMAs.
Key Features:
The Witch-Fire Glow: A neon-styled ALMA line that shifts between Bullish Green and Bearish Red. The white core provides surgical precision for price intersection, while the outer glow visualizes the strength and dominance of the current trend.
Scaled Liquidity Levels: Automatically maps Buy Side Liquidity (BSL) and Sell Side Liquidity (SSL). These levels are dynamic—they scale proportionally with your ALMA settings. This ensures that the liquidity zones you see are always relevant to the trend cycle you are analyzing.
Strategic Bias Background: A subtle background tint provides an instant psychological filter. Only look for Longs in the green zone and Shorts in the red zone to maintain a high-probability strike rate.
How to Trade with Witch-Fire:
Identify the Bias: Look at the Fire ALMA. If the "fire" is red and the price is below the line, your bias is strictly bearish.
Watch the Sweeps: Wait for the price to "sweep" (pierce with a wick) the horizontal SSL (Green) or BSL (Red) lines.
Execution: Look for a strong rejection candle (long wick, small body) at these levels that closes back towards the ALMA line.
Best Used On: 15m, 1H, and 4H timeframes. Works exceptionally well for Crypto, Forex, and Indices.

Smart Money Concept Change of Character Break of StructureSMC Structure
Visualizes Change of Character (CHoCH) and Break of Structure (BoS) - two fundamental Smart Money Concepts for identifying trend reversals and continuations.
This is the 1st version of an implementation of this concept.
It is NOT supposed to be used as a signal but a confirmation. Best use during NYSE hours.
Full Description
Overview
This indicator automatically detects and displays two core Smart Money Concepts (SMC) directly on your chart:
CHoCH (Change of Character) – The first structural break against the prevailing trend, signaling a potential reversal
BoS (Break of Structure) – A structural break in the direction of the current trend, confirming continuation
These concepts are essential building blocks of SMC trading methodology, helping traders identify where institutional players may be entering or exiting positions.
How It Works
The indicator uses pivot-based swing detection to identify significant highs and lows. When price breaks through these levels, it classifies the move as either a CHoCH or BoS based on the current trend context.
CHoCH (Change of Character)
Occurs when price breaks structure AGAINST the current trend
First warning sign that the trend may be reversing
Displayed as a solid horizontal line with "CHoCH" label
Green = Bullish reversal | Red = Bearish reversal
BoS (Break of Structure)
Occurs when price breaks structure IN THE DIRECTION of the current trend
Confirms that the existing trend remains intact
Displayed as a dashed horizontal line with "BoS" label
Teal = Bullish continuation | Maroon = Bearish continuation
Visual Example
Uptrend with BoS (continuation):
HH ◄── BoS (trend continues)
/
HL
/
HH
/
HL
Uptrend → CHoCH → Downtrend (reversal):
HH
/ \
HL \
LL ◄── CHoCH (trend reversal!)
Settings
Pivot Settings
Pivot Lookback: Number of bars used to identify swing highs/lows (default: 5). Higher values = fewer but more significant structure points.
Display Options
Show CHoCH: Toggle CHoCH visualization
Show BoS: Toggle BoS visualization
Show Swing Points: Display SH/SL labels at detected pivots
Extend Lines to Right: Extend structure lines into future bars
Show Info Table: Display current trend and last swing levels
Show Trend Background: Color the chart background based on trend direction
Colors
Fully customizable colors for all elements
How to Use
Identify the trend: Look at the sequence of CHoCH and BoS signals to understand market structure
Watch for CHoCH: A CHoCH signals potential reversal – wait for confirmation before trading against the previous trend
Trade with BoS: BoS confirms trend continuation – look for entries on pullbacks in the direction of the trend
Combine with other SMC concepts: Works great alongside Order Blocks, Fair Value Gaps, and liquidity concepts
Tips
Use higher pivot lookback values on higher timeframes for cleaner signals
A CHoCH doesn't guarantee reversal – it's the first warning sign, not confirmation
Multiple BoS signals in a row indicate a strong, healthy trend
Look for CHoCH occurring at key levels (support/resistance, order blocks) for higher probability setups
Feedback Welcome!
This is an open-source indicator and I'd love to hear your thoughts!
Please comment below if you have:
Feature requests or ideas for improvements
Bug reports or issues
Suggestions for additional SMC concepts to add
Your feedback helps make this indicator better for everyone. Happy trading! 🚀

Supply-Demand Dominance & Energy RibbonOverview:
This indicator is specifically fine-tuned for the Nasdaq (NAS100) market. It combines volume-based Delta analysis (Supply-Demand) with price kinetic energy (Slope) to identify high-probability reversal points and trend strength.
Key Features & Usage:
Supply-Demand Dominance (Top-Right Label):
Analyzes volume spikes over a 50-period lookback to determine market control.
Displays "매수 우위" (Bullish Dominance) or "매도 우위" (Bearish Dominance) in real-time.
Energy Ribbon (Bottom Visualization):
Calculates the slope of the TCI oscillator to visualize momentum intensity.
Solid Green/Red: Strong momentum.
Faded Green/Red: Weakening momentum or minor trend.
Momentum Combo Signals (Circle Shapes):
Triggered when WaveTrend and TCI oscillators cross in extreme zones (Overbought 70 / Oversold 30).
Smart Filter: Signals are only shown when they align with the current Supply-Demand dominance, reducing "market noise."
Volume Spikes (Arrow Symbols):
Indicates abnormal volume activity (1.5x average delta). These arrows (↑/↓) help identify potential breakout points or the climax of a move even when a full combo signal isn't present.

Least Squares Moving Average Zero Lag LeadLSMA Zero‑Lag + Lead Indicator
This indicator is a modified Least Squares Moving Average (LSMA) designed to reduce lag and optionally introduce a controlled forward‑leaning (lead) component. It is intended to be used either directly on price or as a smoother, more responsive input source for other indicators such as RSI, MACD, or regime filters.
1. What LSMA Is Doing
LSMA (Least Squares Moving Average) fits a straight‑line regression to the last N bars and evaluates that line at the current bar. Unlike simple or exponential averages, LSMA implicitly models trend direction and slope, which makes it more responsive during directional moves.
2. Zero‑Lag Adjustment
The zero‑lag version applies a simple error‑correction technique:
ZL = 2 × LSMA − LSMA(previous)
This cancels part of the inherent regression delay, producing a smoother line that reacts faster to turns while remaining stable in trends.
3. Lead Component (Optional)
On top of the zero‑lag LSMA, a slope‑based lead is added:
Lead = ZL + k × (ZL − ZL(previous))
Here, the recent slope is projected forward by a user‑controlled factor (k). This does not predict price, but it shifts the average slightly in the direction of current momentum, improving responsiveness for signal generation.
4. Why This Helps RSI and Similar Indicators
RSI and many oscillators operate on raw price changes, which can be noisy and lag‑prone. Feeding RSI with LSMA ZL or LSMA ZL + Lead instead of raw close price:
• Reduces noise without excessive smoothing
• Aligns RSI swings with underlying trend direction
• Improves timing of overbought/oversold transitions
• Reduces late signals after sharp reversals
In practice, this produces an RSI that reacts faster in trends but stays calmer in chop.
5. Practical Usage Tips
• Use LSMA ZL as a clean, low‑lag replacement for price in oscillators
• Add small lead values (0.5–1.0) only if earlier signals are needed
• Avoid high lead values in choppy markets
• Combine with regime or volatility filters for best results
This indicator is best thought of as a signal‑conditioning layer rather than a standalone trading system.

VWAP Extreme Zones (Elite Style)Short Description
VWAP Extreme Zones (Elite Style) highlights statistically stretched price areas above and below VWAP, helping traders identify potential overextension, mean-reversion zones, and high-risk breakout areas during intraday sessions.
Disclaimer
This indicator is provided for educational and analytical purposes only.
It does not constitute financial advice or trade signals.
All trading involves risk. Always confirm with price action, market context, and proper risk management before taking any trade.

Aroon (Any Source)Aroon (Any Source)
Overview
This indicator is an enhanced version of the classic Aroon Oscillator. It measures trend dominance based on the recency of highs and lows, with added flexibility to operate on any chosen source series and an optional price-scaling mechanism based on VWAP distance.
What the Indicator Does
The Aroon Oscillator compares how recently the most recent high and low occurred within a lookback window. The result is a bounded oscillator that indicates whether buyers or sellers are currently dominant.
This version adds: - Ability to run Aroon on any source - Optional smoothing to reduce noise - Optional VWAP-based price scaling
Core Outputs
• Aroon Up (0–100): Strength of recent highs
• Aroon Down (0–100): Strength of recent lows
• Aroon Oscillator (−100 to +100): Net dominance (Up − Down)
Inputs and Options
• Source: Input series used for calculations
• Aroon Length: Lookback window
• Use Source for High/Low: Enables Aroon-like mode on any series
• Show Oscillator: Toggles oscillator plot
• Show Aroon Up/Down: Toggles component lines
• Smooth Oscillator: Light smoothing (EMA/RMA/SMA)
• VWAP Price Scaling: Scales signal by VWAP distance normalized by ATR
How to Use It
Use the oscillator as a trend regime filter. Positive values indicate bullish dominance; negative values indicate bearish dominance. VWAP scaling helps suppress signals near equilibrium and emphasize extended moves.
Practical Notes
• Measures recency, not magnitude
• Best used as a regime or bias input
• Especially effective intraday with VWAP scaling

Muros Multi-TF Pro Dashboard v2fwrvw w fw wf fs rf wf wf jni hb hu huhb yhi ib i ibb uoobu ic biicb ibc bic k

Cantillon Risk Calculator [Free]Overview Stop guessing your position size. The Cantillon Risk Calculator is a lightweight utility that instantly tells you exactly how many units (Contracts/Coins) to buy based on your account size and risk percentage.
How to Use
Open Settings.
Enter your Account Size (e.g., $10,000) and Risk % (e.g., 1%).
Type in your Stop Loss price.
The table instantly shows your Position Size.
Looking for High Probability Setups? Risk management is only half the battle. To find where to enter using Institutional Order Blocks and Sigma Bands, you need the Cantillon Terminal .

ORB FX REPLAY - FINAL SAFEHere is the description in English, written to sound professional and meet all the requirements for publishing on TradingView:
Script Description:
Title: ORB Strategy Backtest Pro - Ultra Compatibility
Description: This is an Opening Range Breakout (ORB) strategy specifically designed for professional backtesting. It is optimized to run smoothly on external platforms like FX Replay and TradingView's replay mode.
Key Features:
Custom Session: Automatically calculates the High and Low of a specific time window (default: 10:00 - 10:15 Bucharest/GMT+2).
Impulse Confirmation: Features a "Min Impulse" filter to ensure entries happen on strong momentum, avoiding "fake-outs" near the range boundaries.
Hard Target Management: Designed for "Set & Forget" backtesting. Once a trade is triggered, the script tracks it until it hits either the Stop Loss (SL) or the final Take Profit 3 (TP3).
Visual Projections: Draws clear, real-time lines for Entry, SL, and TP3 on the chart for easy visual tracking.
Automated Statistics: Includes a dynamic label system that tracks Total Trades, Win Count, and Loss Count based on the TP3/SL logic.
Optimized Code: Built using Pine Script v5 with a focus on stability and compatibility, avoiding complex tables that often cause errors on external engines.

SR Channel + EMA + RSI MTF + VolHighlight - Edited by MochiSR + Volume + RSI MTF – edited by Mochi
This indicator combines three tools into a single script:
SR Zones from Pivots
Automatically detects clusters of pivot highs/lows and groups them into support and resistance zones.
Zone width is tightened using a percentage of the pivot cluster range so levels are more precise and cleaner.
Each zone includes:
A colored box (SR area),
A dashed midline,
A POC line (price level with the highest traded volume inside the zone),
A label showing the zone price and distance (%) from current price.
Zone color is dynamic but simple and stable:
If price closes below the mid of the zone → it is treated as resistance (red).
If price closes above the mid of the zone → it is treated as support (green).
Box, lines, and label always share the same color.
Volume Inside the Zone + POC
Calculates buy/sell volume for candles whose close lies inside each zone.
Uses abs(buyVol − sellVol) / (buyVol + sellVol) to measure volume imbalance and control box opacity:
Stronger, more one‑sided volume → darker box (stronger zone).
POC is drawn as a thin line with the same color as the zone to highlight the best liquidity level for entries/TP.
Multi‑Timeframe RSI Dashboard
Shows RSI(14) values for multiple timeframes (1m, 5m, 15m, 30m, 1h, 4h, 8h, 1d), each can be toggled on/off.
Background color of each RSI cell:
RSI > 89 → red (strong overbought),
80–89 → orange (warning area),
RSI < 28 → lime (strong oversold),
Otherwise → white (neutral).
The goal of this script is to give traders a clear view of:
Key support/resistance zones,
Their volume quality and POC,
And multi‑TF overbought/oversold conditions via the RSI dashboard – all in one indicator to support retest/flip‑zone trading.

XAUUSD M15 momentum realDetects when xausd enters a healthy directional phase during the NY session, and only flags entries with real momentum and controlled volatility.

Anurag -Precision Options Scalper [Multi-TF] -A professional-grade options day trading system built for SPY, QQQ, and SPX.
CORE FEATURES:
- Multi-timeframe analysis (15m regime → 5m setup → 1m execution)
- Market regime detection using ADX + ATR Z-Score (filters out chop)
- Confidence scoring system (0-100) — only takes high-probability setups
- Auto DTE engine recommends 0DTE vs 1DTE based on conditions
- Suggested strike prices (slightly OTM)
- Built-in position tracking with stop/target levels
- Session filtering (9:30 AM - 4:00 PM ET only)
- End-of-day forced exit warning
SIGNAL LOGIC:
CALL: 15m bullish bias + trending regime + price above VWAP/EMAs + pullback to support + bullish candle + 1m momentum confirmation
PUT: 15m bearish bias + trending regime + price below VWAP/EMAs + rejection from resistance + bearish candle + 1m momentum confirmation
RISK MANAGEMENT:
- ATR-based stops and targets
- Break-even stop movement after partial profit
- Time-based exit if momentum dies
- Max 4 trades per day (configurable)
- Gamma scalp mode for 0DTE (tighter stops/targets)
BEST ON: 5-minute chart | SPY, QQQ, SPX
STYLE: Pullback entries in trending markets
⚠️ For educational purposes. Not financial advice. Manage your own risk.

Price Action High 2 + Risk/Reward VisualizerIntroduction: Price Action High 2 (Bull Flag) Setup
This script identifies the High 2 (H2) setup, a staple price action pattern popularized by Al Brooks. The High 2 is a high-probability continuation pattern designed to catch the resumption of a bull trend after a two-legged pullback (a "complex" bull flag).
In a strong uptrend, the first attempt to end a pullback often fails (High 1). The High 2 represents the second, and usually more reliable, attempt by bulls to take control, often forming a "double bottom" structure within the flag.
How the Logic Works
The indicator follows a strict state-machine logic to ensure the pattern is valid:
Trend Confirmation: The script filters for an established uptrend where price is above a rising EMA (adjustable in settings).
Pullback Identification: It looks for a sequence of bars making lower highs.
High 1 (H1): The first bar in the correction that breaks above the high of the prior bar.
The Second Leg: The script then waits for the price to again fail to break a high, confirming a second leg of the pullback.
High 2 (H2): The signal is triggered when a bar breaks the high of the previous bar for the second time.
Key Features
Signal Bar Quality Filter: Not all High 2s are equal. This script includes a filter ensuring the signal bar closes in the upper portion of its range (bullish conviction) to avoid "weak" breakouts.
Automated Risk/Reward Visualizer: Upon a signal, the script automatically projects a Stop Loss (at the signal bar low) and a Take Profit level based on a customizable R:R ratio.
Clean Visuals: Labeled "H2" markers and dashed trend lines keep the chart uncluttered.
How to Trade It
Entry: Place a buy-stop order 1 tick above the High 2 signal bar.
Stop Loss: Traditionally placed below the low of the signal bar or the most recent swing low.
Target: Common targets include a 1:2 Risk/Reward ratio or the previous major swing high.
Settings Guide
EMA Length: Adjust this to match your timeframe (e.g., 20 for intraday, 50 for daily).
Min Close %: Set this to 50% or higher to ensure you only take trades where the bulls finished the bar strong.
Risk:Reward Ratio: Customize your profit targets to align with your personal trading plan.

Liquidity Void and Repair EngineLiquidity Void & Repair Engine
OVERVIEW
The Liquidity Void & Repair Engine is a high-fidelity institutional order flow tool designed to identify and track "Market Imbalances" or "Fair Value Gaps" (FVG). Unlike standard gap indicators that clutter the chart with every minor price jump, this engine uses Volatility-Adjusted Range Mapping to isolate high-conviction voids where price moved so rapidly that liquidity was left "unfilled."
The standout feature of this tool is its Active Repair Logic. The engine doesn't just draw static boxes; it monitors price action in real-time to determine when an imbalance has been "healed" by subsequent trading volume, providing a dynamic look at where the market has "unfinished business."
TECHNICAL LOGIC & ORIGINALITY
This script is published Open Source to contribute to the Pine Script community’s understanding of dynamic object management and order flow visualization.
ATR-Relative Filtering: To ensure only significant voids are plotted, the script uses a user-defined ATR (Average True Range) multiplier. This filters out market noise and focuses on institutional "impulse" moves.
Dynamic Box Management: Utilizing the Pine Script box array system, the script manages memory efficiently by updating existing objects rather than creating redundant ones.
The "Repair" Algorithm: The script tracks the high and low of every active void. When price action fully traverses the coordinates of a void, the script "seals" the box, visually marking the moment of liquidity equilibrium.
HOW TO USE
1. Identifying the "Magnet" (The Void)
When price moves aggressively, it leaves a "hole" in the auction.
Bullish Voids (Green): These represent areas where price surged so fast that buyers may still have unfilled orders sitting below. These act as Magnets for pullbacks.
Bearish Voids (Red): These represent areas where price plummeted, leaving a vacuum of selling pressure. These act as Magnets for relief rallies.
2. Trading the "Repair" Process
The Engine tracks how the market "repairs" these holes:
Partial Fill: If price enters a box but doesn't cross it, the "Magnet" is still active.
Full Repair: When a box is "sealed" (stops extending right), it indicates the imbalance is gone. If price "Seals" a green box and then bounces, it confirms the zone as Valid Institutional Support.
3. Confluence with the Trend
Continuation: In a strong uptrend, look for price to drop into a Green Bullish Void and find support. This is often the "Golden Entry" for trend followers.
Reversal Confirmation: If price ignores a Red Bearish Void and blasts right through it (sealing it instantly), it signals a massive shift in market regime and extreme bullish conviction.
USER SETTINGS
Lookback Period: How far back the engine searches for un-repaired gaps.
Min Gap Size (ATR %): Increase this to see only the "Major" institutional gaps; decrease it for a more granular intraday look.
Visual Styles: Fully customizable colors and transparency to match any chart theme (Dark/Light).
NOTES & DISCLAIMER
This script is a visualization of historical price imbalances and is intended for educational purposes only. It does not provide trade signals, entry/exit points, or financial advice. All trading involves risk.

Low-High Waves for NeowaveOpen your chart at daily and hide the symbol graphic. Now you can see the waves. It’s including limited data sorry for this but I’m not a programmer and TradingView have limitations.

EMA 1 & SALMA Intersection StrategyTrading Strategy: EMA 1 & SALMA Crossover System
This strategy is a Trend-Following system that focuses on the direct interaction between the price (represented by EMA 1) and a smoothed trendline (SALMA). Instead of relying on the color changes of the indicator, it uses mechanical crossover signals to enter and exit trades.
1. Indicators Used
EMA 1 (Exponential Moving Average): Since the period is 1, it effectively represents the Current Price. It reacts instantly to every market move.
SALMA v3.0 (Smoothed Adaptive Lattice Moving Average): A double-smoothed moving average that acts as the "Base Line" or "Trend Support/Resistance."
RSI (Relative Strength Index): Used as a Momentum Filter to ensure we don't trade against the market's strength.
2. Buy (Long) Entry Rules
You enter a Long position when the following conditions are met:
The Crossover: The EMA 1 (Price) crosses ABOVE the SALMA line. This indicates that the short-term momentum is shifting higher than the average trend.
The Filter (RSI): The RSI must be above 50. This confirms that the buyers are in control and the upward move has enough strength.
3. Sell (Short) Entry Rules
You enter a Short position when the following conditions are met:
The Crossunder: The EMA 1 (Price) crosses BELOW the SALMA line. This indicates a breakdown in price action.
The Filter (RSI): The RSI must be below 50. This confirms that the sellers are dominating and the downward momentum is real.
4. Key Advantages of This System
Objectivity: You don't guess based on the color of the line; you wait for a clear physical break (cross) of the line.
Precision: By using EMA 1, you get the earliest possible entry signal compared to slower moving averages.
False Signal Protection: The RSI 50 filter prevents you from entering "weak" trades where the price crosses the line but lacks the volume or momentum to continue.

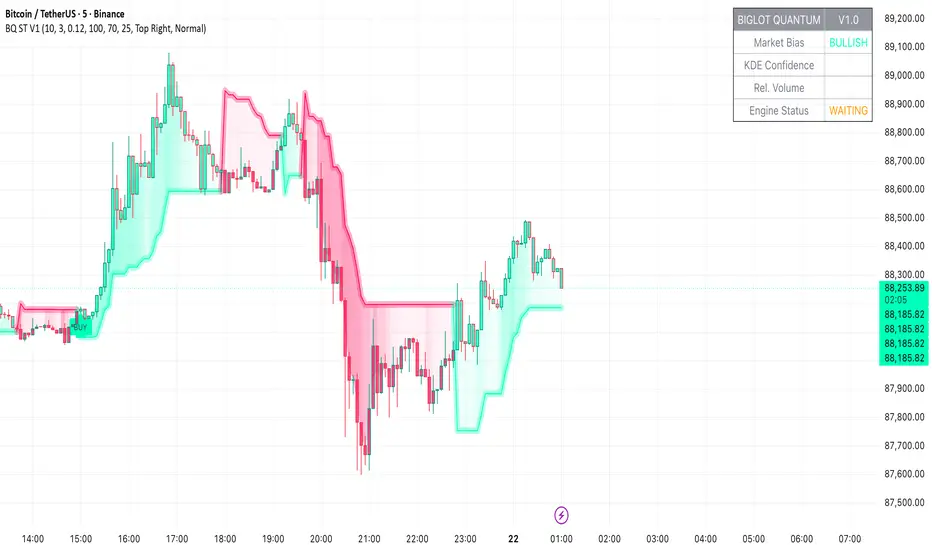
BigLot Quantum SuperTrend V1BigLot Quantum SuperTrend V1 is a trend-following indicator that enhances the traditional SuperTrend by integrating statistical volume analysis.
The script combines an ATR-based SuperTrend engine with Kernel Density Estimation (KDE) applied to relative buy and sell volume. Volume behavior is modeled statistically, allowing the indicator to filter breakout signals and activate only when volume conditions show high probability compared to historical data.
Bullish and bearish signals are generated when price crosses the SuperTrend line and the corresponding volume probability exceeds a user-defined threshold. This approach helps reduce false signals during low-liquidity or sideways market conditions.
The script includes visual trend highlighting, probability-based confidence filtering, and a real-time dashboard displaying trend direction, volume strength, and signal status. It is designed to work across all markets and timeframes without repainting.
Manipulation Candle (RIC) V0.2Interpretation and Trading Use
Boxed Candles: Represent 15-minute periods with unusually high range relative to daily volatility. These may signal:
Market manipulation (e.g., stop hunts or fakeouts).
Breakouts, reversals, or high-impact news.
Entry/exit points in strategies focusing on volatility expansion.
No Boxes: Indicates normal or low-volatility candles (range < threshold).
Multi-Timeframe Analysis: On lower timeframes (e.g., 5-min), boxes encompass multiple bars. On higher (e.g., 1-hour), they highlight specific 15-min segments.
Example: On a volatile stock like TSLA, a 0.2 multiplier might highlight candles during earnings releases, aiding in spotting trading opportunities.
Limitations and Considerations
Drawing Limits: TradingView caps drawing objects at ~500 per script. On long histories, older boxes may not load—zoom in or reduce chart bars.
Data Availability: Requires 15-minute and daily data; may not work on illiquid symbols or non-standard charts (e.g., Renko).
Real-Time Delays: Boxes appear only after 15-min closes; no intra-bar drawing.
No Alerts Built-In: Add custom alerts via TradingView's alert system (e.g., on condition changes).
Performance: Efficient, but on very low timeframes with long history, it may use more resources due to persistent boxes.
Customization: For extensions (e.g., labels, multiple timeframes), modify the code carefully in Pine Script® v6 to avoid errors.
Version History
V0.2: Added persistent historical boxes; refined new candle detection.
Future Updates: Potential additions like box limits or multi-multiplier support. Check for updates in the script comments.
If you encounter issues or need customizations, refer to TradingView's Pine Script® documentation or community forums. For error-free extensions in Pine Script® v6, ensure proper variable scoping, type declarations, and testing on historical data.

