RSI MITROV 1.0i do my notes lookin at this oscilator in Monthly, Weekly, Daily and 240.
more conffluency more chances to make some retracement or change trends direction
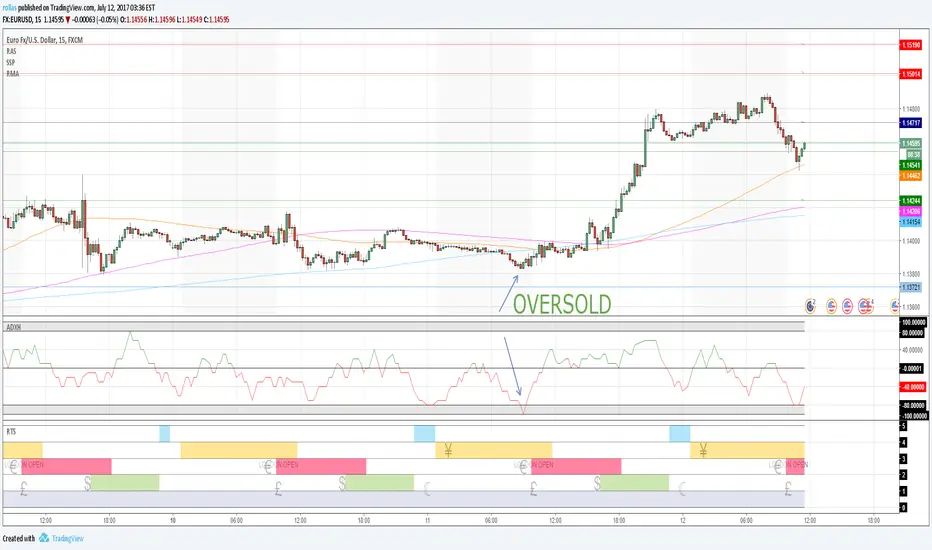
EXAMPLES
Oversold
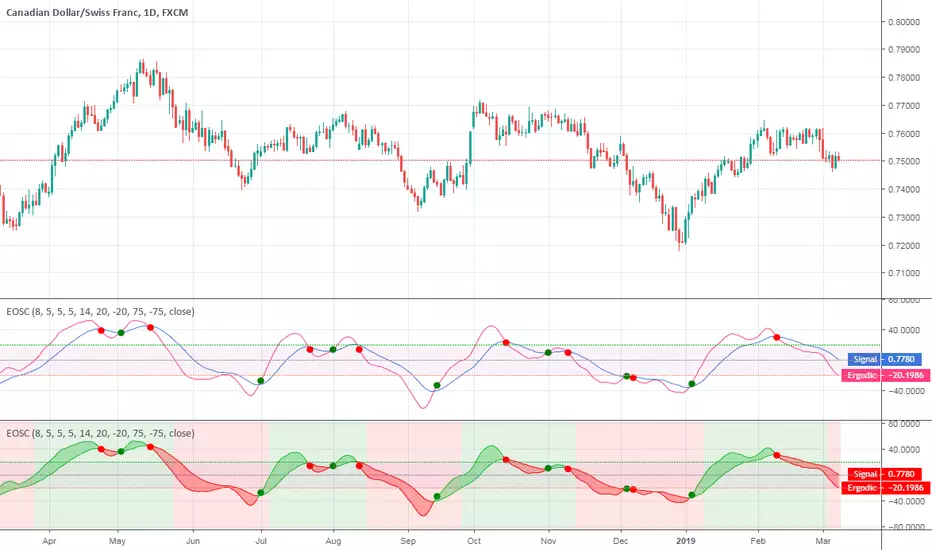
Ergodic OscillatorErgodic Oscillator indicator script.
Ergodic Oscillator is based on True Strength Index (TSI) by William Blau.
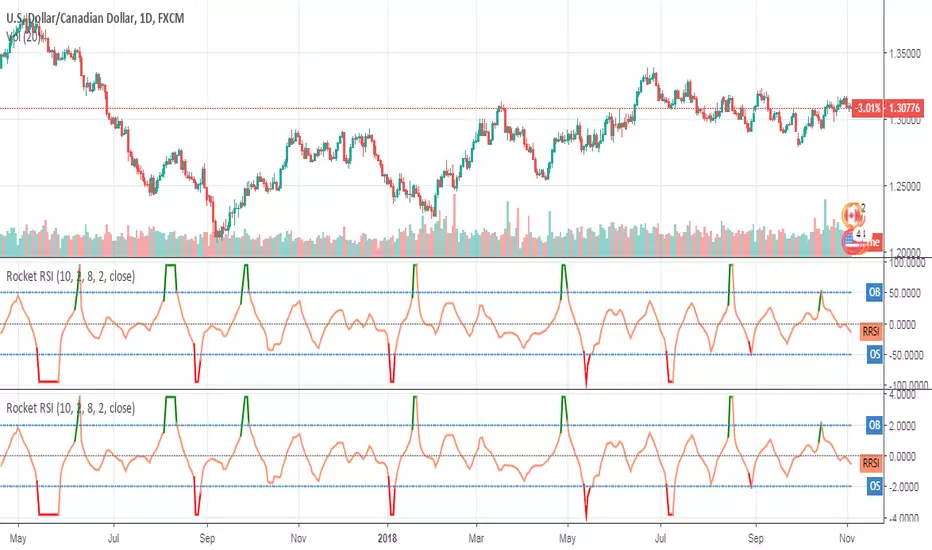
Rocket RSIRocket RSI indicator script.
This indicator was originally developed by John Ehlers (Stocks & Commodities V.36:6, RocketRSI - A Solid Propellant For Your Rocket Science Trading).
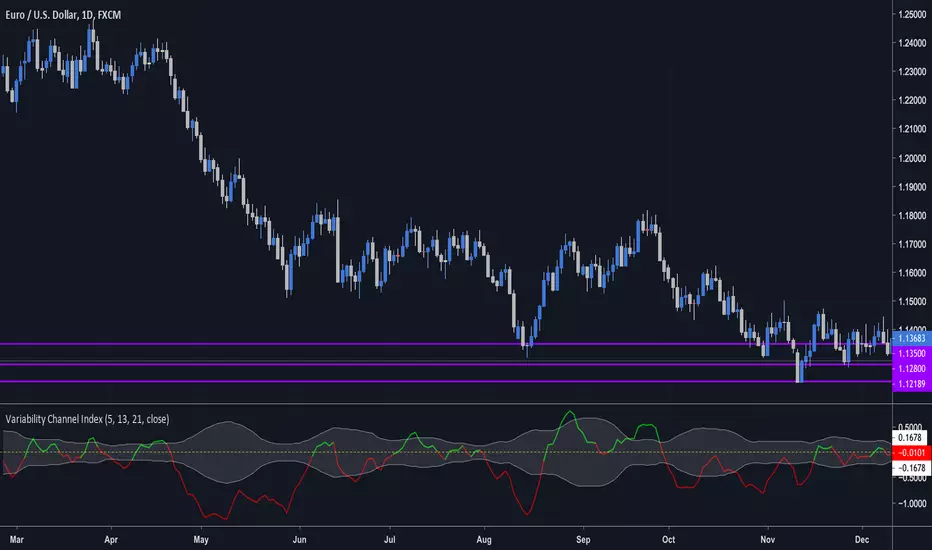
Variability Channel Index (by vitelot)This is a momentum, trend, as well as a divergence indicator.
It is similar to CCI, though it is based on a slow and fast EMA in connection to ATR, which
allows to interprete it easily.
Both EMAs and ATR have customisable period.
Further explanation and basic usage can be found in the comment section inside the script.
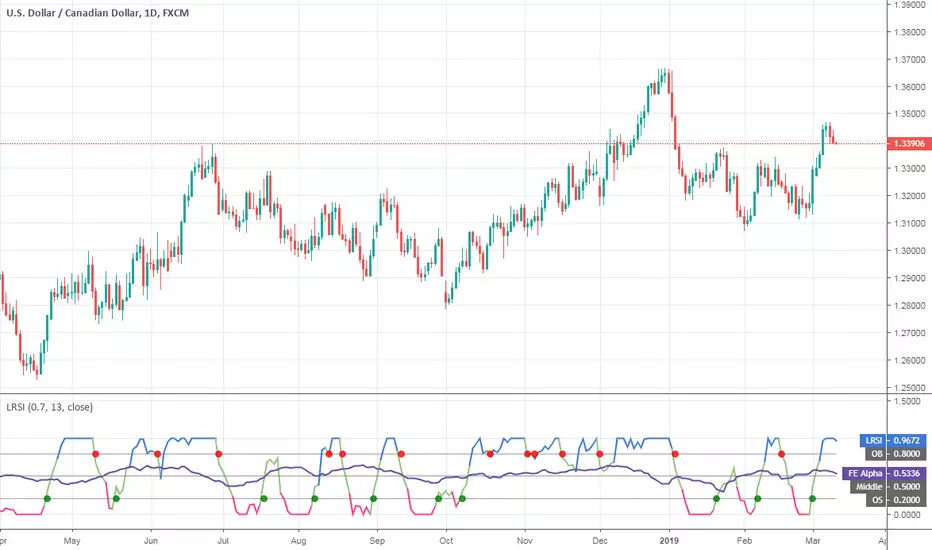
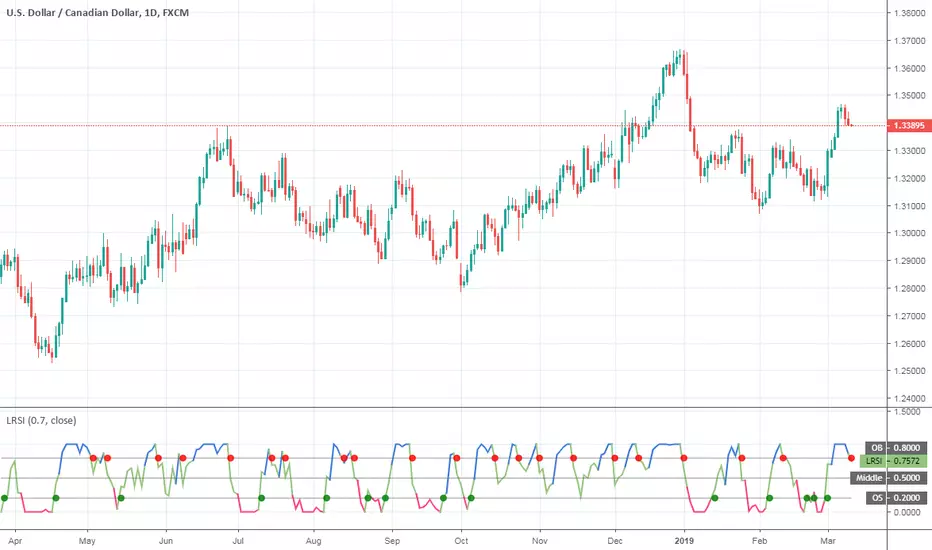
Laguerre RSI (Self Adjusting Alpha with Fractals Energy)Laguerre RSI (Self Adjusting Alpha with Fractals Energy) indicator script. I adopted idea from www.prorealcode.com and
If you disable `Apply Fractals Energy` option, you will get the original Laguerre RSI.
Relative Volatility IndexCorrected Relative Volatility Index. This indicator was originally developed by Donald Dorsey (Stocks & Commodities V.11:6 (253-256): The Relative Volatility Index).
The indicator was revised by Dorsey in 1995 (Stocks & Commodities V.13:09 (388-391): Refining the Relative Volatility Index).
I suggest the refined RVI with optional settings. If you disabled Wilder's Smoothing and Refined RVI you will get the original version of RVI (1993, as built-in).
Also, you can choose an algorithm for calculating Standard Deviation.

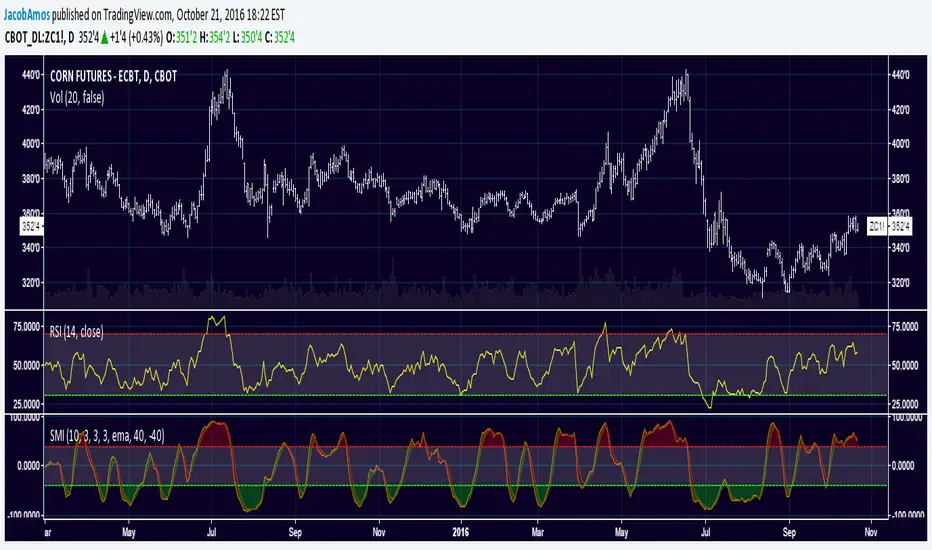
Rova MTF SMI MinuteStochastic Momentum Index is used to find oversold and overbought zones. It also helps to figure out whether to enter short trade or long trade.
Red Shade in the Top indicates that the stock is oversold and the Blue shade in the bottom indicates overbought.
The lighter color indicates that the trend is continuing while the darker color indicates the trend is reversing.
This indicator shows 3 Stochastic Momentum Index of 3 different Time Frames (with 1 minute as their base resolution) in one windows.

Relative Momentum IndexRelative Momentum Index indicator script. This indicator was originally developed by Roger Altman (Stocks & Commodities V. 11:2 (57-60)).
RMI with momentum period of 1 will be equal to an RSI when they have the same period and source price.

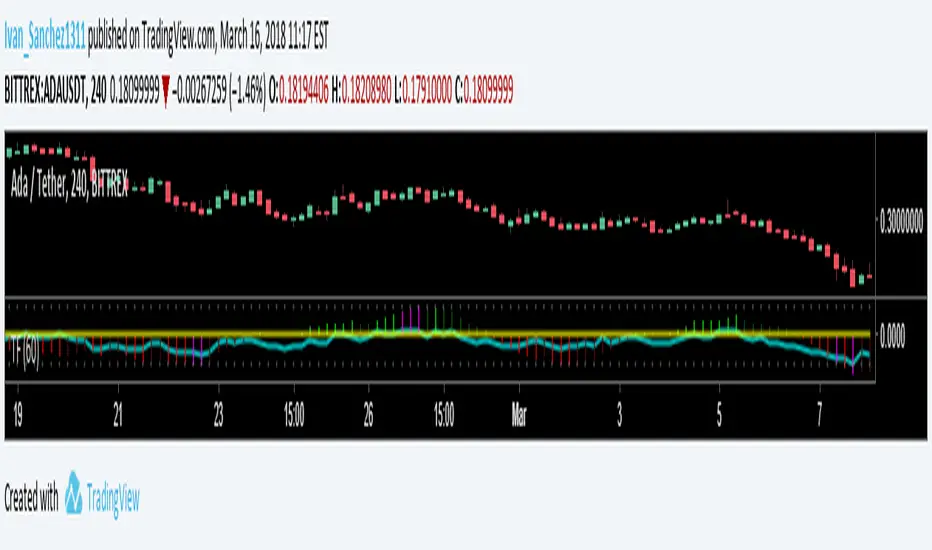
Trend FollowerTrend Follower (Follower)
The Trend Follower is a powerful trading tool, which helps us to control our operations.
This tool performs different calculations based on market movements, so it becomes a very versatile and reliable indicator.
This indicator tells us NOT to do and at what time it is prudent to leave an operation or take a share of profits.
If you have any questions, please let me know by private chat.
Regards!
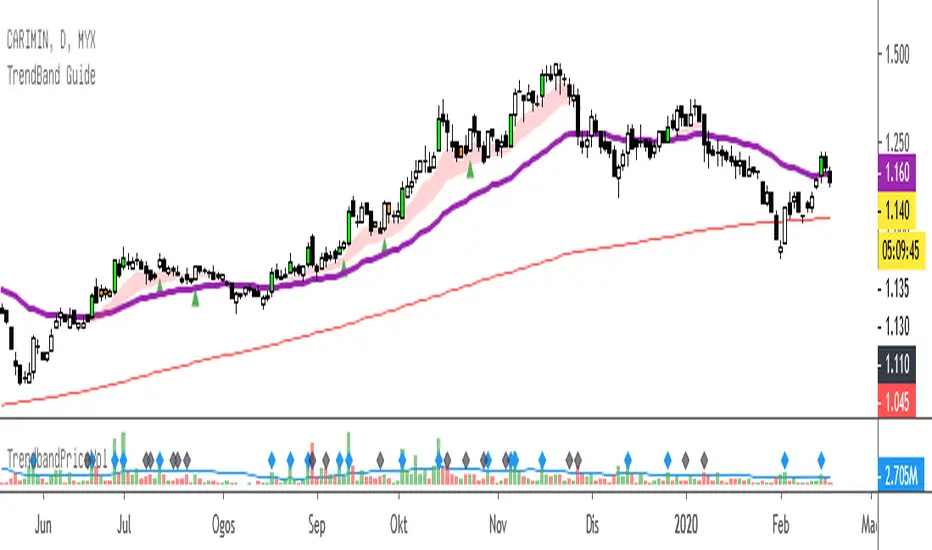
TrendBand GuideTrendBand Guide - simple way to analyse current chart trend.
Basic of usage:
1. TrendBand Color
Red : Chart in bullish condition
Green : Chart in bearish condition
Purple Line : Current trend direction
Red Line : Long term trend direction
2. Candle Color
Green Lime : Breakout 20 days high with more than average volume.
Red : Oversold condition base on RSI (14) days - below 35.
Note :
All color can be change from format menu.
When TrendBand in RED, find any breakout or pullback setup.
When TrendBand in Green, it show weakness in trend..find any potential rebound setup.
CMYK RMI◊ Introduction
I started using this script because of its fast reaction, and good tell for buy/sell moments on a short timescale.
For larger timescales, the overall trend should be taken into account regarding the levels.
In the future i will update this indicator, to automatically adjust those.
◊ Origin
The Relative Momentum Index was developed by Roger Altman and was introduced in his article in the February, 1993 issue of Technical Analysis of Stocks & Commodities magazine.
While RSI counts up and down days from close to close, the Relative Momentum Index counts up and down days from the close relative to a close x number of days ago.
This results in an RSI that is smoother.
◊ Adjustments
CMYK color theme applied.
Four levels to indicate intensity.
Two Timescales, to overview the broader trend, and fast movements.
◊ Usage
RMI indicates overbought and oversold zones, and can be used for divergence and trend analysis.
◊ Future Prospects
Self adjusting levels, relative to an SMA trend.
Alternative RMI, which functions as an overlay.
◊ ◊ ◊ ◊ ◊ ◊ ◊ ◊ ◊ ◊ ◊ ◊ ◊ ◊ ◊ ◊ ◊ ◊ ◊ ◊ ◊ ◊ ◊ ◊ ◊ ◊ ◊ ◊ ◊ ◊ ◊ ◊ ◊ ◊ ◊ ◊ ◊ ◊ ◊ ◊ ◊ ◊ ◊ ◊ ◊ ◊ ◊ ◊ ◊ ◊ ◊ ◊ ◊ ◊ ◊ ◊ ◊ ◊ ◊ ◊ ◊ ◊ ◊ ◊ ◊ ◊ ◊ ◊ ◊ ◊ ◊ ◊ ◊ ◊ ◊ ◊ ◊ ◊ ◊ ◊ ◊ ◊ ◊ ◊ ◊ ◊ ◊ ◊ ◊ ◊ ◊ ◊ ◊ ◊ ◊ ◊ ◊ ◊ ◊ ◊ ◊ ◊ ◊ ◊ ◊ ◊

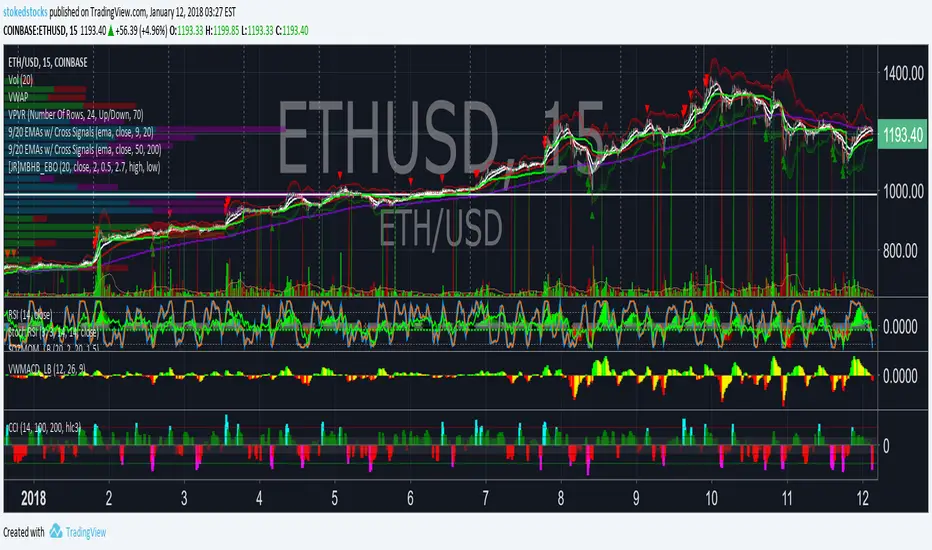
CCI Histogram w/ Color STOKEDSTOCKSCCI Histogram w/ Color Has EMA option to calculate CCI STOKEDSTOCKS
Finds oversold and Overbought conditions
stochifyStochastic RSI reflected in candles. Adds an element of caution when overbought, and an element of opportunity when oversold. BTFD.

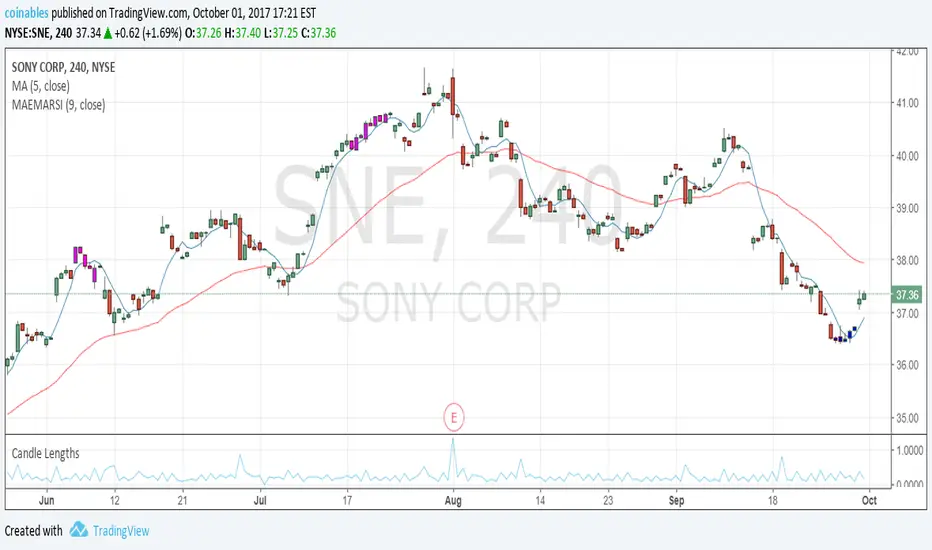
MA EMA RSICombining EMA and MA over-extension with RSI to help narrow down overbought and oversold opportunities.
Overbought/Oversold Simple Overbought/Oversold indicator
WARNING:
This script to change bars colors.

Colored Williams %RThis script is the same as Williams %R except that on green days we plot green and red on red days. If a bar opens and closes the same, we plot black.

Number Indicatorbased on indicator created by coinsheet.org created by autemox
tells you when 9 candles in a row are green or red candles (this indicates price may be oversold or overbought)

HYPER ADXADX typically shows the strength of a trend. Hyper ADX is specially coded for showing intraday overbought and oversold conditions.
Stochastic with False bar R2-2 by JustUncleLThis study project is an updated version of the implementation of the "Stochastic False BAR" indicator.
Description:
The standard Stochastic buy/sell indications come from Stochastic crosses about the standard overbought/oversold zones (80/20). This does not always work and you get stuck in the OB/OS zones with a trend continuation. Utilising a second much longer length Stochastic, the "False BAR" (Black) indicates when it is unsafe to take Stochastic cross over trades. Where the false bar does not appear (aqua, no background highlighing), the overbought / oversold conditions of the Stochastic can be considered higher-probability reversal areas and thus trading opportunities.
This Revision:
Added options to enable/disable False Bar lines and Stochastic trends.
Added options to modify upper and lower limits of false bar Stochastic and trading stochastic trend.
Added option to show the trading Stochastic as coloured Ribbon.
Added name titles for all plots
Added Background highlighting for False Bar.

B3 Stochastic FullA colorful take on the classic stochastic indicator, coded from scratch. Enjoy! :)

B3 Directional Trend IndexB3 Directional Trend Index ~ All about the trend! William Blau is the designer of this gem, and IMHO it is the best trend finder of all the lagging indicators out there I have tested. It is important to pay attention to the slope and thickness of the line, and its relationship to zero. A reversion to the zero may look momentous, but in fact it could reverse when it reaches mean, only to turn back around. You can see this in March and April of this silver futures daily chart. Makes for a great instrument on anything you consider trendy, like crude oil for example. The default user inputs are set to my liking, as I find them to be great on all charts and resolutions. You may read around to find more about this on the internet, or its mentioned in Krausz's work. Also, imprtant to remember when no trend, trend finders like this sufffer, so be wise as to what market condition you are in. Rangy and within Range = no, On the Move = yes.

Stochastic Momentum IndexThis is an implementation of the Stochastic Momentum Index from William Blau's his article in Stocks & Commodities .
This also allows the use of various different kinds of moving averages for the signal line. Options for this argument are:
sma (simple moving average)
ema (exponential moving average)
wma (weighted moving average)
trima (triangular moving average)
zlema (zero-lag exponential moving average)
dema (double exponential moving average)
tema (triple exponential moving average)
hma (hull moving average)