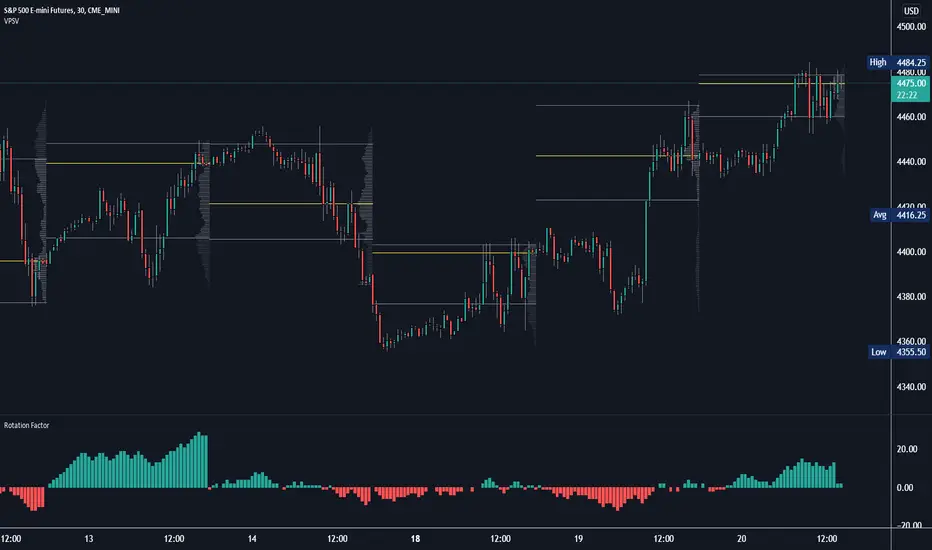
Rotation Factor: Buy/Sell Pressure for Market/Volume ProfileRotation Factor is a simple formula to figure out the buy and sell pressure of the overall day. Rotation Factor is usually combined with Market Profile or Volume Profile analysis. It is designed to be used on the 30min timeframe with a 1D interval reset. It can be used on other timeframes, but results will vary. Some Rotation Factor traders like to use it on a daily with a 1M interval reset for longer term trading.
The formula is very clean because it only focuses on price action, highs and lows. The formula is as follows:
Current Bar makes Higher High and Higher Low +2 points
Current Bar makes Lower High and Lower Low -2 Points
Current Bar makes Higher High and Lower Low 0 Points
Current Bar makes Lower High and Higher Low 0 Points
Current High and Previous High are Equal and Higher Low +1 Points
Current Bar makes Higher High but Current and Previous lows are equal +1 Points
Current Bar makes Lower High but Current and Previous lows are equal -1 Points
Current High and Previous High are Equal and Lower Low -1 Points
I hope you enjoy this indicator, if you have any questions let me know in the comments.
Otg
Oasis Trading Group Market Making Bot - Mean Reversion BandsThe OTG Market Making Bot was designed with mean reversion trading in mind. It uses advanced ATR and other volatility formulas to create a set of bands that price should stay within. If price is testing the upper or lower bands then it is "extended" and a mean reversion back to the midline is likely.
The indicator comes with two sets of reversion bands, by default they are set to two and three standard deviations away from the midline, these can be changed to your preference. The indicator will give you Buy and Sell arrows if the conditions are being met. The conditions can be as simple as price hitting the bands or with certain filters, the filters are as follows:
Volatility Filter: Based on your settings it will look at the Current ATR vs Historic ATR Average if the Current ATR is higher than the average it will not show the mean reversion Buy/Sell signals because the volatility is too high. This filter can be turned on and off in the settings.
Trend Filter: Based on your settings it will lookback a certain amount of candles to see if the current price action is ranging or trending. If the current price action is determined to be trending it will not show the mean reversion Buy/Sell signals because it wants to trade within a range. This filter cannot be turned off in the settings, but if you wish to see all the Mean Reversion Buy/Sell signals without any filters you can turn them on in the style settings.
Midline: The midline is color coded based on your Trend Lookback settings. If it determines that the market is ranging it will be colored Green, if it determines that the market is trending it will be colored Red. Green means you are safe to take Mean Reversion trades.
The indicator comes with multiple alerts for all the different Buy/Sell signals. These signals can come from the first set of bands, second set, or unfiltered.
This indicator is designed to be paired with the ATR Improved Indicator I have created which is open source, it can be found here.
Also, paired with the OTG Automated Trading Bot. The OTG Trading Bot is a trend following bot, it excels in trend trading but fails in range trading. This Mean Reversion bot was designed to compliment the OTG Bot perfectly.
The Oasis Trading Group Market Making Bot will be available as a free add-on to all OTG Trading Bot users.
If you have any questions feel free to let me know in the comments or DM me.

Average True Range - ImprovedAverage True Range - Improved is a small variation I have made to the standard ATR indicator. It will test the current ATR against the Historic Average ATR of your preference to see if the current volatility is high or low.
Once it has determined if it is high or low it will color code the circles at the top based on this information. Green means the current volatility is low and red means the current volatility is higher than the historic average.
In the settings I have also placed a couple styles, if you wish to show the ATR and Historic ATR in percent format instead of normal you can turn them on in the style settings. If you are using the percent format I recommend setting the Precision to 2-3 decimal places.
I hope you all enjoy this indicator, if you have any questions please feel free to post them in the comments.
