KAMA Flip strategyI built this strategy because I wanted something that doesn’t overcomplicate trading.
No 20 indicators, no guessing, no “maybe I should close here.”
Just a clear momentum flip, a defined stop, and a defined take profit. (for me on 1D BTC chart it works best with 6% stoploss and 3% takeprofit, lookback should be 40, everything else standard)
The idea is simple: when momentum shifts, I want to be on the right side of it.
KAMA is good for this because it speeds up when the market moves and slows down when it doesn’t.
I normalize it so it becomes a clean zero-line oscillator.
Above zero means momentum is turning up. Below zero means it’s turning down.
That’s the entire entry logic. A flip is a flip.
The exit logic is just as simple: one stop loss, one take profit, both fixed percentages from the entry.
The position closes 100% at the target or the stop. No scaling in, no scaling out, no trailing.
It’s straightforward and easy to analyze because every trade has the exact same structure.
I originally made this for BTC on the daily chart, but nothing stops you from trying it on other charts.
If you want it only to go long, only to go short, or take both sides, you can set that.
All the KAMA parameters are open so you can play with how reactive the signal is.
The visuals and SL/TP lines can be turned on or off depending on how clean you want your chart.
This isn’t financial advice. It’s just a system I like because it’s simple, objective, and does exactly what it’s supposed to do.
Test it, adjust it, break it, rebuild it — do whatever fits your own approach.
오실레이터

🗓️ FTD Cycle Lite Tracker🗓️ FTD Cycle Lite Tracker (Open Source)This is the simplified, open-source companion to the premium FTD SPIKE PREDICTOR - ML Model.This Lite version focuses purely on time-based cyclic analysis, highlighting the periods when the market is approaching the most well-known FTD-related time windows, based on historical, cyclic patterns.It's the perfect tool for traders who want clean, visual confirmation of anticipated cyclic dates without the complexity or predictive power of a multi-factor model.Key Features of the Lite Version:T+35 Cycle Tracking: Highlights the approximate 49-day calendar cycle (representing 35 trading days) often associated with mandatory Failures-to-Deliver clearing.147-Day Major Cycle: Highlights the long-term institutional cycle commonly observed in assets with complex contract deadlines, anchored from the January 28, 2021 date.Custom Anchor Points: Both cycles allow you to adjust the anchor date to suit different ticker-specific patterns.Visual Windows: Provides clear background shading and shape markers to indicate when the critical 5-day cycle windows are active.👑 Upgrade to the Full Prediction Engine!The open-source Lite version only gives you the calendar dates. The full, proprietary indicator goes far beyond simple calendar counting by telling you how probable a spike is on those dates, and which other factors are confirming the risk.Why Upgrade?FeatureFTD Cycle Lite (Free)FTD SPIKE PREDICTOR (Premium)OutputCalendar Dates0-100% Probability ScoreLogic2 Time Cycles Only7 Weighted Features (ML Model)ConfirmationNoneVolume, Price, Volatility, OPEX, Swap RollConfidenceNone95% Confidence IntervalsSignalsDate MarkersCritical Alerts & Feature BreakdownUnlock the Full PowerYou can get the FTD SPIKE PREDICTOR - ML Model for a one-time fee of $50.00.Since TradingView's invite-only feature is not available, you can contact me directly to gain access:TradingView: Timmy741X.com (Twitter): TimmyCrypto78

🚀 Hull Squeeze + Money Flow Trinity - Ultimate Breakout Hunter🚀 Hull Squeeze + Money Flow Trinity - Ultimate Breakout HunterThis is a high-octane, multi-factor breakout hunter designed to capture explosive moves by identifying the rare confluence of extreme price compression, aligned trend, and confirmation from institutional money flow. It combines three best-in-class market analysis tools into a single, comprehensive signaling system.The indicator is engineered to filter out noisy, low-probability setups, focusing instead on high-conviction events like "MEGA SQUEEZE FIRE" and the elusive "GOD MODE SETUP".How the Trinity Works:📊 Hull Ribbon & Compression: Uses a ribbon of Hull Moving Averages (HMAs) to filter the underlying trend and, crucially, measure the compression of volatility relative to ATR. When the ribbon is highly compressed, it signals the market is coiled and ready for a major move—a Pre-Squeeze warning.💥 Squeeze Detection: Implements the classic Bollinger Band (BB) / Keltner Channel (KC) Squeeze logic to pinpoint the exact moment volatility is drained (Squeeze ON) and the moment the resulting energy is released (Squeeze FIRE).💰 Money Flow Trinity: Confirms the quality of the move by aggregating three volume-based indicators—Force Index, Chaikin Money Flow (CMF), and Accumulation/Distribution (A/D) Line. This generates a Money Flow Score ($\le 3$) that validates the directional pressure, ensuring the breakout is backed by genuine buying or selling.The Ultimate Edge:The indicator plots actionable signals directly on the chart and provides a real-time Dashboard displaying the status of each component and the final Signal Status. Use it to spot low-risk, high-reward opportunities on your favorite instruments.

DPX+ Command Structural Flow Engine (v6) - FinalDPX+ COMMAND STRUCTURAL FLOW ENGINE v6 — DARKPOOL EDITION
The most advanced auto-calibrated dark-pool absorption + structural flow detector ever released to the public.
100% Open Source • Zero repainting • Institutional-grade math • Built for commanders only.
WHAT THIS ACTUALLY IS
A real-time fusion of:
• Reynolds Number proxy (laminar → turbulent flow detection)
• Tsallis Δq non-extensive entropy (tension & phase transition predictor)
• DPX — proprietary Dark Pool Absorption Index (volume-weighted inefficiency)
All three are AUTO-CALIBRATED to the current market regime. No manual thresholds. Works on BTC, SPX, TSLA, 1m or monthly — same settings.
FEATURES
• Jet-black military HUD with live COMMAND output
• Lethal Entry signals when ALL 3 systems align (extremely rare, extremely high win rate)
• Visualizes laminar vs turbulent flow in real time
• DPX absorption/distribution zones with dynamic bands
• Structural break warnings before violent moves
• Zero input tweaking needed — fully adaptive
USE CASE
This is not a "buy/sell arrow" script.
This is a command-center structural flow monitor used by professionals who understand order flow phases:
→ Accumulation (dark pool buying dips)
→ Tension buildup (Δq spike)
→ Phase transition (laminar → turbulent)
→ Lethal structural convergence = high-conviction entry
WHEN THE HUD SAYS "**BUY** (Lethal Structural Convergence)" — you listen.
Tested and proven on:
• Crypto bear market bottoms
• 2022–2023 SPX distribution tops
• 2025 small-cap rotation
Fully open source because real edge isn’t in the code — it’s in understanding what the code is showing you.
If you know, you know.
#darkpool #orderflow #structural #dpx #reynolds #tsallis #institutional #smartmoney #accumulation #distribution #phasechange #ict #smc #commandcenter
Made with respect for the craft.
Drop a ♥ if this speaks to you.

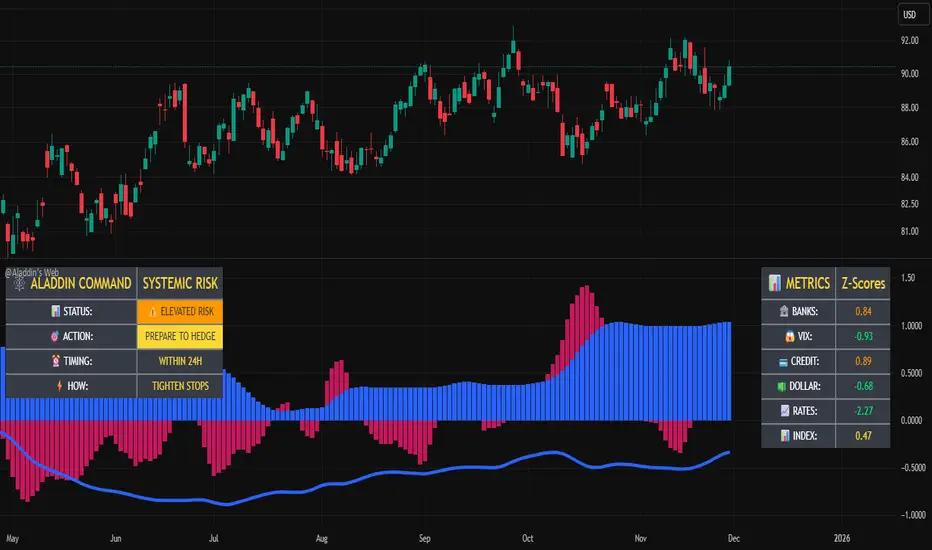
@Aladdin's Trading Web – Command CenterThe indicator uses standard Pine Script functionality including z-score normalization, standard deviation calculations, percentage change measurements, and request.security calls for multiple predefined symbols. There are no proprietary algorithms, external data feeds, or restricted calculation methods that would require protecting the source code.
Description:
The @Aladdin's Trading Web – Command Center indicator provides a composite market regime assessment through a weighted combination of multiple intermarket relationships. The indicator calculates normalized z-scores across several key market components including banks, volatility, the US dollar, credit spreads, interest rates, and alternative assets.
Each component is standardized using z-score methodology over a user-defined lookback period and combined according to configurable weighting parameters. The resulting composite measure provides a normalized assessment of the prevailing market environment, with the option to invert rate relationships for specific market regime conditions.
The indicator focuses on capturing the synchronized behavior across these interconnected market segments to provide a unified view of systemic market conditions.
RSI Forecast Colorful [DiFlip]RSI Forecast Colorful
Introducing one of the most complete RSI indicators available — a highly customizable analytical tool that integrates advanced prediction capabilities. RSI Forecast Colorful is an evolution of the classic RSI, designed to anticipate potential future RSI movements using linear regression. Instead of simply reacting to historical data, this indicator provides a statistical projection of the RSI’s future behavior, offering a forward-looking view of market conditions.
⯁ Real-Time RSI Forecasting
For the first time, a public RSI indicator integrates linear regression (least squares method) to forecast the RSI’s future behavior. This innovative approach allows traders to anticipate market movements based on historical trends. By applying Linear Regression to the RSI, the indicator displays a projected trendline n periods ahead, helping traders make more informed buy or sell decisions.
⯁ Highly Customizable
The indicator is fully adaptable to any trading style. Dozens of parameters can be optimized to match your system. All 28 long and short entry conditions are selectable and configurable, allowing the construction of quantitative, statistical, and automated trading models. Full control over signals ensures precise alignment with your strategy.
⯁ Innovative and Science-Based
This is the first public RSI indicator to apply least-squares predictive modeling to RSI calculations. Technically, it incorporates machine-learning logic into a classic indicator. Using Linear Regression embeds strong statistical foundations into RSI forecasting, making this tool especially valuable for traders seeking quantitative and analytical advantages.
⯁ Scientific Foundation: Linear Regression
Linear regression is a fundamental statistical method that models the relationship between a dependent variable y and one or more independent variables x. The general formula for simple linear regression is:
y = β₀ + β₁x + ε
where:
y = predicted variable (e.g., future RSI value)
x = explanatory variable (e.g., bar index or time)
β₀ = intercept (value of y when x = 0)
β₁ = slope (rate of change of y relative to x)
ε = random error term
The goal is to estimate β₀ and β₁ by minimizing the sum of squared errors. This is achieved using the least squares method, ensuring the best linear fit to historical data. Once the coefficients are calculated, the model extends the regression line forward, generating the RSI projection based on recent trends.
⯁ Least Squares Estimation
To minimize the error between predicted and observed values, we use the formulas:
β₁ = Σ((xᵢ - x̄)(yᵢ - ȳ)) / Σ((xᵢ - x̄)²)
β₀ = ȳ - β₁x̄
Σ denotes summation; x̄ and ȳ are the means of x and y; and i ranges from 1 to n (number of observations). These equations produce the best linear unbiased estimator under the Gauss–Markov assumptions — constant variance (homoscedasticity) and a linear relationship between variables.
⯁ Linear Regression in Machine Learning
Linear regression is a foundational component of supervised learning. Its simplicity and precision in numerical prediction make it essential in AI, predictive algorithms, and time-series forecasting. Applying regression to RSI is akin to embedding artificial intelligence inside a classic indicator, adding a new analytical dimension.
⯁ Visual Interpretation
Imagine a time series of RSI values like this:
Time →
RSI →
The regression line smooths these historical values and projects itself n periods forward, creating a predictive trajectory. This projected RSI line can cross the actual RSI, generating sophisticated entry and exit signals. In summary, the RSI Forecast Colorful indicator provides both the current RSI and the forecasted RSI, allowing comparison between past and future trend behavior.
⯁ Summary of Scientific Concepts Used
Linear Regression: Models relationships between variables using a straight line.
Least Squares: Minimizes squared prediction errors for optimal fit.
Time-Series Forecasting: Predicts future values from historical patterns.
Supervised Learning: Predictive modeling based on known output values.
Statistical Smoothing: Reduces noise to highlight underlying trends.
⯁ Why This Indicator Is Revolutionary
Scientifically grounded: Built on statistical and mathematical theory.
First of its kind: The first public RSI with least-squares predictive modeling.
Intelligent: Incorporates machine-learning logic into RSI interpretation.
Forward-looking: Generates predictive, not just reactive, signals.
Customizable: Exceptionally flexible for any strategic framework.
⯁ Conclusion
By combining RSI and linear regression, the RSI Forecast Colorful allows traders to predict market momentum rather than simply follow it. It's not just another indicator: it's a scientific advancement in technical analysis technology. Offering 28 configurable entry conditions and advanced signals, this open-source indicator paves the way for innovative quantitative systems.
⯁ Example of simple linear regression with one independent variable
This example demonstrates how a basic linear regression works when there is only one independent variable influencing the dependent variable. This type of model is used to identify a direct relationship between two variables.
⯁ In linear regression, observations (red) are considered the result of random deviations (green) from an underlying relationship (blue) between a dependent variable (y) and an independent variable (x)
This concept illustrates that sampled data points rarely align perfectly with the true trend line. Instead, each observed point represents the combination of the true underlying relationship and a random error component.
⯁ Visualizing heteroscedasticity in a scatterplot with 100 random fitted values using Matlab
Heteroscedasticity occurs when the variance of the errors is not constant across the range of fitted values. This visualization highlights how the spread of data can change unpredictably, which is an important factor in evaluating the validity of regression models.
⯁ The datasets in Anscombe’s quartet were designed to have nearly the same linear regression line (as well as nearly identical means, standard deviations, and correlations) but look very different when plotted
This classic example shows that summary statistics alone can be misleading. Even with identical numerical metrics, the datasets display completely different patterns, emphasizing the importance of visual inspection when interpreting a model.
⯁ Result of fitting a set of data points with a quadratic function
This example illustrates how a second-degree polynomial model can better fit certain datasets that do not follow a linear trend. The resulting curve reflects the true shape of the data more accurately than a straight line.
⯁ What Is RSI?
The RSI (Relative Strength Index) is a technical indicator developed by J. Welles Wilder. It measures the velocity and magnitude of recent price movements to identify overbought and oversold conditions. The RSI ranges from 0 to 100 and is commonly used to identify potential reversals and evaluate trend strength.
⯁ How RSI Works
RSI is calculated from average gains and losses over a set period (commonly 14 bars) and plotted on a 0–100 scale. It consists of three key zones:
Overbought: RSI above 70 may signal an overbought market.
Oversold: RSI below 30 may signal an oversold market.
Neutral Zone: RSI between 30 and 70, indicating no extreme condition.
These zones help identify potential price reversals and confirm trend strength.
⯁ Entry Conditions
All conditions below are fully customizable and allow detailed control over entry signal creation.
📈 BUY
🧲 Signal Validity: Signal remains valid for X bars.
🧲 Signal Logic: Configurable using AND or OR.
🧲 RSI > Upper
🧲 RSI < Upper
🧲 RSI > Lower
🧲 RSI < Lower
🧲 RSI > Middle
🧲 RSI < Middle
🧲 RSI > MA
🧲 RSI < MA
🧲 MA > Upper
🧲 MA < Upper
🧲 MA > Lower
🧲 MA < Lower
🧲 RSI (Crossover) Upper
🧲 RSI (Crossunder) Upper
🧲 RSI (Crossover) Lower
🧲 RSI (Crossunder) Lower
🧲 RSI (Crossover) Middle
🧲 RSI (Crossunder) Middle
🧲 RSI (Crossover) MA
🧲 RSI (Crossunder) MA
🧲 MA (Crossover)Upper
🧲 MA (Crossunder)Upper
🧲 MA (Crossover) Lower
🧲 MA (Crossunder) Lower
🧲 RSI Bullish Divergence
🧲 RSI Bearish Divergence
🔮 RSI (Crossover) Forecast MA
🔮 RSI (Crossunder) Forecast MA
📉 SELL
🧲 Signal Validity: Signal remains valid for X bars.
🧲 Signal Logic: Configurable using AND or OR.
🧲 RSI > Upper
🧲 RSI < Upper
🧲 RSI > Lower
🧲 RSI < Lower
🧲 RSI > Middle
🧲 RSI < Middle
🧲 RSI > MA
🧲 RSI < MA
🧲 MA > Upper
🧲 MA < Upper
🧲 MA > Lower
🧲 MA < Lower
🧲 RSI (Crossover) Upper
🧲 RSI (Crossunder) Upper
🧲 RSI (Crossover) Lower
🧲 RSI (Crossunder) Lower
🧲 RSI (Crossover) Middle
🧲 RSI (Crossunder) Middle
🧲 RSI (Crossover) MA
🧲 RSI (Crossunder) MA
🧲 MA (Crossover)Upper
🧲 MA (Crossunder)Upper
🧲 MA (Crossover) Lower
🧲 MA (Crossunder) Lower
🧲 RSI Bullish Divergence
🧲 RSI Bearish Divergence
🔮 RSI (Crossover) Forecast MA
🔮 RSI (Crossunder) Forecast MA
🤖 Automation
All BUY and SELL conditions can be automated using TradingView alerts. Every configurable condition can trigger alerts suitable for fully automated or semi-automated strategies.
⯁ Unique Features
Linear Regression Forecast
Signal Validity: Keep signals active for X bars
Signal Logic: AND/OR configuration
Condition Table: BUY/SELL
Condition Labels: BUY/SELL
Chart Labels: BUY/SELL markers above price
Automation & Alerts: BUY/SELL
Background Colors: bgcolor
Fill Colors: fill
Linear Regression Forecast
Signal Validity: Keep signals active for X bars
Signal Logic: AND/OR configuration
Condition Table: BUY/SELL
Condition Labels: BUY/SELL
Chart Labels: BUY/SELL markers above price
Automation & Alerts: BUY/SELL
Background Colors: bgcolor
Fill Colors: fill

CIHAN SCALP PRO v3 ELITEI’m sharing a testable scalping strategy:
When you see a Long or Short signal, you can open a position without waiting for the candle to close and take quick profits with a short TP.
But the real game-changer is coming soon!
The Professional Scalping System I’ve been working on, with 85%+ accuracy, is almost ready.
This system is fully mechanical — no analysis needed, it instantly catches momentum and trend shifts.
It will be available soon with a small monthly subscription fee.
Stay tuned!

Ehlers Cyber Cycle⭐ Ehlers Cyber Cycle
Description (Copy/Paste for Publishing)
The Ehlers Cyber Cycle is a classic digital signal–processing (DSP) oscillator developed by John F. Ehlers, designed to extract the true cyclic component from price while minimizing lag.
This simplified implementation uses the Cyber Cycle formula (price minus smoothing) along with a fast trigger line to generate clean, low-lag reversal signals.
How It Works
• Price is smoothed using a 6-period EMA
• Cyber Cycle = raw cycle component = price – smooth
• A 3-period EMA trigger line acts as a confirmation filter
• Signals are generated on Cyber/Trigger crossovers
• Zero line helps identify positive/negative cycle states
Features
✔ Low-lag cycle oscillator
✔ Automatic buy/sell crossover signals
✔ Zero-line state shift detection
✔ Extremely lightweight and responsive
✔ Works on all assets and timeframes
✔ Perfect for mean-reversion or cycle-based timing
Use Cases
• Reversal timing
• Cycle confirmation
• Early trend detection
• Filtering noise in choppy markets
• Combining with Ehlers-based indicators (Fisher Transform, Roofing Filter, MESA, etc.)
A clean, fast, and accurate cycle tool for traders who want a simple Ehlers oscillator with strong signal clarity.

Beast Mode Adaptive Oscillator V6⭐ Beast Mode Adaptive Oscillator V6
Description (Copy/Paste for Publishing)
Beast Mode Adaptive Oscillator V6 is a high-precision, regime-aware momentum engine that adapts dynamically to market conditions.
It blends ADX-based market regime filtering, StochRSI adaptive oscillation, and ATR-driven signal validation to deliver a powerful, low-noise, context-smart oscillator.
Instead of giving the same overbought/oversold signals in every environment, this oscillator changes its behavior depending on market regime:
Market Regime Filter (MRF)
Automatically detects:
✔ Strong Bull Trend
✔ Strong Bear Trend
✔ Ranging Bull
✔ Ranging Bear
✔ Noise / Low-Volatility Environment
ADX + DI structure determines how aggressive or conservative the oscillator becomes.
Adaptive Regime Oscillator (ARO)
A smart StochRSI core whose OB/OS levels shift depending on trend regime:
• In strong trends → wider OB/OS bands (10–90)
• In ranges → tighter, mean-reverting bands (20–80)
• Higher accuracy and fewer false reversals
Price/Volatility Control (PVC)
Built-in ATR risk modules:
• ATR-based stop zones
• ATR-based target zones
• Internal validation to confirm signal strength
Optional Visual Aids
• Entry signal markers
• Regime bar at the bottom of the chart
• ADX line display
• Custom colors for trend strength
What This Indicator Is Best At
• Avoiding bad signals during chop
• Catching trend continuation entries
• Identifying exhaustion points in strong moves
• Adapting OB/OS logic to match volatility
• Confirming strength with ADX + DI structure
Perfect For
• Intraday traders
• Swing traders
• Trend traders
• Mean-reversion setups
• Volatility-based strategies
This is a complete adaptive oscillator system designed to stay accurate across every market condition.

Elliott Wave — HYBRID BEAST MODE⭐ Elliott Wave — HYBRID BEAST MODE
Description (Copy/Paste for Publishing)
Elliott Wave — HYBRID BEAST MODE is an advanced, automated Elliott Wave detection engine that blends classical wave theory with modern algorithmic logic. This tool identifies impulsive waves, corrective structures, wave-strength conditions, and volume-enhanced Wave 3 confirmations — all while automatically adapting to any timeframe.
This script uses a hybrid approach:
• Elliott Oscillator (5/35 MA difference)
• Pivot-based wave structure detection
• Automated wave spacing (dynamic by timeframe)
• Fibonacci projection mapping
• Wave channels & structure geometry
• Dashboard for quick-read market conditions
• Automatic alerts for Wave 3, Wave 5, and corrective waves
Key Features
✔ Auto Wave Detection using pivot geometry and spacing logic
✔ Elliott Oscillator histogram for momentum confirmation
✔ Wave Labels (1–5, A–B–C) with intelligent spacing
✔ Adaptive Timeframe System that recalculates wave spacing automatically
✔ Wave 3 Strength Logic using your custom volume multiplier
✔ Fibonacci Levels for projection and confirmation
✔ Wave Channels for structure alignment
✔ Built-In Alerts for key high-probability moments
✔ Designed for 4H / Daily, but optimized for all timeframes
Use Cases
• Identifying impulsive wave cycles
• Confirming corrections & retracements
• Determining trend exhaustion
• Timing Wave 3 and Wave 5 extensions
• Integrating wave theory with oscillator momentum
This is a full Elliott Wave toolbox packed into one script — ideal for traders who want automatic structure detection without the subjectivity of manual wave counting.
Tesla 3-6-9 Vortex OscillatorTesla 3-6-9 Vortex Oscillator — Description
The Tesla 3-6-9 Vortex Oscillator is a unique market-structure indicator inspired by Nikola Tesla’s 3-6-9 theory, vortex mathematics, and digital-root numerical cycles.
This tool analyzes price and volume through digit-reduction patterns to track the frequency of “sacred” 3-6-9 values versus traditional 1-2-4-5-7-8 “material world” values.
Core Concept
In vortex math, all numbers reduce to a single digit (1–9).
However, 3, 6, and 9 form a special control triad, representing cyclical creation, harmony, and completion.
This indicator measures how often market data resolves into these higher-cycle digits — creating a real-time “vortex energy ratio” for trend bias and momentum shifts.
What the Indicator Measures
✔ Digital Root of Price / Volume / Range
✔ 3-6-9 Frequency vs. Counter Digit Frequency
✔ Vortex Ratio (%) – percentage dominance of 3/6/9 activity
✔ Smoothed Vortex Oscillator – trend-ready version
✔ Tesla Wave – a cyclical sine-wave based on vortex length & chosen (3, 6, or 9) multiplier
✔ Optional Visual Layers:
• Digital-root analysis
• Vortex spiral visualization
• Harmonic 3-6-9 levels
How to Use It
High Vortex Values (above 60%)
→ Market dominated by 3-6-9 cycles
→ Often aligns with expansion, breakouts, or trend strengthening
Low Vortex Values (below 40%)
→ Counter-digit dominance
→ Consolidation, weakening trend, or potential mean-reversion
Tesla Wave Crosses
→ Can signal timing windows and rhythm shifts within the cycle.
Who This Indicator Is For
• Traders who like numerical cycle analysis
• Users of vortex math, digital-root, or harmonic structures
• People who want a non-lagging sentiment oscillator
• Anyone blending TA + number theory for timing large moves

Average Directional Index with middle line 25I interpret the ADX as indicating weakness in the current price when the value is below 25, and strength when it is above 25.
This line at 25 is drawn in the ADX chart. Its color and value can be customized in the Trading View box.

MYPYBITE.com – Oscillators PackWe got Stoch and RSI and MARSI packed together. You can switch all on or just use the ones that meaningful to your tracking.
Thanks you for looking. I hope to update

Money Flow Matrix This comprehensive indicator is a multi-faceted momentum and volume oscillator designed to identify trend strength, potential reversals, and market confluence. It combines a volume-weighted RSI (Money Flow) with a double-smoothed momentum oscillator (Hyper Wave) to filter out noise and provide high-probability signals.
Core Components
1. Money Flow (The Columns) This is the backbone of the indicator. It calculates a normalized RSI and weights it by relative volume.
Green Columns: Positive money flow (Buying pressure).
Red Columns: Negative money flow (Selling pressure).
Neon Colors (Overflow): When the columns turn bright Neon Green or Neon Red, the Money Flow has breached the dynamic Bollinger Band thresholds. This indicates an extreme overbought or oversold condition, suggesting a potential climax in the current move.
2. Hyper Wave (The Line) This is a double-smoothed Exponential Moving Average (EMA) derived from price changes. It acts as the "signal line" for the system. It is smoother than standard RSI or MACD, reducing false signals during choppy markets.
Green Line: Momentum is increasing.
Red Line: Momentum is decreasing.
3. Confluence Zones (Background) The background color changes based on the agreement between Money Flow and Hyper Wave.
Green Background: Both Money Flow and Hyper Wave are bullish. This represents a high-probability long environment.
Red Background: Both Money Flow and Hyper Wave are bearish. This represents a high-probability short environment.
Signal Guide
The Matrix provides three tiers of signals, ranging from early warnings to confirmation entries.
1. Warning Dots (Circles) These appear when the Hyper Wave crosses specific internal levels (-30/30).
Green Dot: Early warning of a bullish rotation.
Red Dot: Early warning of a bearish rotation.
Usage: These are not immediate entry signals but warnings to tighten stop-losses or prepare for a reversal.
2. Major Crosses (Triangles) These occur when Money Flow crosses the zero line, confirmed by momentum direction.
Green Triangle Up: Major Buy Signal (Money Flow crosses above 0).
Red Triangle Down: Major Sell Signal (Money Flow crosses below 0).
Usage: These are the primary trend-following entry signals.
3. Divergences (Labels "R" and "H") The script automatically detects discrepancies between Price action and the Hyper Wave oscillator.
"R" (Regular Divergence): Indicates a potential Reversal.
Bullish R: Price makes a lower low, but Oscillator makes a higher low.
Bearish R: Price makes a higher high, but Oscillator makes a lower high.
"H" (Hidden Divergence): Indicates a potential Trend Continuation.
Bullish H: Price makes a higher low, but Oscillator makes a lower low.
Bearish H: Price makes a lower high, but Oscillator makes a higher high.
Dashboard (Confluence Meter)
Located in the bottom right of the chart, the dashboard provides a snapshot of the current candle's status. It calculates a score based on three factors:
Is Money Flow positive?
Is Hyper Wave positive?
Is Hyper Wave trending up?
Readings:
STRONG BUY: All metrics are bullish.
WEAK BUY: Mixed metrics, but leaning bullish.
NEUTRAL: Metrics are conflicting.
WEAK/STRONG SELL: Bearish equivalents of the buy signals.
Trading Strategies
Strategy A: The Trend Rider
Entry: Wait for a Green Triangle (Major Buy).
Confirmation: Ensure the Background is highlighted Green (Confluence).
Exit: Exit when the background turns off or a Red Warning Dot appears.
Strategy B: The Reversal Catch
Setup: Look for a Neon Red Column (Overflow/Oversold).
Trigger: Wait for a Green "R" Label (Regular Bullish Divergence) or a Green Warning Dot.
Confirmation: Wait for the Hyper Wave line to turn green.
Strategy C: The Pullback (Continuation)
Context: The market is in a strong trend (Green Background).
Trigger: Price pulls back, but a Green "H" Label (Hidden Bullish Divergence) appears.
Action: Enter in the direction of the original trend.
Settings Configuration
The code includes tooltips for all inputs to assist with configuration.
Money Flow Length: Adjusts the sensitivity of the volume calculation. Lower numbers are faster but noisier; higher numbers are smoother.
Threshold Multiplier: Controls the "Neon" overflow bars. Increasing this (e.g., to 2.5 or 3.0) will result in fewer, more extreme signals.
Divergence Lookback: Determines how many candles back the script looks to identify pivots. Increase this number to find larger, macro divergences.
Disclaimer
This source code and the accompanying documentation are for educational and informational purposes only. They do not constitute financial, investment, or trading advice.

DarkPool's Squeeze Momentum @author LazyBearDarkPool's Squeeze Momentum Pro is a comprehensive overhaul of the classic volatility indicator, designed for the modern trader who requires deeper market insight. While staying true to the core logic of the original TTM Squeeze, this version introduces advanced features like automatic divergence detection, dynamic moving average selection, and main-chart integration to help you time entries and exits with precision.
Credit: This script is built upon the foundational "Squeeze Momentum Indicator" originally developed by LazyBear. This version expands on that legacy with enhanced visualization, alert systems, and divergence logic.
Key Features
1. Advanced Divergence Detection
The indicator automatically scans for Regular Bullish and Regular Bearish divergences between price action and momentum.
Bullish Divergence (Green "BULL" Label): Occurs when Price makes a Lower Low, but Momentum makes a Higher Low. This often precedes a bullish reversal.
Bearish Divergence (Red "BEAR" Label): Occurs when Price makes a Higher High, but Momentum makes a Lower High. This often precedes a bearish reversal.
2. Multi-Mode Squeeze Detection
The central dots on the zero line tell you the state of market volatility:
Red Dot (Squeeze ON): Volatility is compressed. The Bollinger Bands are inside the Keltner Channels. The market is "coiling" and preparing for an explosive move. Do not trade yet—wait for the fire.
Grey Dot (Squeeze OFF): The squeeze has "fired." Volatility is expanding, and price is moving.
Blue Dot (Wide Bands): Volatility is extremely high. The bands are exceptionally wide, often indicating the end of a trend or a period of high risk.
3. "Ghost" Histogram & Visual Depth
The momentum histogram features a "Ghost" fill (transparent background) to help visualize the volume of momentum without cluttering the screen.
Bright Green: Strong Bullish Momentum (Rising).
Dark Green: Weakening Bullish Momentum (Fading).
Bright Red: Strong Bearish Momentum (Falling).
Dark Red: Weakening Bearish Momentum (Recovering).
4. Dynamic Candle Coloring
Enabled by default, this feature colors the candles on your main chart to match the momentum histogram. This allows you to instantly gauge the trend strength without looking down at the oscillator pane.
5. Adaptive Calculation Engines
Unlike standard versions fixed to SMA, you can now select the moving average algorithm that drives the Bollinger Bands and Keltner Channels:
SMA: Standard, stable signals.
EMA: More reactive to recent price action.
WMA/RMA: Weighted options for specific strategies.
🛠 How to Operate
The "Squeeze & Fire" Strategy
Identify the Squeeze: Look for a series of Red Dots on the zero line. This indicates the market is resting and building energy.
The Trigger: Wait for the dot to turn Gray AND for the histogram to expand clearly in one direction.
Long Signal: Squeeze fires (Red -> Gray) + Histogram turns Green.
Short Signal: Squeeze fires (Red -> Gray) + Histogram turns Red.
The "Divergence Reversal" Strategy
Watch for "BULL" or "BEAR" labels appearing near the peaks or valleys of the histogram.
Confirmation: A divergence is a warning. Wait for the histogram color to change (e.g., from Bright Red to Dark Red) before entering a reversal trade.
⚙️ Settings Guide
Basis MA Type: Choose between SMA, EMA, WMA, or RMA to tune the sensitivity of the squeeze.
BB/KC Settings: Fully customizable Length and Multipliers to adapt to different assets (Crypto, Forex, or Stocks).
Pivot Lookback: Controls how strict the divergence detection is. Higher numbers = fewer, more significant signals.
Colour Main Chart Candles: Toggle this OFF if you prefer your standard candle colours.
Disclaimer
Trading involves a high level of risk and is not suitable for all investors. This indicator is a tool for technical analysis and does not constitute financial advice. Past performance is not indicative of future results. Always use proper risk management and do not trade based solely on a single indicator.

RSI adaptive zones [AdaptiveRSI]This script introduces a unified mathematical framework that auto-scales oversold/overbought and support/resistance zones for any period length. It also adds true RSI candles for spotting intrabar signals.
Built on the Logit RSI foundation, this indicator converts RSI into a statistically normalized space, allowing all RSI lengths to share the same mathematical footing.
What was once based on experience and observation is now grounded in math.
✦ ✦ ✦ ✦ ✦
💡 Example Use Cases
RSI(14): Classic overbought/oversold signals + divergence
Support in an uptrend using RSI(14)
Range breakouts using RSI(21)
Short-term pullbacks using RSI(5)
✦ ✦ ✦ ✦ ✦
THE PAST: RSI Interpretation Required Multiple Rulebooks
Over decades, RSI practitioners discovered that RSI behaves differently depending on trend and lookback length:
• In uptrends, RSI tends to hold higher support zones (40–50)
• In downtrends, RSI tends to resist below 50–60
• Short RSIs (e.g., RSI(2)) require far more extreme threshold values
• Longer RSIs cluster near the center and rarely reach 70/30
These observations were correct — but lacked a unifying mathematical explanation.
✦ ✦ ✦ ✦ ✦
THE PRESENT: One Framework Handles RSI(2) to RSI(200)
Instead of using fixed thresholds (70/30, 90/10, etc.), this indicator maps RSI into a normalized statistical space using:
• The Logit transformation to remove 0–100 scale distortion
• A universal scaling based on 2/√(n−1) scaling factor to equalize distribution shapes
As a result, RSI values become directly comparable across all lookback periods.
✦ ✦ ✦ ✦ ✦
💡 How the Adaptive Zones Are Calculated
The adaptive framework defines RSI zones as statistical regimes derived from the Logit-transformed RSI .
Each boundary corresponds to a standard deviation (σ) threshold, scaled by 2/√(n−1), making RSI distributions comparable across periods.
This structure was inspired by Nassim Nicholas Taleb’s body–shoulders–tails regime model:
Body (±0.66σ) — consolidation / equilibrium
Shoulders (±1σ to ±2.14σ) — trending region
Tails (outside of ±2.14σ) — rare, high-volatility behavior
Transitions between these regimes are defined by the derivatives of the position (CDF) function :
• ±1σ → shift from consolidation to trend
• ±√3σ → shift from trend to exhaustion
Adaptive Zone Summary
Consolidation: −0.66σ to +0.66σ
Support/Resistance: ±0.66σ to ±1σ
Uptrend/Downtrend: ±1σ to ±√3σ
Overbought/Oversold: ±√3σ to ±2.14σ
Tails: outside of ±2.14σ
✦ ✦ ✦ ✦ ✦
📌 Inverse Transformation: From σ-Space Back to RSI
A final step is required to return these statistically normalized boundaries back into the familiar 0–100 RSI scale. Because the Logit transform maps RSI into an unbounded real-number domain, the inverse operation uses the hyperbolic tangent function to compress σ-space back into the bounded RSI range.
RSI(n) = 50 + 50 · tanh(z / √(n − 1))
The result is a smooth, mathematically consistent conversion where the same statistical thresholds maintain identical meaning across all RSI lengths, while still expressing themselves as intuitive RSI values traders already understand.
✦ ✦ ✦ ✦ ✦
Key Features
Mathematically derived adaptive zones for any RSI period
Support/resistance zone identification for trend-aligned reversals
Optional OHLC RSI bars/candles for intrabar zone interactions
Fully customizable zone visibility and colors
Statistically consistent interpretation across all markets and timeframes
Inputs
RSI Length — core parameter controlling zone scaling
RSI Display : Line / Bar / Candle visualization modes
✦ ✦ ✦ ✦ ✦
💡 How to Use
This indicator is a framework , not a binary signal generator.
Start by defining the question you want answered, e.g.:
• Where is the breakout?
• Is price overextended or still trending?
• Is the correction ending, or is trend reversing?
Then:
Choose the RSI length that matches your timeframe
Observe which adaptive zone price is interacting with
Interpret market behavior accordingly
Example: Long-Term Trend Assesment using RSI(200)
A trader may ask: "Is this a long term top?"
Unlikely, because RSI(200) holds above Resistance zone , therefore the trend remains strong.
✦ ✦ ✦ ✦ ✦
👉 Practical tip:
If you used to overlay weekly RSI(14) on a daily chart (getting a line that waits 5 sessions to recalculate), you can now read the same long-horizon state continuously : set RSI(70) on the daily chart (~14 weeks × 5 days/week = 70 days) and let the adaptive zones update every bar .
Note: It won’t be numerically identical to the weekly RSI due to lookback period used, but it tracks the same regime on a standardized scale with bar-by-bar updates.
✦ ✦ ✦ ✦ ✦
Note: This framework describes statistical structure, not prediction. Use as part of a complete trading approach. Past behavior does not guarantee future outcomes.
framework ≠ guaranteed signal
---
Attribution & License
This indicator incorporates:
• Logit transformation of RSI
• Variance scaling using 2/√(n−1)
• Zone placement derived from Taleb’s body–shoulders–tails regime model and CDF derivatives
• Inverse TANH(z) transform for mapping z-scores back into bounded RSI space
Released under CC BY-NC-SA 4.0 — free for non-commercial use with credit.
© AdaptiveRSI

Divergence Scanner
Scanner and Indication (Divergence Scanner & Signal)An advanced experimental indicator designed to detect instances of Divergence between price action and key oscillator metrics (e.g., RSI or MACD).The primary function of this script is for Screener use. It plots a numerical value (a value greater than zero) on the chart when a confirmed bullish or bearish divergence signal appears."

DarkPool's RSi DarkPool's RSi is an enhanced momentum oscillator designed to automatically detect structural discrepancies between price action and the Relative Strength Index. While retaining the standard RSI visualization, this script overlays advanced divergence recognition logic to identify potential trend reversals.
The tool identifies pivot points in real-time and compares recent peaks and valleys against historical data. When the momentum of the RSI contradicts the direction of price action, the indicator highlights these events using dynamic trendlines, shape markers, and background coloring. A built-in dashboard table provides an immediate status check of active divergence signals.
Key Features
Automated Divergence Detection: Automatically spots both Regular Bullish and Regular Bearish divergences based on pivot lookback settings.
Dynamic Visuals: Draws physical lines connecting RSI peaks or troughs to visualize the divergence angle, alongside triangle markers indicating the signal direction.
Active Status Dashboard: A data table located on the chart monitors the current state of the market, flagging signals as "Active" when detected.
Standard RSI Overlay: Includes standard Overbought (70) and Oversold (30) reference lines for traditional momentum trading.
How to Use
1. Reading the Standard RSI The black line represents the Relative Strength Index.
Overbought (Above 70): Suggests the asset may be overvalued and due for a pullback.
Oversold (Below 30): Suggests the asset may be undervalued and due for a bounce.
Midline (50): Acts as a trend filter; values above 50 indicate bullish momentum, while values below 50 indicate bearish momentum.
2. Trading Divergences The primary function of this tool is to identify reversal setups.
Bullish Divergence (Green Triangle/Line): Occurs when Price makes a Lower Low, but the RSI makes a Higher Low. This indicates that selling momentum is exhausting and a price increase may follow.
Bearish Divergence (Red Triangle/Line): Occurs when Price makes a Higher High, but the RSI makes a Lower High. This indicates that buying momentum is fading and a price decrease may follow.
3. Visual Aids
Lines: The script draws solid lines directly on the RSI pane connecting the relevant pivot points to confirm the divergence slope.
Background Color: When a divergence is detected, the background of the indicator pane will highlight briefly (Green for Bullish, Red for Bearish) to draw attention to the new signal.
4. The Dashboard A small table in the bottom right corner tracks the status of the signals.
Status: ACTIVE: A divergence has been detected within the last 10 bars.
Status: None: No recent divergence patterns have been identified.
Disclaimer This indicator is provided for educational and informational purposes only. It does not constitute financial advice, investment recommendations, or a guarantee of future results. Trading cryptocurrencies and financial markets involves a high level of risk. Always perform your own due diligence before making any trading decisions.

Retracement Strategy [OmegaTools]Retracement Strategy is a systematic trend–retracement framework designed to identify directional opportunities after a confirmed momentum shift, and to manage exits using either trend reversals or overextension conditions. It is built around a smoothed RSI regime filter and a simple, price-based retracement trigger, making it applicable across a wide range of markets and timeframes while remaining transparent and easy to interpret.
The strategy begins by defining the underlying trend through a two-stage RSI signal. A standard RSI is computed over the user-defined Length input, then smoothed with a short moving average to reduce noise. Two symmetric thresholds are derived from the Threshold parameter: an upper band at 100 minus the threshold and a lower band at the threshold itself. When the smoothed RSI crosses above the upper band, the environment is classified as bullish and the internal trend state is set to uptrend. When the smoothed RSI crosses below the lower band, the environment is classified as bearish and the trend state becomes downtrend. When RSI moves back into the central zone between the two bands, the trend is considered neutral. In addition to the current trend, the strategy tracks the last non-neutral trend direction, which is used to detect genuine trend changes rather than transient oscillations.
Once a trend is established, the strategy looks for retracement entries in the direction of that trend. For long setups in an uptrend, it computes the lowest low over the previous Length minus one bars, excluding the current bar. A long signal is generated when price dips below this recent low while the trend state remains bullish. Symmetrically, for short setups in a downtrend, it computes the highest high over the previous Length minus one bars and enters short when price spikes above this recent high while the trend state remains bearish. This logic is designed to capture pullbacks against the prevailing RSI-defined trend, entering when the market tests or slightly violates recent extremes, rather than chasing breakouts. The candles are visually coloured to reflect the detected trend, highlighting bullish and bearish environments while keeping neutral phases distinguishable on the chart. An ATR-based measure is used solely to position the “UP” and “DN” labels on the chart for clearer visualisation of entry points; it does not directly influence position sizing or stop calculation in this implementation.
Take profit and stop loss behaviour are fully parameterized through the “Take Profit” and “Stop Loss” inputs, each offering three modes: None, Trend Change and Extension. When “Trend Change” is selected for the take profit, the strategy will only exit profitable positions when a confirmed trend reversal occurs. For a long position, this means that the strategy will close the trade when the trend state flips from uptrend to downtrend, and the last recorded trend direction validates that this is a genuine reversal rather than a neutral fluctuation; the same logic applies symmetrically for short positions. When “Extension” is selected as the take profit mode, the strategy closes profitable long trades when the smoothed RSI reaches or exceeds the upper threshold, interpreted as an overbought extension within the bullish regime, and closes profitable short trades when the smoothed RSI falls to or below the lower threshold, interpreted as an oversold extension within the bearish regime. When “None” is chosen, the strategy does not apply any explicit take profit logic, leaving trades to be managed by the stop loss settings or by user discretion in backtesting.
The stop loss parameter works in a parallel way. With “Trend Change” selected as stop loss, any open long position is closed when the trend flips from uptrend to downtrend, regardless of whether the trade is currently in profit or loss, and any open short is closed when the trend flips from downtrend to uptrend. This turns the RSI trend regime into a hard invalidation rule: once the underlying momentum structure reverses, the position is exited. With “Extension” selected for stop loss, long positions are closed when RSI falls back below the upper band and moves towards the opposite side of the range, while short positions are closed when RSI rises above the lower band and moves towards the upper side. In practice, this acts as a dynamic exit based on the oscillator moving out of a favourable context for the existing trade. Selecting “None” for stop loss disables these automatic exits, leaving only the take profit logic, if any, to manage the position. Because take profit and stop loss configuration are independent, the user can construct different profiles, such as pure trend-change exits on both sides, pure overextension exits, or a mix (for example, take profit on overextension and stop loss on trend reversal).
This strategy is designed as an analytical and backtesting framework rather than a finished plug-and-play trading system. It does not include position sizing, risk-per-trade controls, multi-timeframe confirmation, volatility filters or instrument-specific fine-tuning. Its primary purpose is to provide a clear, rule-based structure for testing retracement logic within RSI-defined trends, and to allow users to explore how different exit regimes (trend-change based versus extension based) affect performance on their instruments and timeframes of interest.
Nothing in this script or its description should be interpreted as financial advice, investment recommendation or solicitation to buy or sell any financial instrument. Past performance on backtests does not guarantee future results. The behaviour of this strategy can vary significantly across symbols, timeframes and market conditions, and correlations, volatility and liquidity can change without warning. Before considering any live application, users should thoroughly backtest and forward test the strategy on their own data, adjust parameters to their risk profile and instrument characteristics, and integrate proper money management and trade management rules. Use of this script is entirely at the user’s own risk.

50 & 200 SMA + RSI Average Strategy (Long Only, Single Trade)It works better in trending markets. It delivers its best performance in the 4-hour to 1-day timeframes.

Sk M Sir JiSimple indicator that plots three alma moving averages and provides bgcolor based on below conditions
Red => If RSI (length 14) is below 50 or low is below the lower Bollinger band (length 20)
Green => If RSI (length 14) is above 50 or high is above the upper Bollinger band (length 20)

Fat Tony Composite Histogram Dual SettingsThis is an adaptation of Rob Booker's Fat Tony Composite Histogram which allows you to put two levels for signals.

UM Nadaraya-Watson OscillatorDescription
This is a different take on the Nadaraya-Watson Estimator from both Jdhorty and LuxAlgo. Both great scripts, I encourage everyone to check them out. Think of this script as a measure of trend direction, direction change, and trend acceleration or deceleration. It is not a Moving Average, but you could think of it as loosely as an intelligent adaptive regression curve with the focus on trend direction. The Gaussian calculations prefer and add more weight to the most recent bars. The end result is the oscillator is more responsive with less lag and less prone to pure price noise.
How it Works
The indicator was added to the chart twice; once with an MA, once without. The oscillator indicates trend change by crossing up through the zero line or down through the zero line. Once the indicator turns positive, we are in a positive trend until it crosses below zero and then the trend turns negative. I implemented a Moving Average overlay for additional signal determination; if the configured MA (EMA, SMA, WMA, or Nadaraya-Watson Estimator) trends higher, it is green. When trending down, it is red. The indicator also changes the color of the price bars; when the indicator below zero and red, the price bars are red. When the indicator is above zero and green, the price bars are green.
I marked up the chart and indicator to identify LONG, SHORT, and divergences between price and oscillator.
Default Settings
The default settings are 16 for Bandwidth and a WMA with 110. This is shown in the chart example. There directional arrows, but they are off by default. The Price bars are colored green or red to match the oscillator and the bar coloring is on by default.
All settings are user-configurable including bandwidth, MA type, MA length, bar coloring, and arrows.
Suggested Settings and uses
I personally like the 30 min chart with a bandwidth of 16 and a WMA of 110. The bandwidth 8 and 8 period EMA or WMA also work well on 6 hour and daily charts. Add this to your chart arsenal and use your favorite indicators for confirmation. This indicator works well on the 30 minute chart for inverse ETFs as well (SQQQ, SOXS, TZA). Also, the oscillator is good for identifying divergences between price and and indicator. (see chart for illustration)
Experiment with settings and adapt them to your trading style.
Alerts
If you right click the indicator, and select add alert, I have configured 4 standard alerts: A bullish cross above zero, A bearish cross below zero, An MA bullish turned up to trend higher, (green), and an MA bearish turned down to trend lower (red).
