AI Intraday Astra by Pooja v27📘 AI Intraday Astra v27
Invite-Only Intraday Indicator for Option Traders
🔍 What this indicator does (Purpose)
AI Intraday Astra v27 is a rule-based intraday signal-filtering indicator designed to reduce false breakouts, repeated entries, and low-energy trades commonly faced by option traders.
Unlike traditional indicators that generate frequent signals, this script focuses on signal validation and rejection, producing trades only when multiple market conditions align on the same confirmed candle.
⭐ What makes this indicator ORIGINAL
This script is not a simple combination of indicators.
It uses a state-based decision architecture, where signals are allowed only after passing multiple sequential checks and internal reset rules.
Key originality points:
Independent BUY and SELL engines (no shared oscillator state)
State tracking to control signal eligibility
Reset-based logic after every signal
Multi-layer filtering instead of single-condition triggers
This design differentiates it from standard RSI, EMA, or Supertrend-based scripts.
⚙️ Core Features (Explained Clearly)
🔹 Auto BUY / SELL Signals (Confirmed Only)
Signals trigger only after candle close and only when all filters align.
No intrabar repainting or blinking signals.
🔹 Dual RSI Engine (Buy & Sell Separation)
Separate RSI + RSI-MA logic for Buy and Sell
Minimum RSI-MA distance filter
Directional slope validation
Signal gap control
➡️ Prevents mixed or weak momentum signals.
🔹 ADX + ATR Volatility Filter
ADX confirms directional strength
ATR confirms sufficient intraday volatility
➡️ Blocks signals during sideways or low-energy markets.
🔹 EMA + VWAP Trend Alignment
BUY only above EMA & VWAP
SELL only below EMA & VWAP
➡️ Avoids counter-trend option entries.
🔹 Trendline-Based Structure Filter
Dynamic trendlines derived from swing highs/lows
Optional slope modes (ATR / Stdev / Linear Regression)
Signals allowed only near relevant structure
➡️ Prevents chasing overextended prices.
🔹 Pivot Points (Support & Resistance Context)
Traditional pivot levels
Multi-timeframe calculation
Optional price labels
➡️ Used for context, not direct signal generation.
🔹 Reset & Anti-Overtrading Logic
After a signal:
Price must break and re-accept across EMA
Minimum bars enforced between same-side signals
➡️ Controls over-trading in strong trends.
🔹 Session Filter
Optional disabling of signals during selected intraday time windows
(e.g. noisy market open).
🧠 About “AI”
This script does not use machine learning or prediction models.
“AI” refers to a rule-based decision system that evaluates multiple market conditions together and allows a signal only when all rules remain valid until candle close.
🔔 Alerts
BUY / SELL alerts on confirmed signals only
Webhook-compatible
No repaint behavior
👤 Who this is for
Intraday option traders
Traders who prefer quality over quantity
Rule-based and confirmation-driven setups
🔒 Why Invite-Only
The script contains internal state management, reset logic, and independent signal engines that go beyond standard indicator combinations.
Source access is restricted to protect this implementation.
⚠️ Disclaimer
This indicator is for educational and analytical purposes only.
It does not provide financial advice or profit guarantees.
Users are responsible for their own risk management.
Optionselling

Straddle Charts - Live
Description :
This indicator is designed to display live prices for both call and put options of a straddle strategy, helping traders visualize the real-time performance of their options positions. The indicator allows users to select the symbols for specific call and put options and fetches their prices on a 1-minute timeframe, ensuring updated information.
Key Features :
Live Call and Put Option Prices: View individual prices for both call and put options of the straddle, plotted separately.
Straddle Price Calculation: The total price of the straddle (sum of call and put) is displayed, allowing for easy monitoring of the straddle’s combined movement.
Customizable Inputs: Easily change the call and put option symbols directly from the settings.
Use this indicator to stay on top of your straddle's value and make informed trading decisions based on real-time data.

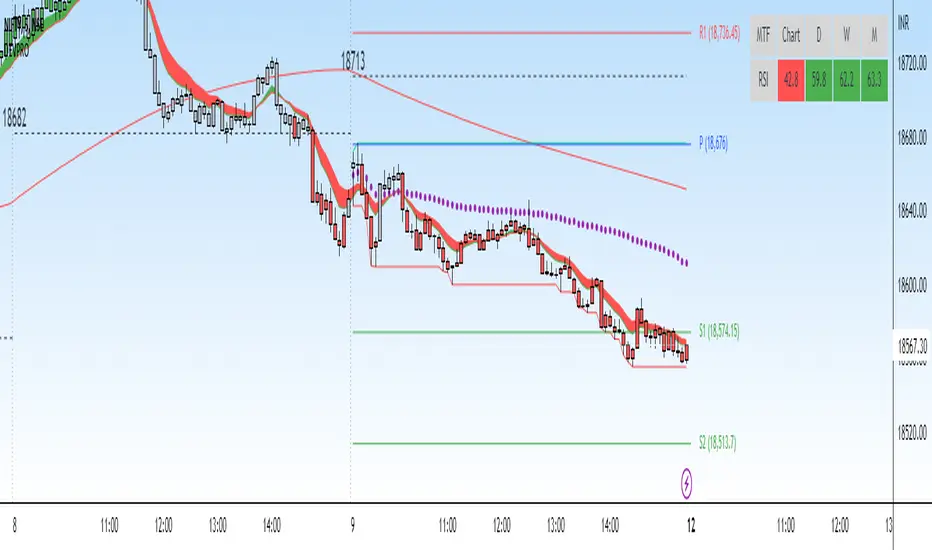
DEVPRO TradingDEVPRO Trading system comprises of the following:
D - Double (EMA and VWAP)
E - EMA
V - VWAP (current and previous day ending VWAP level)
P - Standard Pivot Point
R - RSI (Multi-time frame table is added at the top and traders can add standard RSI 14 as an additional non-overlay indicator)
O - OI data (not available for options trading in TV but trader can always check in their broker terminal)
Double EMA have been color coded in red and green for bullish and bearish trends.
Candles are colored for bullish (green), sideways (grey) and bearish (red) phases.
Setup to be traded with monthly options for stocks and weekly options for indices.
Bullish Setup:
RSI greater than 50
Current candle close above VWAP and previous day closing VWAP
Current candle close above daily Pivot
For option buying (Call option OI should be falling below its moving average 20 meaning short covering)
For option selling (Put option OI should be rising above its moving average 20 meaning Put writers confidence is increasing)
Book partial qty profits at R1/R2/R3 and/or exit completely on Doji candle low break
Bearish Setup:
RSI less than 50
Current candle close below VWAP and previous day closing VWAP
Current candle close below daily Pivot
For option buying (Put option OI should be falling below its moving average 20 meaning short covering)
For option selling (Call option OI should be rising above its moving average 20 meaning Call writers confidence is increasing)
Book partial qty profits at S1/S2/S3 and/or exit completely on Doji candle high break
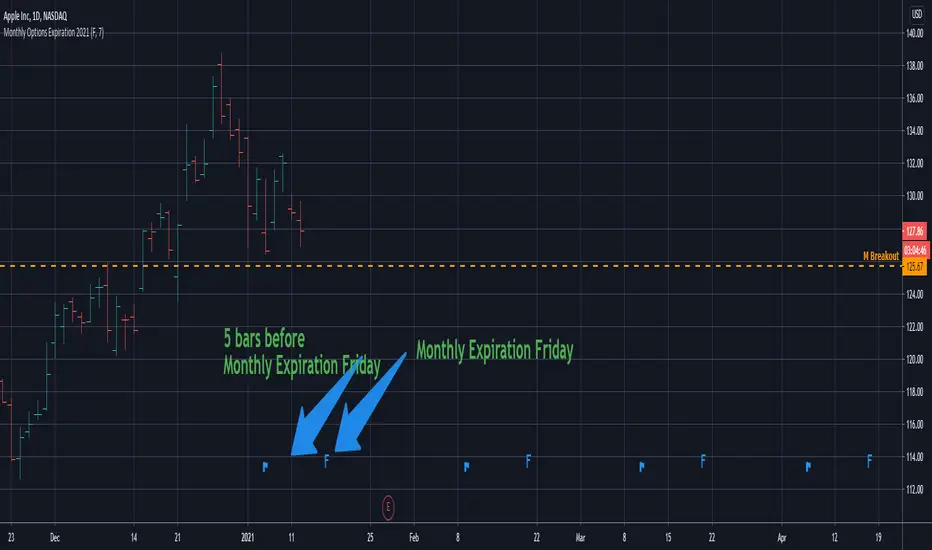
Monthly Options Expiration 2021Monthly options expiration for the year 2021.
Also you can set a flag X no. of days before the expiration date. I use it at as marker to take off existing positions in expiration week or roll to next expiration date or to place new trades.
Happy new year 2021 in advance and all the best traders.
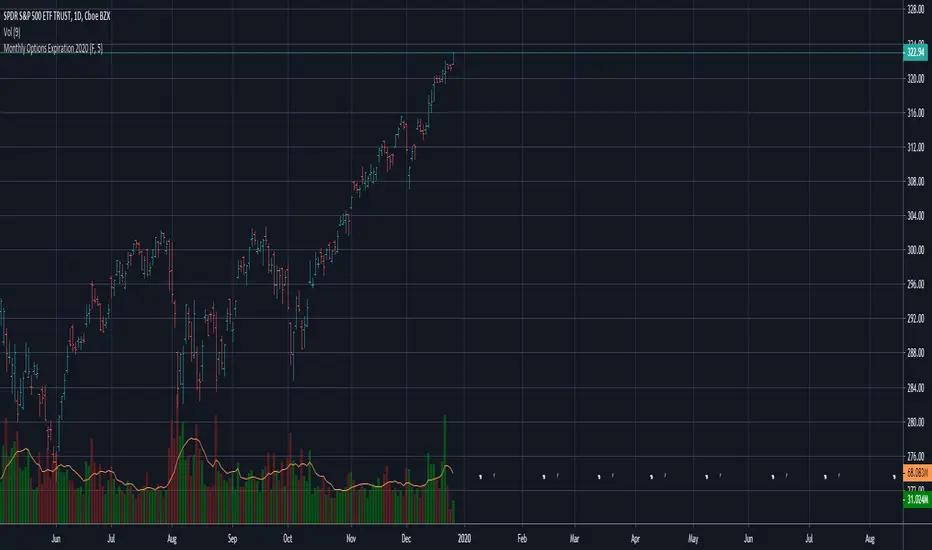
Monthly Options Expiration 2020Monthly options expiration for the year 2020.
Also you can set a flag X no. of days before the expiration date. I use it at as marker to take off existing positions in expiration week or roll to next expiration date or to place new trades.
Happy new year 2020 and all the best traders.