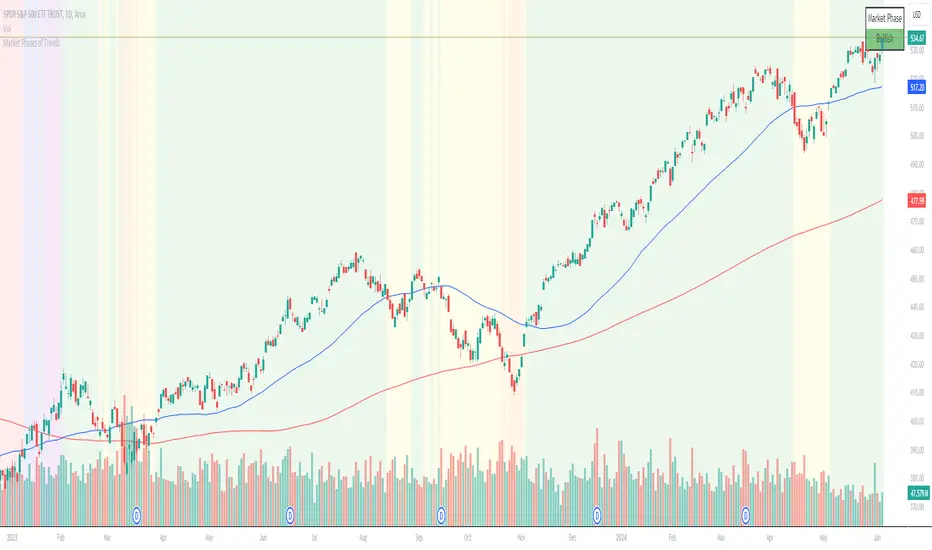
Chuck Dukas Market Phases of Trends (based on 2 Moving Averages)This script is based on the article “Defining The Bull And The Bear” by Chuck Duckas, published in Stocks & Commodities V. 25:13 (14-22); (S&C Bonus Issue, 2007).
The article “Defining The Bull And The Bear” discusses the concepts of “bullish” and “bearish” in relation to the price behavior of financial instruments. Chuck Dukas explains the importance of analyzing price trends and provides a framework for categorizing price activity into six phases. These phases, including recovery, accumulation, bullish, warning, distribution, and bearish, help to assess the quality of the price structure and guide decision-making in trading. Moving averages are used as tools for determining the context preceding the current price action, and the slope of a moving average is seen as an indicator of trend and price phase analysis.
The six phases of trends
// Definitions of Market Phases
recovery_phase = src > ma050 and src < ma200 and ma050 < ma200 // color: blue
accumulation_phase = src > ma050 and src > ma200 and ma050 < ma200 // color: purple
bullish_phase = src > ma050 and src > ma200 and ma050 > ma200 // color: green
warning_phase = src < ma050 and src > ma200 and ma050 > ma200 // color: yellow
distribution_phase = src < ma050 and src < ma200 and ma050 > ma200 // color: orange
bearish_phase = src < ma050 and src < ma200 and ma050 < ma200 // color red
Recovery Phase : This phase marks the beginning of a new trend after a period of consolidation or downtrend. It is characterized by the gradual increase in prices as the market starts to recover from previous losses.
Accumulation Phase : In this phase, the market continues to build a base as prices stabilize before making a significant move. It is a period of consolidation where buying and selling are balanced.
Bullish Phase : The bullish phase indicates a strong upward trend in prices with higher highs and higher lows. It is a period of optimism and positive sentiment in the market.
Warning Phase : This phase occurs when the bullish trend starts to show signs of weakness or exhaustion. It serves as a cautionary signal to traders and investors that a potential reversal or correction may be imminent.
Distribution Phase : The distribution phase is characterized by the market topping out as selling pressure increases. It is a period where supply exceeds demand, leading to a potential shift in trend direction.
Bearish Phase : The bearish phase signifies a strong downward trend in prices with lower lows and lower highs. It is a period of pessimism and negative sentiment in the market.
These rules of the six phases outline the cyclical nature of market trends and provide traders with a framework for understanding and analyzing price behavior to make informed trading decisions based on the current market phase.
60-period channel
The 60-period channel should be applied differently in each phase of the market cycle.
Recovery Phase : In this phase, the 60-period channel can help identify the beginning of a potential uptrend as price stabilizes or improves. Traders can look for new highs frequently in the 60-period channel to confirm the trend initiation or continuation.
Accumulation Phase : During the accumulation phase, the 60-period channel can highlight that the current price is sufficiently strong to be above recent price and longer-term price. Traders may observe new highs frequently in the 60-period channel as the slope of the 50-period moving average (SMA) trends upwards while the 200-period moving average (SMA) slope is losing its downward slope.
Bullish Phase : In the bullish phase, the 60-period channel showing a series of higher highs is crucial for confirming the uptrend. Additionally, traders should observe an upward-sloping 50-period SMA above an upward-sloping 200-period SMA for further validation of the bullish phase.
Warning Phase : When in the warning phase, the 60-period channel can provide insights into whether the current price is weaker than recent prices. Traders should pay attention to the relationship between the price close, the 50-period SMA, and the 200-period SMA to gauge the strength of the phase.
Distribution Phase : In the distribution phase, traders should look for new lows frequently in the 60-period channel, hinting at a weakening trend. It is crucial to observe that the 50-period SMA is still above the 200-period SMA in this phase.
Bearish Phase : Lastly, in the bearish phase, the 60-period channel reflecting a series of lower lows confirms the downtrend. Traders should also note that the price close is below both the 50-period SMA and the 200-period SMA, with the relationship of the 50-period SMA being less than the 200-period SMA.
By carefully analyzing the 60-period channel in each phase, traders can better understand market trends and make informed decisions regarding their investments.
Moving_average
Volume-Enhanced Momentum Moving Average (VEMMA)Volume-Enhanced Momentum Moving Average (VEMMA)
Overview:
The Volume-Enhanced Momentum Moving Average (VEMMA) helps you spot market trends by combining momentum and volume as a moving average. This unique moving average adjusts itself based on the strength and activity of the market, giving you a clearer picture of what’s happening.
How It Works:
1. Key Settings (all of these are adjustable in the settings panel of the indicator):
◦ Base Length: Looks back over the last 50 days by default.
◦ Momentum Length: Uses the past 14 days to measure market strength.
◦ Volume Length: Uses the past 30 days to average trading volume.
◦ High/Low Thresholds: Considers RSI values above 70 as high momentum and below 30 as low momentum.
2. Momentum and Volume:
◦ Momentum: Calculated using the Relative Strength Index (RSI) to see if the market is gaining or losing strength.
◦ Volume: Average trading volume is calculated over the last 30 days to gauge trading activity.
3. VEMMA Calculation:
◦ For each of the past 50 days:
▪ Check Momentum: If RSI > 70, it’s high momentum; if RSI < 30, it’s low.
▪ Weight by Volume: High momentum days with high volume get more weight; low momentum days get less.
▪ Combine: Multiply the closing price by this weight and sum it up.
◦ Average: Divide the total by 50 to get the VEMMA value.
4. Visuals:
◦ Lines: Two lines, VEMMA1 (blue) and VEMMA2 (orange), show the adjusted moving averages.
◦ Colours: Background colors help you quickly spot high (green) and low (red) momentum periods.
How to Use:
• Spot Trends: Rising VEMMA lines suggest an uptrend; falling lines suggest a downtrend.
• Confirm Signals: When both VEMMA1 and VEMMA2 move together, it indicates a strong trend.
• Identify Reversals: Watch for background color changes from green to red or vice versa to catch potential trend reversals.
If the market has been strong and active, the VEMMA line will rise more sharply. If the market is weak and quiet, the line will be smoother.
Benefits:
• Integrated View: Combines market strength and trading activity for a fuller picture.
• Responsive: Adapts to significant market changes, highlighting key movements.
• Easy to Read: Clear visuals with color-coded backgrounds make interpretation simple.
Remember, just like any other indicator, this is not supposed to be used alone. Use it as part of your greater trading strategy. I do however believe it works exceptionally well for finding longer term trends early. The default VEMMA settings work very well as replacement for the EMA 200. Try it and see how it goes. Play around with the settings. Feedback appreciated.

Wall Street Cheat Sheet IndicatorThe Wall Street Cheat Sheet Indicator is a unique tool designed to help traders identify the psychological stages of the market cycle based on the well-known Wall Street Cheat Sheet. This indicator integrates moving averages and RSI to dynamically label market stages, providing clear visual cues on the chart.
Key Features:
Dynamic Stage Identification: The indicator automatically detects and labels market stages such as Disbelief, Hope, Optimism, Belief, Thrill, Euphoria, Complacency, Anxiety, Denial, Panic, Capitulation, Anger, and Depression. These stages are derived from the emotional phases of market participants, helping traders anticipate market movements.
Technical Indicators: The script uses two key technical indicators:
200-day Simple Moving Average (SMA): Helps identify long-term market trends.
50-day Simple Moving Average (SMA): Aids in recognizing medium-term trends.
Relative Strength Index (RSI): Assesses the momentum and potential reversal points based on overbought and oversold conditions.
Clear Visual Labels: The current market stage is displayed directly on the chart, making it easy to spot trends and potential turning points.
Usefulness:
This indicator is not just a simple mashup of existing tools. It uniquely combines the concept of market psychology with practical technical analysis tools (moving averages and RSI). By labeling the psychological stages of the market cycle, it provides traders with a deeper understanding of market sentiment and potential future movements.
How It Works:
Disbelief: Detected when the price is below the 200-day SMA and RSI is in the oversold territory, indicating a potential bottom.
Hope: Triggered when the price crosses above the 50-day SMA, with RSI starting to rise but still below 50, suggesting an early uptrend.
Optimism: Occurs when the price is above the 50-day SMA and RSI is between 50 and 70, indicating a strengthening trend.
Belief: When the price is well above the 50-day SMA and RSI is between 70 and 80, showing strong bullish momentum.
Thrill and Euphoria: Identified when RSI exceeds 80, indicating overbought conditions and potential for a peak.
Complacency to Depression: These stages are identified based on price corrections and drops relative to moving averages and declining RSI values.
Best Practices:
High-Time Frame Focus: This indicator works best on high-time frame charts, specifically the 1-week Bitcoin (BTCUSDT) chart. The longer time frame provides a clearer picture of the overall market cycle and reduces noise.
Trend Confirmation: Use in conjunction with other technical analysis tools such as trendlines, Fibonacci retracement levels, and support/resistance zones for more robust trading strategies.
How to Use:
Add the Indicator: Apply the Wall Street Cheat Sheet Indicator to your TradingView chart.
Analyze Market Stages: Observe the dynamic labels indicating the current stage of the market cycle.
Make Informed Decisions: Use the insights from the indicator to time your entries and exits, aligning your trades with the market sentiment.
This indicator is a valuable tool for traders looking to understand market psychology and make informed trading decisions based on the stages of the market cycle.

Global Financial IndexIntroducing the "Global Financial Index" indicator on TradingView, a meticulously crafted tool derived from extensive research aimed at providing the most comprehensive assessment of a company's financial health, profitability, and valuation. Developed with the discerning trader and investor in mind, this indicator amalgamates a diverse array of financial metrics, meticulously weighted and balanced to yield optimal results.
Financial Strength:
Financial strength is a cornerstone of a company's stability and resilience in the face of economic challenges. It encompasses various metrics that gauge the company's ability to meet its financial obligations, manage its debt, and generate sustainable profits. In our Global Financial Index indicator, the evaluation of financial strength is meticulously crafted to provide investors with a comprehensive understanding of a company's fiscal robustness. Let's delve into the key components and the rationale behind their inclusion:
1. Current Ratio:
The Current Ratio serves as a vital indicator of a company's liquidity position by comparing its current assets to its current liabilities.
A ratio greater than 1 indicates that the company possesses more short-term assets than liabilities, suggesting a healthy liquidity position and the ability to meet short-term obligations promptly.
By including the Current Ratio in our evaluation, we emphasize the importance of liquidity management in sustaining business operations and weathering financial storms.
2. Debt to Equity Ratio:
The Debt to Equity Ratio measures the proportion of a company's debt relative to its equity, reflecting its reliance on debt financing versus equity financing.
A higher ratio signifies higher financial risk due to increased debt burden, potentially leading to liquidity constraints and solvency issues.
Incorporating the Debt to Equity Ratio underscores the significance of balancing debt levels to maintain financial stability and mitigate risk exposure.
3. Interest Coverage Ratio:
The Interest Coverage Ratio assesses a company's ability to service its interest payments with its operating income.
A higher ratio indicates a healthier financial position, as it implies that the company generates sufficient earnings to cover its interest expenses comfortably.
By evaluating the Interest Coverage Ratio, we gauge the company's capacity to manage its debt obligations without compromising its profitability or sustainability.
4. Altman Z-Score:
The Altman Z-Score, developed by Edward Altman, is a composite metric that predicts the likelihood of a company facing financial distress or bankruptcy within a specific timeframe.
It considers multiple financial ratios, including liquidity, profitability, leverage, and solvency, to provide a comprehensive assessment of a company's financial health.
The Altman Z-Score categorizes companies into distinct risk groups, allowing investors to identify potential warning signs and make informed decisions regarding investment or credit exposure.
By integrating the Altman Z-Score, we offer a nuanced perspective on a company's financial viability and resilience in turbulent market conditions.
Profitability Rank:
Profitability rank is a crucial aspect of investment analysis that evaluates a company's ability to generate profits relative to its peers and industry benchmarks. It involves assessing various profitability metrics to gauge the efficiency and effectiveness of a company's operations and management. In our Global Financial Index indicator, the profitability rank segment is meticulously designed to provide investors with a comprehensive understanding of a company's profitability dynamics. Let's delve into the key components and rationale behind their inclusion:
1. Return on Equity (ROE):
Return on Equity measures a company's net income generated relative to its shareholders' equity.
A higher ROE indicates that a company is generating more profits with its shareholders' investment, reflecting efficient capital utilization and strong profitability.
By incorporating ROE, we assess management's ability to generate returns for shareholders and evaluate the overall profitability of the company's operations.
2. Gross Profit Margin:
Gross Profit Margin represents the percentage of revenue retained by a company after accounting for the cost of goods sold (COGS).
A higher gross profit margin indicates that a company is effectively managing its production costs and pricing strategies, leading to greater profitability.
By analyzing gross profit margin, we evaluate a company's pricing power, cost efficiency, and competitive positioning within its industry.
3. Operating Profit Margin:
Operating Profit Margin measures the percentage of revenue that remains after deducting operating expenses, such as salaries, rent, and utilities.
A higher operating profit margin signifies that a company is efficiently managing its operating costs and generating more profit from its core business activities.
By considering operating profit margin, we assess the underlying profitability of a company's operations and its ability to generate sustainable earnings.
4. Net Profit Margin:
Net Profit Margin measures the percentage of revenue that remains as net income after deducting all expenses, including taxes and interest.
A higher net profit margin indicates that a company is effectively managing its expenses and generating greater bottom-line profitability.
By analyzing net profit margin, we evaluate the overall profitability and financial health of a company, taking into account all expenses and income streams.
Valuation Rank:
Valuation rank is a fundamental aspect of investment analysis that assesses the attractiveness of a company's stock price relative to its intrinsic value. It involves evaluating various valuation metrics to determine whether a stock is undervalued, overvalued, or fairly valued compared to its peers and the broader market. In our Global Financial Index indicator, the valuation rank segment is meticulously designed to provide investors with a comprehensive perspective on a company's valuation dynamics. Let's explore the key components and rationale behind their inclusion:
1. Price-to-Earnings (P/E) Ratio:
The Price-to-Earnings ratio is a widely used valuation metric that compares a company's current stock price to its earnings per share (EPS).
A lower P/E ratio may indicate that the stock is undervalued relative to its earnings potential, while a higher ratio may suggest overvaluation.
By incorporating the P/E ratio, we offer insight into market sentiment and investor expectations regarding a company's future earnings growth prospects.
2. Price-to-Book (P/B) Ratio:
The Price-to-Book ratio evaluates a company's market value relative to its book value, which represents its net asset value per share.
A P/B ratio below 1 may indicate that the stock is trading at a discount to its book value, potentially signaling an undervalued opportunity.
Conversely, a P/B ratio above 1 may suggest overvaluation, as investors are paying a premium for the company's assets.
By considering the P/B ratio, we assess the market's perception of a company's tangible asset value and its implications for investment attractiveness.
3. Dividend Yield:
Dividend Yield measures the annual dividend income received from owning a stock relative to its current market price.
A higher dividend yield may indicate that the stock is undervalued or that the company is returning a significant portion of its profits to shareholders.
Conversely, a lower dividend yield may signal overvaluation or a company's focus on reinvesting profits for growth rather than distributing them as dividends.
By analyzing dividend yield, we offer insights into a company's capital allocation strategy and its implications for shareholder returns and valuation.
4. Discounted Cash Flow (DCF) Analysis:
Discounted Cash Flow analysis estimates the present value of a company's future cash flows, taking into account the time value of money.
By discounting projected cash flows back to their present value using an appropriate discount rate, DCF analysis provides a fair value estimate for the company's stock.
Comparing the calculated fair value to the current market price allows investors to assess whether the stock is undervalued, overvalued, or fairly valued.
By integrating DCF analysis, we offer a rigorous framework for valuing stocks based on their underlying cash flow generation potential.
Earnings Transparency:
Mitigating the risk of fraudulent financial reporting is crucial for investors. The indicator incorporates the Beneish M-Score, a robust model designed to detect earnings manipulation or financial irregularities. By evaluating various financial ratios and metrics, this component provides valuable insights into the integrity and transparency of a company's financial statements, aiding investors in mitigating potential risks.
Overall Score:
The pinnacle of the "Global Financial Index" is the Overall Score, a comprehensive amalgamation of financial strength, profitability, valuation, and manipulation risk, further enhanced by the inclusion of the Piotroski F-Score. This holistic score offers investors a succinct assessment of a company's overall health and investment potential, facilitating informed decision-making.
The weighting and balancing of each metric within the indicator have been meticulously calibrated to ensure accuracy and reliability. By amalgamating these diverse metrics, the "Global Financial Index" empowers traders and investors with a powerful tool for evaluating investment opportunities with confidence and precision.
This indicator is provided for informational purposes only and does not constitute financial advice, investment advice, or any other type of advice. The information provided by this indicator should not be relied upon for making investment decisions. Trading and investing in financial markets involves risk, and you should carefully consider your financial situation and consult with a qualified financial advisor before making any investment decisions. Past performance is not necessarily indicative of future results. The creator of this indicator makes no representations or warranties of any kind, express or implied, about the completeness, accuracy, reliability, suitability, or availability with respect to the indicator or the information contained herein. Any reliance you place on such information is therefore strictly at your own risk. By using this indicator, you agree to assume full responsibility for any and all gains and losses, financial, emotional, or otherwise, experienced, suffered, or incurred by you.

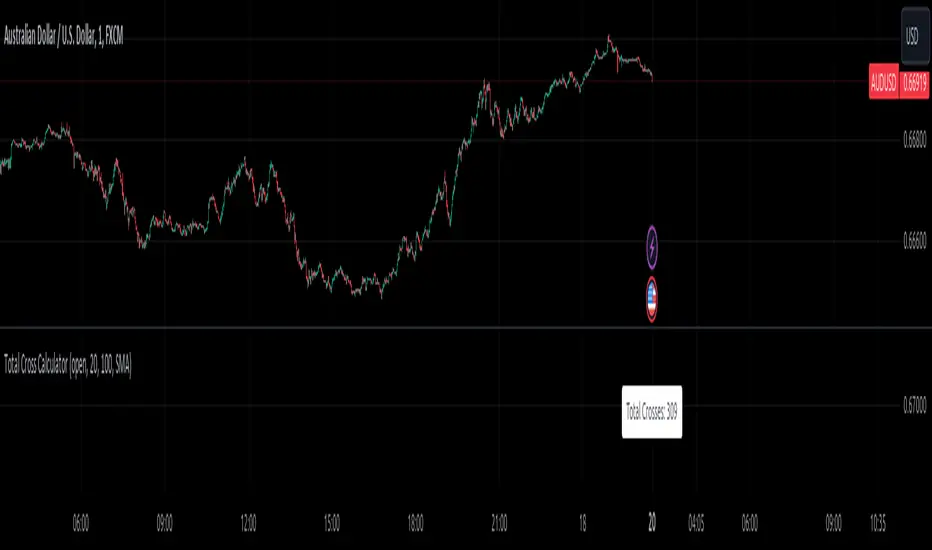
Total Cross CalculatorThe Indicator calculates the total number of the death and golden crosses in the total chart which can help the moving average user to compare the number of signals generated by the moving average pair in the given timeframe.
If Indicator is not plotting anything then right click on the indicator's scale and click on "Auto(data fits the screen)" option.
Please visit it's previous version if you want to use the indicator on the moving averages created by yourself. Link is here
Multiple MAs Signals with RSI MA Filter & Signal About the Script
The "Multiple Moving Averages Signals with RSI MA Filter and Golden Signals" script is a comprehensive trading tool designed to provide traders with detailed insights and actionable signals based on multiple moving averages and RSI (Relative Strength Index). This script combines traditional moving average crossovers with RSI filtering to enhance the accuracy of trading signals and includes "golden" signals to highlight significant long-term trend changes.
This script integrates several technical indicators and concepts to create a robust and versatile trading tool. Here's why this combination is both original and useful:
1. Multiple Moving Averages:
- Why Use Multiple MAs: Different types of moving averages (SMA, EMA, SMMA, WMA, VWMA, Hull) offer unique perspectives on price trends and volatility. Combining them allows traders to capture a more comprehensive view of the market.
- Purpose: Using multiple moving averages helps identify trend direction, support/resistance levels, and potential reversal points.
2. RSI MA Filter:
- Why Use RSI: RSI is a momentum oscillator that measures the speed and change of price movements. It is used to identify overbought or oversold conditions in a market.
- Purpose: Filtering signals with RSI moving averages ensures that trades are taken in line with the prevailing momentum, reducing the likelihood of false signals.
3. Golden Signals:
- Why Use Golden Crosses: A golden cross (50-period MA crossing above the 200-period MA) is a well-known bullish signal, while a death cross (50-period MA crossing below the 200-period MA) is bearish. These signals are widely followed by traders and institutions.
- Purpose: Highlighting these significant long-term signals helps traders identify major buy or sell opportunities and align with broader market trends.
How the Script Works
1. Moving Average Calculations:
- The script calculates multiple moving averages (MA1 to MA5) based on user-selected types (SMA, EMA, SMMA, WMA, VWMA, Hull) and periods (9, 21, 50, 100, 200).
- Golden Moving Averages: Separately calculates 50-period and 200-period moving averages for generating golden signals.
2. RSI and RSI MA Filter:
- RSI Calculation: Computes the RSI for the given period.
- RSI MA: Calculates a moving average of the RSI to smooth out the RSI values and reduce noise.
- RSI MA Filter: Traders can enable/disable RSI filtering and set custom thresholds to refine long and short signals based on RSI momentum.
3. Long & Short Signal Generation:
- Long Signal: Generated when the short-term moving average crosses above both the mid-term and long-term moving averages, and the RSI MA is below the specified threshold (if enabled).
- Short Signal: Generated when the short-term moving average crosses below both the mid-term and long-term moving averages, and the RSI MA is above the specified threshold (if enabled).
4. Golden Signals:
- Golden Long Signal: Triggered when the 50-period golden moving average crosses above the 200-period golden moving average.
- Golden Short Signal: Triggered when the 50-period golden moving average crosses below the 200-period golden moving average.
How to Use the Script
1. Customize Inputs:
- Moving Averages: Choose the type of moving averages and set the periods for up to five different moving averages.
- RSI Settings: Adjust the RSI period and its moving average period. Enable or disable RSI filtering and set custom thresholds for long and short signals.
- Signal Colors: Customize the colors for long, short, and golden signals.
- Enable/Disable Signals: Toggle the visibility of long, short, and golden signals.
2. Observe Plots and Signals:
- The script plots the selected moving averages on the chart.
- Long and short signals are marked with labels on the chart, with customizable colors for easy identification.
- Golden signals are highlighted with specific labels to indicate significant long-term trend changes.
3. Analyze and Trade:
- Use the generated signals as part of your trading strategy. The script provides visual cues to help you make informed decisions about entering or exiting trades based on multiple technical indicators.
Unique Features
1. Integration of Multiple Moving Averages: Combines various moving average types to provide a holistic view of market trends.
2. RSI MA Filtering: Enhances signal accuracy by incorporating RSI momentum, reducing the likelihood of false signals.
3. Golden Signals: Highlights significant long-term trend changes, aligning with broader market movements.
4. Customizability: Offers extensive customization options, allowing traders to tailor the script to their specific trading strategies and preferences.
feel free to comments.

Total Death and Golden Crosses Calculator The Indicator calculates the total number of the death and golden crosses in the total chart which can help the moving average user to compare the number of signals generated by the moving average pair in the given timeframe.
All you need is to plot any two moving average then change the source of the indicator to get the total number of crosses.
If Indicator is not plotting anything then right click on the indicator's scale and click on "Auto(data fits the screen" option.

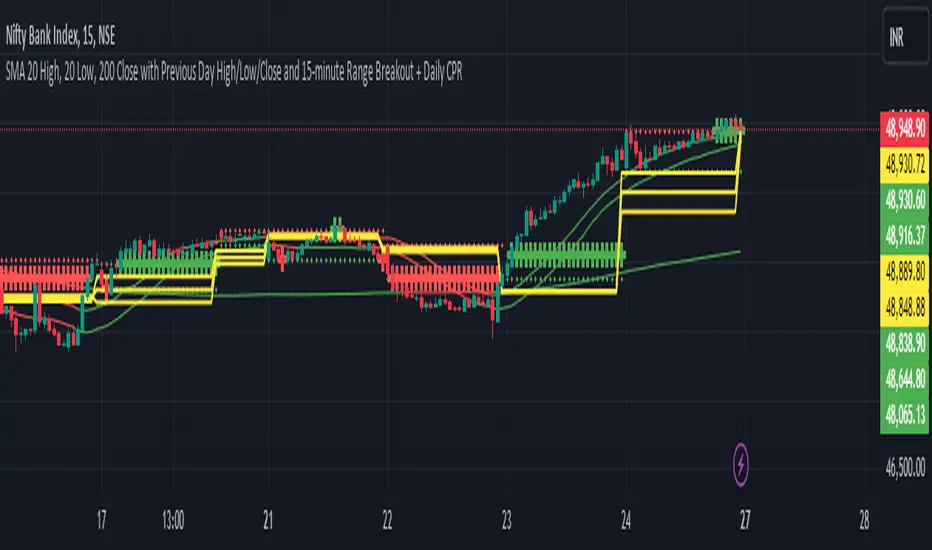
20,200SMA,PDHL,15 minute ORBSimple Moving Averages (SMAs):
The script calculates three SMAs: SMA 20 High, SMA 20 Low, and SMA 200 Close. These moving averages are widely used in technical analysis to smooth out price data and identify trends.
The SMA for the high price (SMA 20 High) is calculated based on the 20-period moving average of the high prices.
Similarly, the SMA for the low price (SMA 20 Low) is calculated based on the 20-period moving average of the low prices.
The SMA for the close price (SMA 200 Close) is calculated based on the 200-period moving average of the closing prices.
Each SMA is plotted on the chart, and their colors are determined based on whether the current close price is above or below each respective SMA.
Conditional Coloring:
The script employs conditional coloring to visually highlight whether the close price is above or below each SMA.
If the close price is below the SMA 20 High, it's plotted in red; otherwise, it's plotted in green.
Similarly, the SMA 20 Low and SMA 200 Close are plotted with conditional colors based on the relationship between the close price and each respective SMA.
Previous Day's Data:
The script retrieves and plots the high, low, and close prices of the previous trading day.
This provides traders with valuable information about the previous day's market behavior, which can influence trading decisions.
Opening 15-minute Range Breakout:
The script calculates the high and low prices during the first 15 minutes of each trading day.
These prices represent the opening range for the day.
It then determines whether the current close price is above or below this opening range and plots it accordingly.
This breakout strategy helps traders identify potential trading opportunities based on early price movements.
By integrating these components, the script offers traders a comprehensive analysis of market trends, previous day's performance, and potential breakout opportunities. Its originality lies in the combination of these features into a single, easy-to-use indicator, providing valuable insights for trading decisions.
Uptrick: MultiMA_VolumePurpose:
The "Uptrick: MultiMA_Volume" indicator, identified by its abbreviated title 'MMAV,' is meticulously designed to provide traders with a comprehensive view of market dynamics by incorporating multiple moving averages (MAs) and volume analysis. With adjustable inputs and customizable visibility options, traders can tailor the indicator to their specific trading preferences and strategies, thereby enhancing its utility and usability.
Explanation:
Input Variables and Customization:
Traders have the flexibility to adjust various parameters, including the lengths of different moving averages (SMA, EMA, WMA, HMA, and KAMA), as well as the option to show or hide each moving average and volume-related components.
Customization options empower traders to fine-tune the indicator according to their trading styles and market preferences, enhancing its adaptability across different market conditions.
Moving Averages and Trend Identification:
The script computes multiple types of moving averages, including Simple (SMA), Exponential (EMA), Weighted (WMA), Hull (HMA), and Kaufman's Adaptive (KAMA), allowing traders to assess trend directionality and strength from various perspectives.
Traders can determine potential price movements by observing the relationship between the current price and the plotted moving averages. For example, prices above the moving averages may suggest bullish sentiment, while prices below could indicate bearish sentiment.
Volume Analysis:
Volume analysis is integrated into the indicator, enabling traders to evaluate volume dynamics alongside trend analysis.
Traders can identify significant volume spikes using a customizable threshold, with bars exceeding the threshold highlighted to signify potential shifts in market activity and liquidity.
Determining Potential Price Movements:
By analyzing the relationship between price and the plotted moving averages, traders can infer potential price movements.
Bullish biases may be suggested when prices are above the moving averages, accompanied by rising volume, while bearish biases may be indicated when prices are below the moving averages, with declining volume reinforcing the potential for downward price movements.
Utility and Potential Usage:
The "Uptrick: MultiMA_Volume" indicator serves as a comprehensive tool for traders, offering insights into trend directionality, strength, and volume dynamics.
Traders can utilize the indicator to identify potential trading opportunities, confirm trend signals, and manage risk effectively.
By consolidating multiple indicators into a single chart, the indicator streamlines the analytical process, providing traders with a concise overview of market conditions and facilitating informed decision-making.
Through its customizable features and comprehensive analysis, the "Uptrick: MultiMA_Volume" indicator equips traders with actionable insights into market trends and volume dynamics. By integrating trend analysis and volume assessment into their trading strategies, traders can navigate the markets with confidence and precision, thereby enhancing their trading outcomes.

Johnny's Adjusted BB Buy/Sell Signal"Johnny's Adjusted BB Buy/Sell Signal" leverages Bollinger Bands and moving averages to provide dynamic buy and sell signals based on market conditions. This indicator is particularly useful for traders looking to identify strategic entry and exit points based on volatility and trend analysis.
How It Works
Bollinger Bands Setup: The indicator calculates Bollinger Bands using a specified length and multiplier. These bands serve to identify potential overbought (upper band) or oversold (lower band) conditions.
Moving Averages: Two moving averages are calculated — a trend moving average (trendMA) and a long-term moving average (longTermMA) — to gauge the market's direction over different time frames.
Market Phase Determination: The script classifies the market into bullish or bearish phases based on the relationship of the closing price to the long-term moving average.
Strong Buy and Sell Signals: Enhanced signals are generated based on how significantly the price deviates from the Bollinger Bands, coupled with the average candle size over a specified lookback period. The signals are adjusted based on whether the market is bullish or bearish:
In bullish markets, a strong buy signal is triggered if the price significantly drops below the lower Bollinger Band. Conversely, a strong sell signal is activated when the price rises well above the upper band.
In bearish markets, these signals are modified to be more conservative, adjusting the thresholds for triggering strong buy and sell signals.
Features:
Flexibility: Users can adjust the length of the Bollinger Bands and moving averages, as well as the multipliers and factors that determine the strength of buy and sell signals, making it highly customizable to different trading styles and market conditions.
Visual Aids: The script vividly plots the Bollinger Bands and moving averages, and signals are visually represented on the chart, allowing traders to quickly assess trading opportunities:
Regular buy and sell signals are indicated by simple shapes below or above price bars.
Strong buy and sell signals are highlighted with distinctive colors and placed prominently to catch the trader's attention.
Background Coloring: The background color changes based on the market phase, providing an immediate visual cue of the market's overall sentiment.
Usage:
This indicator is ideal for traders who rely on technical analysis to guide their trading decisions. By integrating both Bollinger Bands and moving averages, it provides a multi-faceted view of market trends and volatility, making it suitable for identifying potential reversals and continuation patterns. Traders can use this tool to enhance their understanding of market dynamics and refine their trading strategies accordingly.

Moving Average Crossover MonitorMoving Average Crossover Monitor: Gain Insight into Market Trends
The Moving Average Crossover Monitor is a specialized tool crafted for traders seeking to understand and predict market trends more effectively. This indicator's primary focus lies in analyzing consecutive candle movements above or below specified moving averages and providing predictive estimates based on historical data.
Key Features:
1. Consecutive Candle Tracking: The indicator meticulously counts and tracks the number of consecutive candles that close above or below a selected moving average (MA1). This tracking offers a tangible measure of trend persistence over time.
2. Historical Analysis for Future Prediction: By analyzing past trends, the indicator provides insights into potential future movements. It estimates the likelihood of upcoming candles continuing above or below the moving average based on historical patterns.
3. Dynamic Visualization: Moving averages (SMA, WMA, EMA) are dynamically plotted on the chart, clearly displaying crossover points and trend transitions.
How It Works:
1. Moving Average Calculation: Select your preferred moving average type (SMA, WMA, EMA) and define short and long periods. The indicator computes two moving averages (MA1 and MA2) based on these parameters.
2. Consecutive Candle Analysis:
- Above MA1: Tracks and counts consecutive candles closing above MA1, indicating potential bullish momentum.
- Below MA1: Tracks and counts consecutive candles closing below MA1, suggesting potential bearish sentiment.
3. Future Trend Prediction: Based on historical data of consecutive candle movements, the indicator estimates the likelihood of the next candle continuing in the same direction (above or below MA1).
Advantages for Traders:
1. Quantitative Insights: Use numerical data on consecutive candles to gauge trend strength and durability.
2. Predictive Analytics: Leverage historical patterns to anticipate future market movements and adjust trading strategies accordingly.
3. Decision Support Tool: Gain clarity on trend transitions, empowering timely and informed trading decisions.
Disclaimer:
This indicator is provided for educational purposes only and should not be considered as financial advice. Trading involves risks, and past performance is not indicative of future results. Traders should conduct their own analysis and exercise caution when making trading decisions based on any indicator or tool. Always consider risk management strategies and consult with a qualified financial advisor if needed.

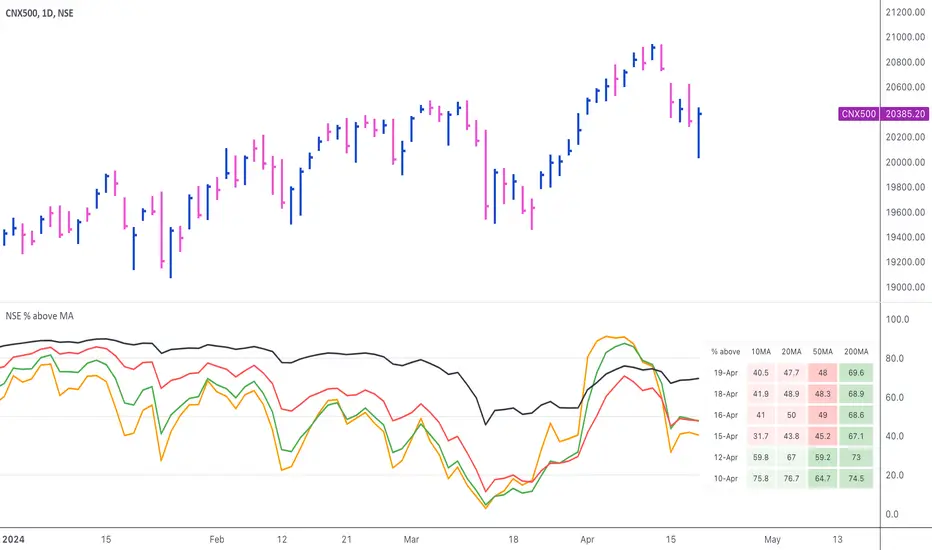
NSE Percentage of stocks above Moving AveragesThis indicator displays the percentage of NSE (India) stocks trading above key moving averages.
Market breadth measures the degree of participation & the conviction in the overall mood of the underlying index. A positive market breadth is said to happen when more stocks are advancing than are declining. Among many ways to measure this, one simple way is the % of stocks trading above a certain moving average. When most of the stocks are trading above a specific moving average, the market breadth is termed strong.
This script uses 10-day & 20-day EMA for short-term timeframes, & 50-day & 200-day EMA for medium to long-term timeframes.
Default Mode
We have a bullish bias when >50% of stocks are above their 50-day and 200-day MAs. We have a bearish bias when <50% of stocks are above their 50-day and 200-day MAs.
We also look at short-term timeframes (10 & 20 MA) for overbought and oversold levels. Values above 80% are considered overbought and readings below 20% are deemed oversold .
Individual Moving averages, & the table also, can be turned off.
Oversold/overbrought market breadth does not necessarily indicate reversal, but rather an exhaustion. This can get resolved by either a price correction or a time correction. The breadth can remain in overbought zones for a long time while the price is in a strong uptrend — and equally so at oversold zones during a strong downtrend.
Moving Average of Market Breadth
Turning-on the MA of breadth displays the 50-day Moving Average of the % of stocks above the 50-day Moving Average.
This is another way to visualise a smoothed version of the market breadth. If the % of stocks above the 50-day Moving Average is above its own 50-day Moving Average, then we can say that the breadth is strong.
Mini Mode
Turning on the mini-mode converts the table into a 4-color block, with the blocks reflecting the status of 10, 20, 50 & 200 MAs respectively, from top to bottom.
Text Mode
Turning on the text-mode converts the percentage numbers in the table into 1-word text descriptions.
Dependency:
The script uses the Pine Seeds service to import custom data hosted in a GitHub repository and accesses it via TradingView as the frontend. So, the number of bars appearing on charts is fully dependent on the amount of historical data available. Any error or omission, if there, is a reflection of the hosted data, & not that of TradingView.
Limitations:
Such data has some limitations, like it can only be updated at EOD (End-of-Day), & only daily-based timeframes can be applied to such data. Irrespective of the intraday changes, only the last saved value on the chart is seen. So, it's best to use this script as EOD, rather than intraday.
At the time of publication of this script, historical data was available till the year 2004.
The universe of stocks chosen for the data is all stocks with latest Close >= 1 and Market Cap > 10.
Credits:
NSE Market Breadth data is from Chhirag_Kedia , & the Pine seeds are courtesy of EquityCraze
Coiled Moving AveragesThis indicator detects when 3 moving averages converge and become coiled. This indicates volatility contraction which often leads to volatility expansion, i.e. large price movements.
Moving averages are considered coiled when the percent difference from each moving average to the others is less than the Coil Tolerance % input value.
This indicator is unique in that it detects when moving averages converge within a specified percent range. This is in contrast to other indicators that only detect moving average crossovers, or the distance between price and a moving average.
This indicator includes options such as:
- % difference between the MAs to be considered coiled
- type and length of MAs
- background color to indicate when the MAs are coiled
- arrows to indicate if price is above or below the MAs when they become coiled
While coiling predicts an increased probability for volatility expansion, it does not necessarily predict the direction of expansion. However, the arrows which indicate whether price is above or below the moving average coil may increase the odds of a move in that direction. Bullish alignment of the moving averages (faster MAs above the slower MAs) may also increase the odds of a bullish break, while bearish alignment may increase the odds of a bearish break.
Note that mean reversion back to the MA coil is common after initial volatility expansion. This can present an entry opportunity for traders, as mean reversion may be followed by continuation in the direction of the initial break.
Experiment with different settings and timeframes to see how coiled MAs can help predict the onset of volatility.

On Chart Reverse PMARPIntroducing the On Chart Reverse PMARP
Concept
The PMAR/PMARP is an indicator which calculates :
The ratio between a chosen source price and a user defined moving average ( Price Moving Average Ratio ).
The percentile of the PMAR over an adjustable lookback period ( Price Moving Average Ratio Percentile ).
Here I have 'reverse engineered' the PMAR / PMARP formulas to derive several functions.
These functions calculate the chart price at which the PMARP will cross a particular PMARP level.
I have employed those functions here to give the "crossover" price levels for :
Scale high level
High alert level
High test level
Mid-Line
Low test level
Low alert level
Scale low level
Knowing the price at which these various user defined PMARP levels will be crossed can be useful in setting price levels that trigger components of various strategies.
For example: A trader can use the reverse engineered upper high alert price level, to set a take profit limit order on a long trade, which was entered when PMARP was low.
This 'On Chart' RPMARP indicator displays these 'reverse engineered' price levels as plotted lines on the chart.
This allows the user to see directly on the chart the interplay between the various crossover levels and price action.
This allows for more intuitive Technical Analysis, and allows traders to precisely plan entries, exits and stops for their PMARP based trades.
It optionally plots the user defined moving average from which the PMARP is derived.
It also optionally plots the 'Reverse engineered' midline, test level lines, visual alert level lines, scale max. and min. level lines, and background alert signal bars.
Main Properties :
Price Source :- Choice of price values or external value from another indicator ( default *Close ).
PMAR Length :- User defined time period to be used in calculating the Moving Average for the Price Moving Average Ratio and the PMAR component of the PMARP ( default *21 ).
MA Type :- User defined type of Moving Average which creates the MA for the Price Moving Average Ratio and the PMAR component of the PMARP ( default *EMA ).
Checkbox and color selection box for the optionally plotted Moving Average line.
Price Moving Average Ratio Percentile Properties :
PMARP Length :- The lookback period to be used in calculating the Price Moving Average Ratio Percentile ( default *350 ).
PMARP Level Settings :
Scale High :- Scale high level ( Locked at 100 ).
Hi Alert :- High alert level ( default *99 ).
Hi Test :- High test level ( default *70 ).
Lid Line :- Mid line level ( Locked at 50 ).
Lo Test :- Low test level ( default *30 ).
Lo Alert :- Low alert level ( default *1 ).
Scale Low :- Scale low level ( Locked at 0 ).
Checkboxes and color selection boxes for each of the optionally plotted lines.
PMARP MA Settings :
Checkbox to optionally plot 'reverse engineered' PMARP MA line.
PMARP MA Length :- The time period to be used in calculating the signal Moving Average for the Line Plot ( default *20 ).
PMARP MA Type :- The type of Moving Average which creates the signal Moving Average for the Line Plot ( default *EMA ).
Color Type :- User choice from dropdown between "single" or "dual" line color ( default *dual ).
Single Color :- Color selection box.
Dual Color :- Color selection box. Note: Defines the color of the signal MA when the MA is falling in "dual" line coloring mode.
Signal Bar Settings :
Signal Bars Transparency :- Sets the transparency of the vertical signal bars ( default *70 ).
Checkboxes and color selection boxes for Upper/Lower alert signal bars.

Johnny's Moving Average RibbonProps to Madrid for creating the original script: Madrid Moving Average Ribbon.
All I did was upgrade it to pinescript v5 and added a few changes to the script.
Features and Functionality
Moving Average Types: The indicator offers a choice between exponential moving averages (EMAs) and simple moving averages (SMAs), allowing users to select the type that best fits their trading strategy.
Dynamic Color Coding: Each moving average line within the ribbon changes color based on its direction and position relative to a reference moving average, providing visual cues for market sentiment and trend strength.
Lime Green: Indicates an uptrend and potential long positions, shown when a moving average is rising and above the longer-term reference MA.
Maroon: Suggests caution for long positions or potential short reentry points, displayed when a moving average is rising but below the reference MA.
Ruby Red: Represents a downtrend, suitable for short positions, shown when a moving average is falling and below the reference MA.
Green: Signals potential reentry points for downtrends or warnings for uptrend reversals, displayed when a moving average is falling but above the reference MA.
Usage and Application
Trend Identification: Traders can quickly ascertain the market's direction at a glance by observing the predominant color of the ribbon and its orientation.
Trade Entry and Exit Points: The color transitions within the ribbon can signal potential entry or exit points, with changes from green to lime or red to maroon indicating shifts in market momentum.
Customization: Users have the flexibility to toggle between exponential and simple moving averages, allowing for a tailored analytical approach that aligns with their individual trading preferences.
Technical Specifications
The ribbon consists of multiple moving averages calculated over different periods, typically ranging from shorter to longer-term intervals to capture various aspects of market behavior.
The color dynamics are determined by comparing each moving average to a reference point, often a longer-term moving average within the ribbon, to assess the relative trend strength and direction.

Trend: SMA with ATR Bands and EMA [Oxyge]Brief introduction:
Easy to use trend indicator to help find entry positions
How it works:
1, short-term trend judgment: EMA is greatly influenced by short-term trends, so it is very good to use it as a tool for judging short-term trends. At the same time, the filtering function has been added:
Long: green
Short: red
No direction: blue
2, the general trend judgment: the use of 30SMA as the default trend line, while increasing the ATR band to increase the scope of judgment.
How do I use (assuming it is now a period of long market):
1, first look at the 30SMA and ATR band, if the slope is positive (> 45 °), then ready to go long!
2. When price comes to the ATR band, the ATR band is my point of interest
3. Wait for a test of the ATR band: the EMA turns green, which means that the short-term trend is already nice and long.
4. Stop Loss Placement: Stop Loss is placed at the most recent low.
Closing
Enjoy it!
——————————————
简单介绍:
简单易用的趋势指标,帮助寻找进场位置
它怎么工作:
1、短期趋势判断:EMA受短期趋势影响很大,因此把它作为判断短期趋势的工具非常好用。同时增加了过滤功能:
多头:绿色
空头:红色
无方向:蓝色
2、大趋势判断:使用30SMA作为默认趋势线,同时增加ATR带增加判断范围。
我是如何使用的(假设是现在是一段多头行情):
1、先看30SMA和ATR带,如果斜率为正(>45°),那么准备做多
2、当价格来到ATR带时,ATR带是我的感兴趣的点
3、等待一次对于ATR带的测试:EMA变成绿色,代表短期已经是不错的多头趋势
4、止损放置:止损放置在最近的低点
结束
请享受它

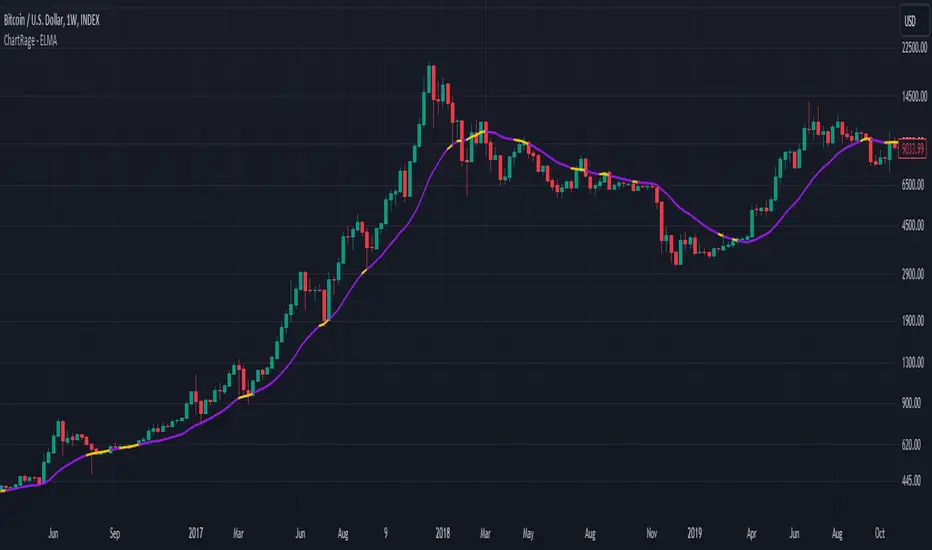
ChartRage - ELMAELMA - Exponential Logarithmic Moving Average
This is a new kind of moving average that is using exponential normalization of a logarithmic formula. The exponential function is used to average the weight on the moving average while the logarithmic function is used to calculate the overall price effect.
Features and Settings:
◻️ Following rate of change instead of absolute levels
◻️ Choose input source of the data
◻️ Real time signals through price interaction
◻️ Change ELMA length
◻️ Change the exponential decay rate
◻️ Customize base color and signal color
Equation of the ELMA:
This formula calculates a weighted average of the logarithm of prices, where more recent prices have a higher weight. The result is then exponentiated to return the ELMA value. This approach emphasizes the relative changes in price, making the ELMA sensitive to the % rate of change rather than absolute price levels. The decay rate can be adjusted in the settings.
Comparison EMA vs ELMA:
In this image we see the differences to the Exponential Moving Average.
Price Interaction and earlier Signals:
In this image we have added the bars, so we can see that the ELMA provides different signals of resistance and support zones and highlights them, by changing to the color yellow, when prices interact with the ELMA.
Strategy by trading Support and Resistance Zones:
The ELMA helps to evaluate trends and find entry points in bullish market conditions, and exit points in bearish conditions. When prices drop below the ELMA in a bull market, it is considered a buying signal. Conversely, in a bear market, it serves as an exit signal when prices trade above the ELMA.
Volatile Markets:
The ELMA works on all timeframes and markets. In this example we used the default value for Bitcoin. The ELMA clearly shows support and resistance zones. Depending on the asset, the length and the decay rate should be adjusted to provide the best results.
Real Time Signals:
Signals occur not after a candle closes but when price interacts with the ELMA level, providing real time signals by shifting color. (default = yellow)
Disclaimer* All analyses, charts, scripts, strategies, ideas, or indicators developed by us are provided for informational and educational purposes only. We do not guarantee any future results based on the use of these tools or past data. Users should trade at their own risk.
This work is licensed under Attribution-NonCommercial-ShareAlike 4.0 International
creativecommons.org
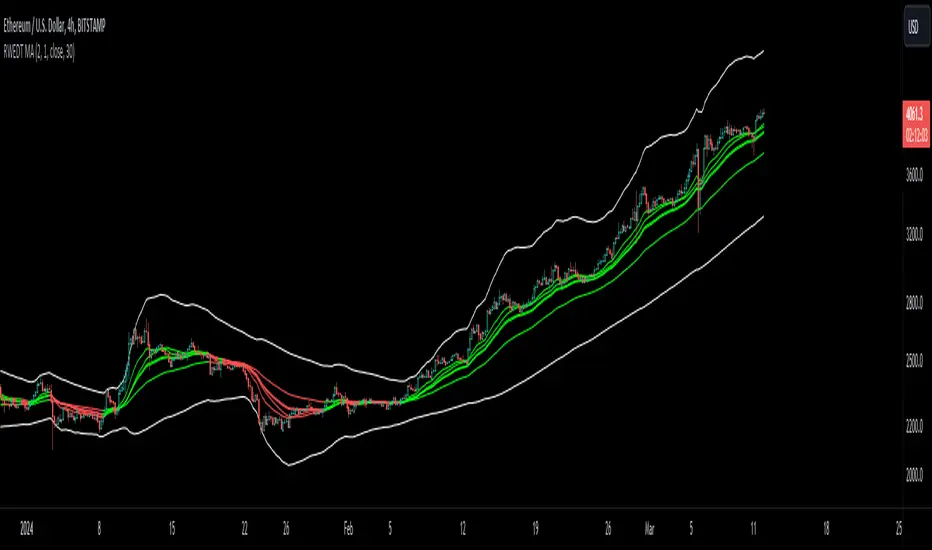
RWEDT Weighted Moving Average Overview:
The RWEDT MA, which is short for rolling, weighted, exponential, double exponential, and triple exponential, is a group of moving averages that were subjected to a log transformation to deal with the skewness of price, and the weight of each of these moving averages was also used for calculating the standard deviations from the mean.
Clearing a misunderstanding on Standard Deviation Bands and Moving Averages
Bands, such as standard deviation bands, are frequently misinterpreted as indicators of support and resistance levels or as "mean-reverting" indicators." However, this is not their intended purpose. Bands are statistical tools that provide ranges within which price (in this case) movements are expected to occur based on historical data. Deviations beyond these bands suggest a decrease in confidence in the model rather than a reversal back to a moving average or a "support/resistance level."
Example : Assuming you correctly applied a log transformation to your standard deviation bands to remove the right skew, and assuming your data closely resembles a normal distribution or some other type of symmetrical distribution, then the probability of a value being in the 2 standard deviation range is around 95%. This does not mean it will reject or go up, or mean revert. The price won't bounce from -2 STDEV 95% of the time; that is incorrect. It just tells you that around 95% of the values will be within the 2 SD range.
Moving averages, including the ones in this indicator, are often misinterpreted as signals of trend reversals or levels of "bouncing." What moving averages actually tell you is what the expected value is. It does not show where you expect the price to be in the future; it tells you that based on the lookback, the expected value is in the center, and the confidence you have in the estimate is the confidence interval or the standard deviation range.
Example: Let's say you enter a trade with a positive expected value (expecting the price to drift up), and we have the limits set at 95%. What it tells you is that as long as the price stays within the limits, you can be 95% certain the model isn't completely random. As the price moves further away from the average, or expected value, it tells you that the model is less likely to be correct.
RWEDT MA
This indicator comes with 5 moving averages, each log transformed to reduce the skewness and asymmetry of price as much as possible
Rolling
Weighted
Exponential
Double Exponential
Triple Exponential
The band standard deviation can be adjusted, and the standard deviations have the weight of all of the moving averages that are present in the indicator. The weight is not customizable.
Why this indicator is useful:
This indicator can tell you what the expected value is. Above the moving average signifies a positive expected value, and below the moving average signifies a negative expected value. As previously stated above, the price moving further from the expected value lets you know that you should have less confidence that the model is "correct," and you could see this as taking profits as the price deviates further from the expected value.
The importance of log-transforming prices for standard deviations and moving averages.
Symmetry: Logarithmic transformations can help achieve symmetry in the distribution of price data. Stock prices, for example, exhibit some type of right-skewed distribution, where large positive price movements are more common than large negative movements. Price also can't go below 0 but can go towards positive infinity, so having a right-skew makes sense; all the outliers will be towards infinity, while all the average occurrences are "near" 0.
Stabilizing Variance: Price data typically exhibit heteroscedasticity, meaning that the variance of price movements changes over time. Log transformations can stabilize the variance and make it more consistent across different price levels. This is important for ensuring that the variability in price moves is not disproportionately influenced by extreme values.
Statistical Assumptions: Many retail indicators like Bollinger Bands use the standard deviation and moving average models of a normal distribution to attempt to model price, whose distribution more closely resembles some type of right-skew distribution. Even with the log-transformation, it still won't always resemble a perfect symmetrical distribution, and you still should not use it for mean reversion. You can still use it to understand the expected value and whether or not you should have confidence in your model.
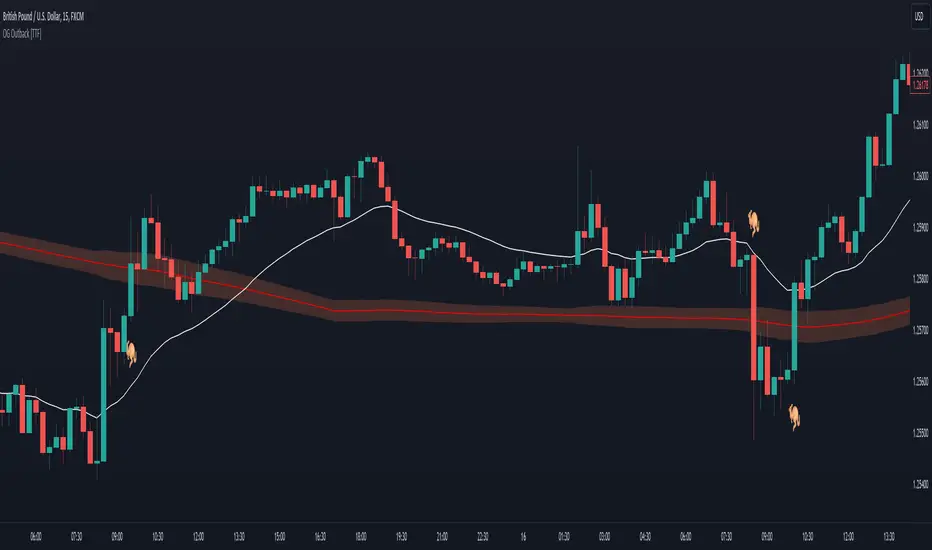
The OG Outback [TTF]The Outback indicator
After a major overhaul of our Outback strategy, we decided that we would make our original version available for anyone to use.
The fundamental element of this indicator is based on price action relative to a slow moving average. That said, given that price will always tend towards a moving average, we have also implemented a method for helping filter out false signals leveraging a "consolidation cloud" and fast moving average. This, coupled with references to a customized version of the Relative Strength Index (RSI), has enabled us to provide significantly higher quality signals relating to price crossing a moving average.
Note: For this version, we have only prepared a single set of conditions and alerts (as noted by the 🦘 symbols). However it's worth noting there are several variations that can be done with some fundamental technical analysis and referencing additional indicators that can take this foundation and build upon it for a substantial increase in risk/reward and profit targets.
Leading T3Hello Fellas,
Here, I applied a special technique of John F. Ehlers to make lagging indicators leading. The T3 itself is usually not realling the classic lagging indicator, so it is not really needed, but I still publish this indicator to demonstrate this technique of Ehlers applied on a simple indicator.
The indicator does not repaint.
In the following picture you can see a comparison of normal T3 (purple) compared to a 2-bar "leading" T3 (gradient):
The range of the gradient is:
Bottom Value: the lowest slope of the last 100 bars -> green
Top Value: the highest slope of the last 100 bars -> purple
Ehlers Special Technique
John Ehlers did develop methods to make lagging indicators leading or predictive. One of these methods is the Predictive Moving Average, which he introduced in his book “Rocket Science for Traders”. The concept is to take a difference of a lagging line from the original function to produce a leading function.
The idea is to extend this concept to moving averages. If you take a 7-bar Weighted Moving Average (WMA) of prices, that average lags the prices by 2 bars. If you take a 7-bar WMA of the first average, this second average is delayed another 2 bars. If you take the difference between the two averages and add that difference to the first average, the result should be a smoothed line of the original price function with no lag.
T3
To compute the T3 moving average, it involves a triple smoothing process using exponential moving averages. Here's how it works:
Calculate the first exponential moving average (EMA1) of the price data over a specific period 'n.'
Calculate the second exponential moving average (EMA2) of EMA1 using the same period 'n.'
Calculate the third exponential moving average (EMA3) of EMA2 using the same period 'n.'
The formula for the T3 moving average is as follows:
T3 = 3 * (EMA1) - 3 * (EMA2) + (EMA3)
By applying this triple smoothing process, the T3 moving average is intended to offer reduced noise and improved responsiveness to price trends. It achieves this by incorporating multiple time frames of the exponential moving averages, resulting in a more accurate representation of the underlying price action.
Thanks for checking this out and give a boost, if you enjoyed the content.
Best regards,
simwai
---
Credits to @loxx

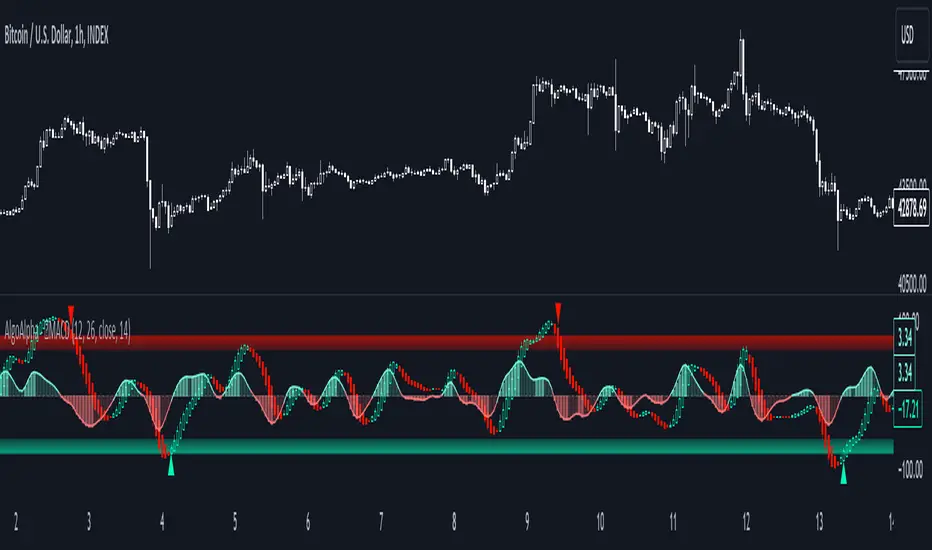
Normalised Gaussian MACD Heikin Ashi [AlgoAlpha]🌟🚀Introducing the Normalised Gaussian MACD Heikin Ashi by AlgoAlpha !
Elevate your trading game with this multipurpose indicator, crafted to pinpoint trend continuation opportunities while highlighting volatility and oversold/overbought conditions. Whether you're embarking on your trading journey or you're a seasoned market navigator, this tool is equipped with intuitive visual cues to amplify your decision-making prowess and enrich your market analysis toolkit. Let's dive into the key features, utilization strategies, and the innovative logic underpinning this indispensable trading asset.
Key Features:
🔧 Enhanced Customization : Tailor your experience with adjustable parameters including Fast Length, Slow Length, Source, Macd Smoothing Length, Signal Smoothing, and more.
🖌️ Visual Enhancements : Opt for Heikin Ashi Candles display and choose to show or hide MACD and Signal lines for a clutter-free chart.
🌈 Color Customization : Personalize your chart with selectable primary and secondary up and down colors to suit your visual preferences.
🔔 Advanced Alert System : Stay ahead with comprehensive alert conditions for market movements, including trend reversals, bullish and bearish swings.
How to Use:
Configure the Inputs : Start by customizing the indicator’s settings to match your trading style. Adjust the length parameters, source selection, and smoothing lengths to fine-tune the indicator’s sensitivity.
Interpret the Candles and Colors : Keep an eye on the Heikin Ashi Candles (if enabled) and the color shifts within the MACD Line Candles and Histogram. These visual cues are pivotal for identifying market trends.
Analyze with Flexibility : Make use of the option to display or hide the MACD and Signal lines based on your analysis requirements. This can help in focusing on the essential information without overcrowding your chart.
Utilize Alerts for Timely Decisions : Leverage the extensive alert system to get notified about potential market movements. These alerts can help you capture the right moment to enter or exit trades.
Basic Logic:
The Normalised Gaussian MACD Heikin Ashi by AlgoAlpha integrates Gaussian filters to elevate the traditional MACD indicator's efficiency, providing a more detailed analysis of market trends and momentum. This sophisticated approach reduces noise and enhances signal speed, which is crucial for identifying momentum trading opportunities.
Gaussian Filter Implementation : The core innovation lies in applying a Gaussian filter to the input price series. This mathematical technique smooths the price data, significantly reducing market noise and making trend signals clearer and more reliable. The Gaussian filter calculates a smoothed value for each data point by weighting nearby data points, with the weights decreasing as the distance from the current data point increases.
Refined MACD Calculation : The Gaussian MACD is derived from the difference between two Gaussian smoothed moving averages (fast and slow), which are then normalized to account for market volatility. This normalization process involves dividing the difference by a measure of market range (such as the high minus the low), and multiplying by a factor (usually 100) to scale the indicator appropriately.
🔑 This script is a versatile tool designed to aid in the identification of momentum and reversals, helping traders to make informed decisions based on technical analysis. Its customization options allow for a tailored analysis experience, fitting the unique needs and strategies of each trader.
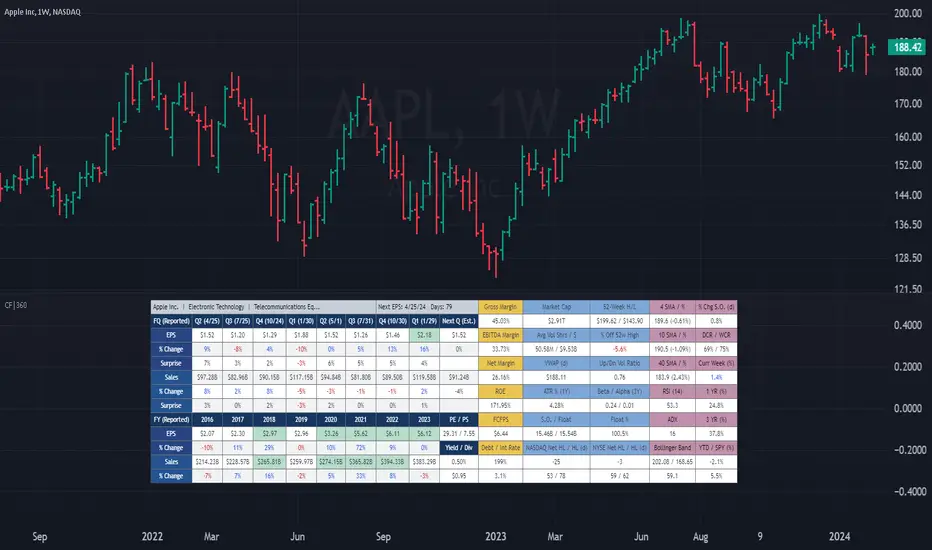
(CF|360) Caruso Financial DashboardThe Caruso Financial 360 Dashboard (CF|360) revolutionizes your TradingView charts by seamlessly integrating comprehensive Fundamental, Statistical, Technical, Performance, and Event information into an intuitively organized dashboard. This empowers users to make informed investment decisions effortlessly, eliminating the need to switch between pages or applications.
The dashboard is strategically divided into five distinct sections, each color-coded for user-friendly navigation. A quick glance at the dark blue "Fundamentals" table reveals two years of quarterly EPS and Sales data, YoY % change, and Surprise %, complete with report dates. Users can explore eight years of annual data and choose between Non-GAAP EPS, Diluted EPS, and Basic EPS for versatile analysis. Opting for Non-GAAP EPS also unveils next quarter estimates. The Fundamentals section further encompasses P/E and P/S data, alongside TTM dividend and dividend yield information.
In the yellow "Extended Fundamentals" section, users gain insights into Gross, EBITDA, and Net margins for easy profitability comparisons within the same industry group. Return on Equity data and Free Cashflow per share provide perspectives on profitability, efficiency, and financial flexibility.
The light blue "Statistics" section furnishes essential statistical measures for a rapid grasp of a company's trading characteristics. Metrics such as Market Cap, Average Volume per day (Shares and $ value), VWAP, Up/Down volume ratio, ATR%, Alpha, Beta, Shares Outstanding & Float, 52-week High/Low, and % distance from the 52-week high are presented. Additionally, market breadth is depicted through Nasdaq and NYSE 52-week high/low data.
The purple "Technical & Performance" section seamlessly integrates both Technical Analysis data and Performance statistics, enabling users to assess the stock's technical context and performance against the market over different periods. Technical indicators, including three customizable moving average types, RSI, ADX, Bollinger Band, Keltner Band, and daily and weekly closing ranges, are featured.
The grey top "Events" section offers a quick overview of the next earnings release date, countdown, and associated color changes as the date approaches. Company name, sector, and industry details are also presented.
To enhance information visibility, record EPS and Sales data are highlighted, emphasizing new records, along with highlights for new 52-week highs and lows.
The CF|360 offers customization options , including three display styles for Desktops, Desktop Slim, and Mobile devices.
Users can also tailor the lengths of technical indicators to suit their preferences. International market enthusiasts will appreciate that the CF|360 provides financial and market data for various regions, including the US, EU, Canada, and beyond.
88 Metrics Included:
Fundamentals Section (Dark Blue Group)
EPS (Adjusted Non-GAAP, Diluted, Basic)
- Quarterly, YoY % Chg, Surprise, Report Date, Next Quarter Estimate (Adjusted EPS only)
- Annual, YoY % Chg
Sales
- Quarterly, YoY % Chg, Surprise, Report Date, Next Quarter Estimate
- Annual, YoY % Chg
P/E ratio
P/S ratio
Dividend TTM
Dividend TTM Yield
Fundamentals Extended (Yellow Group)
Gross Margin
EBITDA Margin
Net Margin
Return on Equity (ROE)
Free Cashflow per Share (FCFPS)
Debt to Equity (Debt)
Effective Interest Rate (Int Rate)
Statistics (Light Blue Group)
Market Cap
Average Daily Volume (Shares)
Average Daily Volume (Dollar Value)
VWAP (Daily)
Average True Range Percent
Shares Outstanding
Shares in Float
Percentage of Share in Float
52-Week High
52-Week Low
% off of 52-Week High
Up / Down Volume Ratio
Beta
Alpha
Nasdaq Net 52-Week High/Lows
Nasdaq 52-Week Highs
Nasdaq 52-Week Lows
NYSE Net 52-Week High/Lows
NYSE 52-Week Highs
NYSE 52-Week Lows
Technical & Performance (Purple Group)
Moving Average Value (3 different averages)
Distance from Moving Average (3 different averages)
Relative Strength Index (RSI)
Average Directional Index (ADX)
Bollinger Band Value (Upper/Lower)
%b
Keltner Band Value (Upper/Lower)
%k
Percentage Changes Since Today’s Open
Daily Closing Range (DCR)
Weekly Closing Range (WCR)
Current Week % Change
1 Month % Change
3 Month % Change
6 Month % Change
1 Year % Change
3 Year % Change
YTD % Change
S&P 500 YTD % Change
Name, Group, & Events (Grey Section)
Company Name
Sector
Industry
Next Earnings Date
Days Until Next Earnings Date
Event Highlights
Record EPS (Quarterly/Annual)
Record Sales (Quarterly/Annual)
52-Week High
52-Week Low
Layout Types
Desktop
Get the full experience with the Desktop view.
Desktop Slim
Save screen real estate with a slim version of the dashboard.
Mobile
Take the most vital metrics with you on your mobile device. For the best experience, view in landscape mode.
EMA + Lower Timeframe EMA (correct display in Replay Mode)This indicator shows
one EMA for the current timeframe
one EMA for a lower timeframe
Unlike the built-in Tradingview EMA indicator, this indicator shows the correct values for the lower timeframe EMA during Replay Mode.