Turn of the Month Strategy on Steroids█ STRATEGY DESCRIPTION
The "Turn of the Month Strategy on Steroids" is a seasonal mean-reversion strategy designed to capitalize on price movements around the end of the month. It enters a long position when specific conditions are met and exits when the Relative Strength Index (RSI) indicates overbought conditions. This strategy is optimized for use on daily or higher timeframes.
█ WHAT IS THE TURN OF THE MONTH EFFECT?
The Turn of the Month effect refers to the observed tendency of stock prices to rise around the end of the month. This strategy leverages this phenomenon by entering long positions when the price shows signs of a reversal during this period.
█ SIGNAL GENERATION
1. LONG ENTRY
A Buy Signal is triggered when:
The current day of the month is greater than or equal to the specified `dayOfMonth` threshold (default is 25).
The close price is lower than the previous day's close (`close < close `).
The previous day's close is also lower than the close two days ago (`close < close `).
The signal occurs within the specified time window (between `Start Time` and `End Time`).
There is no existing open position (`strategy.position_size == 0`).
2. EXIT CONDITION
A Sell Signal is generated when the 2-period RSI exceeds 65, indicating overbought conditions. This prompts the strategy to exit the position.
█ ADDITIONAL SETTINGS
Day of Month: The day of the month threshold for triggering a Buy Signal. Default is 25.
Start Time and End Time: The time window during which the strategy is allowed to execute trades.
█ PERFORMANCE OVERVIEW
This strategy is designed to exploit seasonal price patterns around the end of the month.
It performs best in markets where the Turn of the Month effect is pronounced.
Backtesting results should be analyzed to optimize the `dayOfMonth` threshold and RSI parameters for specific instruments.
Month

200DMA last DOM - ajhImplements and backtests a simple 200 day moving average trend following rules based on last day of month to limits trades to 12 per year.
From the book : 5 BEST Moving Average Strategies (That beat buy and hold) by Steve Burns and Holly Burns
Click on the cog to set the input date range eg; 2000-01-01 to 2016-12-31
The book back tested SP500 returns from 2000-2016 317% using this method vs 125% buy and hold only with less drawdown.
Simple 200 day moving average test and trading on last day of month.
(you may find it trades on next available day close to end of month as not all dates can be traded weekends etc..)
Rules are ;
1. if last day of month and stock over 200 day moving average, then go long 100%
2. if last day of month and stock under 200 day moving average, then close long 100% and goto cash.
Aims to miss market declines and keep you long for upside.
Note: Have found doesn't work well in choppy markets moving sideways like the FTSE100 for same period 2000-2016 and causes losses. Also for many stocks.

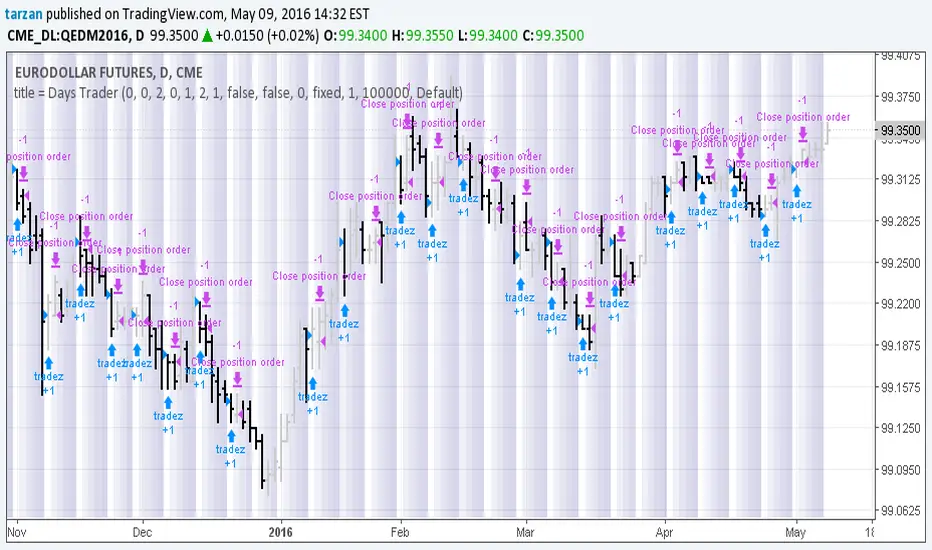
Days Trader 1.0Simple program to look for day of week or day of month patterns in chart data.
All original work by Boffin Hollow Lab
Author: Tarzan