Hello Crypto! Modern Combo Snapshot
Unified long/short analyzer blending EMA structure, SuperTrend, WaveTrend, QQE, and volume pressure.
Background shading flags “watch” and “ready” states; optional long/short modules let you focus on one side.
Alerts fire when every checklist item aligns, while the side-panel table summarizes trend, momentum, liquidity, and overall score in real time.
Indicator → Trend Analysis
Indicator → Momentum Oscillators
Indicator → Volume Indicators
Tags:
cryptocurrency, bitcoin, altcoins, trend-following, momentum, volume, ema, supertrend, intraday, swing-trading, alerts, checklist, trading-strategy, risk-management
Momentumstrategy

Divergences: Price × RSI × OBV The Triple Confirmation Divergence indicator is a sophisticated momentum and volume-based tool designed to identify high-probability trend exhaustion points and potential reversals. It moves beyond traditional single-indicator divergence analysis by synthesizing signals from three core pillars of technical analysis: Price Action, Momentum, and Volume Flow.
This indicator works better on the time frames: 1H, 4H, 1D, 1W and 1M.

RSI Momentum ScalperOverview
The "RSI Momentum Scalper" is a Pine Script v5 strategy crafted for trading highly volatile markets, with a special focus on newly listed cryptocurrencies. This strategy harnesses the Relative Strength Index (RSI) alongside volume analysis and momentum thresholds to pinpoint short-term trading opportunities. It supports both long and short trades, managed with customizable take profit, stop loss, and trailing stop levels, which are visually plotted on the chart for easy tracking.
Why I Created This Strategy
I developed the "RSI Momentum Scalper" because I was seeking a reliable trading strategy tailored to newly listed, highly volatile cryptocurrencies. These assets often experience rapid price fluctuations, rendering traditional strategies less effective. I aimed to create a tool that could exploit momentum and volume spikes while managing risk through adaptable exit parameters. This strategy is designed to address that need, offering a flexible approach for traders in dynamic crypto markets.
How It Works
The strategy utilizes RSI to identify momentum shifts, combined with volume confirmation, to trigger long or short entries. Trades are controlled with take profit, stop loss, and trailing stop levels, which adjust dynamically as the price moves in your favor. The trailing stop helps lock in profits, while the plotted exit levels provide clear visual cues for trade management.
Customizable Settings
The script is highly customizable, allowing you to adjust it to various market conditions and trading styles. Here’s a brief overview of the key settings:
Trade Mode: Select "Both," "Long Only," or "Short Only" to determine the trade direction.
(Default: Both)
RSI Length: Sets the lookback period for the RSI calculation (2 to 30).
(Default: 8)
A shorter length increases RSI sensitivity, suitable for volatile assets.
RSI Overbought: Defines the upper RSI threshold (60 to 99) for short entries.
(Default: 90)
Higher values signal stronger overbought conditions.
RSI Oversold: Defines the lower RSI threshold (1 to 40) for long entries.
(Default: 10)
Lower values indicate stronger oversold conditions.
RSI Momentum Threshold: Sets the minimum RSI momentum change (1 to 15) to trigger entries.
(Default: 14)
Adjusts the sensitivity to price momentum.
Volume Multiplier: Multiplies the volume moving average to filter high-volume bars (1.0 to 3.0).
(Default: 1)
Higher values require stronger volume confirmation.
Volume MA Length: Sets the lookback period for the volume moving average (5 to 50).
(Default: 13)
Influences the volume trend sensitivity.
Take Profit %: Sets the profit target as a percentage of the entry price (0.1 to 10.0).
(Default: 4.15)
Determines when to close a winning trade.
Stop Loss %: Sets the loss limit as a percentage of the entry price (0.1 to 6.0).
(Default: 1.85)
Protects against significant losses.
Trailing Stop %: Sets the trailing stop distance as a percentage (0.1 to 4.0).
(Default: 2.55)
Locks in profits as the price moves favorably.
Visual Features
Exit Levels: Take profit (green), fixed stop loss (red), and trailing stop (orange) levels are plotted when in a position.
Performance Table: Displays win rate, total trades, and net profit in the top-right corner.
How to Use
Add the strategy to your chart in TradingView.
Adjust the input settings based on the cryptocurrency and timeframe you’re trading.
Monitor the plotted exit levels for trade management.
Use the performance table to assess the strategy’s performance over time.
Notes
Test the strategy on a demo account or with historical data before live trading.
The strategy is optimized for short-term scalping; adjust settings for longer timeframes if needed.

EMA / WMA RibbonMomentum Flow Ribbon
Unlock a clear, visual edge in identifying short-term momentum shifts with the Momentum Flow Ribbon.
This indicator was born from a simple yet powerful concept: to visually represent the dynamic relationship between a fast-reacting Exponential Moving Average (EMA) and the smoother, more methodical Wilder's Moving Average (WMA). While both moving averages use the same length, their unique calculation methods cause them to separate and cross, creating a "ribbon" that provides an immediate and intuitive gauge of market momentum.
This tool is designed for the disciplined trader who values clean charts and actionable signals, helping you to execute your strategies with greater confidence and precision.
How It Works
The script plots an EMA and a Wilder's Moving Average (referred to as rma in Pine Script) of the same length. The space between these two lines is then filled with a colored ribbon:
Bullish Green/Teal: The ribbon turns bullish when the faster EMA crosses above the slower Wilder's MA, indicating that short-term momentum is strengthening to the upside.
Bearish Red: The ribbon turns bearish when the EMA crosses below the Wilder's MA, signaling that short-term momentum is shifting to the downside.
The inherent "lag" of the Wilder's MA, a feature designed by J. Welles Wilder Jr. himself, acts as a steady baseline against which the more sensitive EMA can be measured. The result is a simple, zero-lag visual that filters out insignificant noise and highlights meaningful changes in trend direction.
Key Features
Customizable Length and Source: Easily adjust the moving average length and price source (close, hl2, etc.) to fit your specific trading style and the instrument you are trading, from futures like MES and MNQ to cryptocurrencies and forex.
Customizable Colors: Tailor the ribbon's bullish and bearish colors to match your personal chart aesthetic.
Built-in Alerts: The script includes pre-configured alerts for both bullish (EMA crosses above WMA) and bearish (EMA crosses below WMA) signals. Never miss a potential momentum shift again.
Clean & Lightweight: No clutter. Just a simple, effective ribbon that integrates seamlessly into any trading system.
Practical Application for the Discerning Trader
For a futures trader, timing is everything. This ribbon is not just another indicator; it's a tool for confirmation.
Imagine you've identified a key level—a Volume Profile POC, the previous day's low, or a critical accumulation zone. As price approaches this level pre-London session, you're watching for a sign of institutional activity. A flip in the ribbon's color at that precise moment can provide the powerful confirmation you need to enter a trade, trusting that you are aligning with the building liquidity and momentum heading into the New York open.
This is a tool for those who aspire to greatness in their trading—who understand that the edge is found not in complexity, but in the flawless execution of a simple, well-defined plan.
Add the Momentum Flow Ribbon to your chart and start seeing momentum in a clearer light.

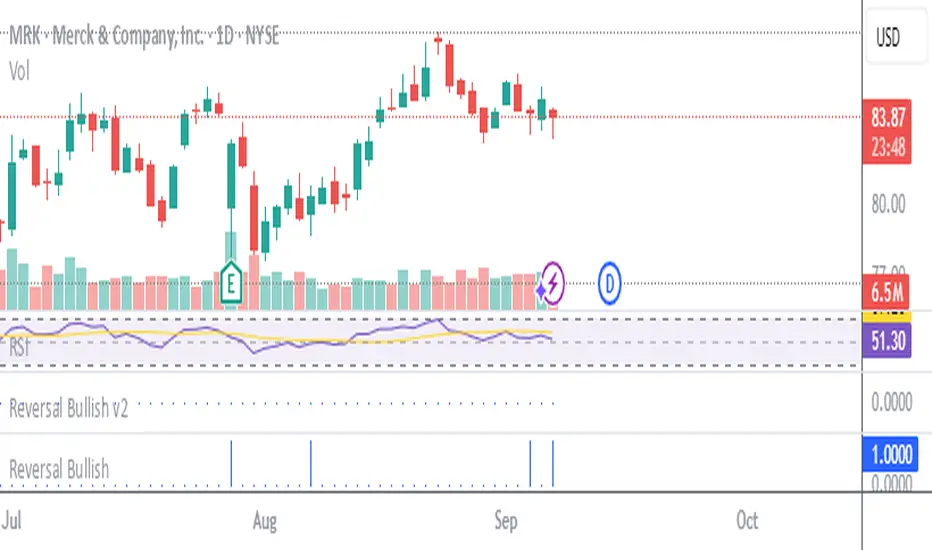
Stockbee Reversal BullishCustom indicator for identifying stocks that meet the Stockbee's Reversal Bullish criteria. This can be used as a standalone indicator or use it to screen for stocks in Pine Screener.
Momentum Index [BigBeluga]The Momentum Index is an innovative indicator designed to measure the momentum of price action by analyzing the distribution of positive and negative momentum values over a defined period. By incorporating delta-based calculations and smoothing techniques, it provides traders with a clear and actionable representation of market momentum dynamics.
🔵 Key Features:
Delta-Based Momentum Analysis:
Calculates the momentum of price by comparing its current state to its value from a defined number of bars back.
Inside a loop, it evaluates whether momentum values are above or below zero, producing a delta value that reflects the net momentum direction and intensity.
Double EMA Smoothing:
Smooths the raw delta-based momentum values with a double EMA filter, reducing noise and providing a clearer trend signal.
tmi(len) =>
sum = 0.0
sum1 = 0.0
above = 0.0
below = 0.0
src_ = src - src
for i = 0 to len
sum := sum + (src_ > nz(src_ ) ? 1 : -1)
sum1 := sum1 + (sum > 0 ? 1 : -1)
sum1 := emaEma(sum1, 10)
for i = 1 to len
above := above + (sum1 > 0 ? 1 : 0)
below := below + (sum1 > 0 ? 0 : 1)
Directional Momentum Signals:
Generates momentum shift signals and displays them on both the oscillator and the main chart:
- △ Aqua Triangles: Represent upward momentum shifts.
- ▽ Red Triangles: Represent downward momentum shifts.
Dynamic Gradient Display:
Highlights momentum zones with gradient fills:
- Aqua shades for positive momentum (above zero).
- Red shades for negative momentum (below zero).
Dashboard Display:
A dashboard summarizing the count of momentum values above and below zero for the defined period (Sentiment Length e.g. 100), helping traders assess market sentiment at a glance.
🔵 How It Works:
The indicator takes price momentum as its source and evaluates the number of momentum values above and below zero within a defined period.
The delta calculation aggregates this information, providing a net representation of the prevailing market momentum.
A double EMA filter is applied to the delta values, smoothing the momentum line and enhancing signal clarity.
Momentum shifts are highlighted with visual signals on the oscillator and price chart, while the gradient display provides a visual representation of intensity.
🔵 Use Cases:
Momentum Tracking: Identify whether market momentum is predominantly bullish or bearish.
Signal Confirmation: Use chart-based signals to confirm potential trend reversals or continuation.
Analyze Market Strength: Leverage the dashboard to quickly assess the distribution of momentum over the chosen period.
Overbought/Oversold Conditions: Utilize gradient zones to detect areas of momentum extremes and possible price exhaustion.
Momentum Index offers a refined approach to analyzing momentum dynamics, combining delta-based calculations with smoothing techniques and intuitive visuals, making it an essential tool for traders looking to anticipate market movements effectively.

Distance from 50 SMA in ADR TermsIndicator produces a multiple of ADR% from the 50-day simple moving average to determine is a stock or etf is extended.
Market State Momentum OscillatorMarket State Momentum Oscillator (MSMO)
Overview
The MSMO combines three elements in one panel:
Momentum oscillator (gray/blue area with aqua signal line)
Market State filter (green/red background area)
Money Flow Index (orange line)
Works on all markets and all timeframes. Non-repainting at bar close.
Colors and meaning
Gray area: Momentum above 0 (bullish bias)
Blue area: Momentum below 0 (bearish bias)
Aqua line: Signal line smoothing the oscillator
Green background: Market state bullish (price above moving average)
Red background: Market state bearish (price below moving average)
Orange line: Money Flow Index (volume-weighted momentum)
How to use
Always wait for confirmation of the green or red market state before acting.
Trend alignment: Watch the slope of the Weekly and Daily 200 MA and Weekly and Daily 50 MA to understand higher-timeframe trend direction. Trade only in alignment with the broader trend.
Entries:
Long: Green state + gray histogram rising + MFI trending up
Short: Red state + blue histogram falling + MFI trending down
Exits: Histogram crossing back through 0, or state background flips against the position.
Users can add chart alerts on plot crossings if needed.
Inputs
Lengths for oscillator pivot, signal smoothing, state moving average, trend weight, return %, and Money Flow Index. Defaults work for most charts.
Note
Educational use only. Not financial advice.
Tags
trend, oscillator, market state, momentum, money flow, crypto, forex, stocks, indices, futures

REMS Snap Shot OverlayThe REMS Snap Shot indicator is a multi-factor, confluence-based system that combines momentum (RSI, Stochastic RSI), trend (EMA, MACD), and optional filters (volume, MACD histogram, session time) to identify high-probability trade setups. Signals are only triggered when all enabled conditions align, giving the trader a filtered, visually clear entry signal.
This indicator uses an optional 'look-back' feature where in it will signal an entry based on the recency of specified cross events.
To use the indicator, select which technical indicators you wish to filter, the session you wish to apply (default is 9:30am - 4pm EST, based on your chart time settings), and if which cross events you wish to trigger a reset on the cooldown.
The default settings filter the 4 major technical indicators (RSI, EMAs, MACD, Stochastic RSI) but optional filters exist to further fine tune Stochastic Range, MACD momentum and strength, and volume, with optional visual cues for MACD position, Stochastic RSI position, and volume.
EMAs can be drawn on the chart from this indicator with optional shaded background.
This indicator is an alternative to REMS First Strike, which uses a recency filter instead of a cool down.

Momentum Breakout StrategyBacktest a strategy where, when a candlestick on a timeframe rises more than a certain %, it enters a trade.

FluidFlow OscillatorFluidFlow Oscillator: Study Material for Traders
Overview
The FluidFlow Oscillator is a custom technical indicator designed to measure price momentum and market flow dynamics by simulating fluid motion concepts such as velocity, viscosity, and turbulence. It helps traders identify potential buy and sell signals along with trend strength, momentum direction, and volatility conditions.
This study explains the underlying calculation concepts, signal logic, visual cues, and how to interpret the professional dashboard table that summarizes key indicator readings.
________________________________________
How the FluidFlow Oscillator Works
Core Mechanisms
1. Price Flow Velocity
o Measures the rate of change of price over a specified flow length (default 40 bars).
o Calculated as a percentage change of closing price: roc=close−closelen_flowcloselen_flow×100\text{roc} = \frac{\text{close} - \text{close}_{len\_flow}}{\text{close}_{len\_flow}} \times 100roc=closelen_flowclose−closelen_flow×100
o Smoothed by an EMA (Exponential Moving Average) to reduce noise, generating a "flow velocity" value.
2. Viscosity Factor
o Analogous to fluid viscosity, it adjusts the flow velocity based on recent price volatility.
o Volatility is computed as the standard deviation of close prices over the flow length.
o The viscosity acts as a damping factor to slow down the flow velocity in highly volatile conditions.
o This results in a "flow with viscosity" value, that smooths out the velocity considering market turbulence.
3. Turbulence Burst
o Captures sudden changes or bursts in the flow by measuring changes between successive viscosity-adjusted flows.
o The turbulence value is a smoothed absolute change in flow.
o A burst boost factor is added to the oscillator to incorporate this rapid change component, amplifying signals during sudden shifts.
4. Oscillator Calculation
o The raw oscillator value is the sum of flow with viscosity plus burst boost, scaled by 10.
o Clamped between -100 and +100 to limit extremes.
o Finally, smoothed again by EMA for cleaner visualization.
________________________________________
Signal Logic
The oscillator works with complementary components to produce actionable signals:
• Signal Line: An EMA-smoothed version of the oscillator for generating crossover-based signals.
• Momentum: The rate of change of the oscillator itself, smoothed by EMA.
• Trend: Uses fast (21-period EMA) and slow (50-period EMA) moving averages of price to identify market trend direction (uptrend, downtrend, or sideways).
Signal Conditions
• Bullish Signal (Buy): Oscillator crosses above the oversold threshold with positive momentum.
• Bearish Signal (Sell): Oscillator crosses below the overbought threshold with negative momentum.
Statuses
The oscillator provides descriptive market states based on level and momentum:
• Overbought
• Oversold
• Buy Signal
• Sell Signal
• Bullish / Bearish (momentum-driven)
• Neutral (no clear trend)
________________________________________
Color System and Visualization
The oscillator uses a sophisticated HSV color model adapting hues according to:
• Oscillator value magnitude and sign (positive or negative)
• Acceleration of oscillator changes
• Smooth color gradients to facilitate intuitive understanding of trend strength and momentum shifts
Background colors highlight overbought (red tint) and oversold (green tint) zones with transparency.
________________________________________
How to Understand the Professional Dashboard Table
The FluidFlow Oscillator offers an integrated table at the bottom center of the chart. This dashboard summarizes critical indicator readings in 8 columns across 3 rows:
Column Description
SIGNAL Current signal status (e.g., Buy, Sell, Overbought) with color coding
OSCILLATOR Current oscillator value (-100 to +100) with color reflecting intensity and direction
MOMENTUM Momentum bias indicating strength/direction of oscillator changes (Strong Up, Up, Sideways, Down, Strong Down)
TREND Current trend status based on EMAs (Strong Uptrend, Uptrend, Sideways, Downtrend, Strong Downtrend)
VOLATILITY Volatility percentage relative to average, indicating market activity level
FLOW Flow velocity value describing price momentum magnitude and direction
TURBULENCE Turbulence level indicating sudden bursts or spikes in price movement
PROGRESS Oscillator's position mapped as a percentage (0% to 100%) showing proximity to extreme levels
Rows Explained
• Row 1 (Header): Labels for each metric.
• Row 2 (Values): Current numerical or descriptive values color-coded along a professional scheme:
o Green or lime tones indicate positive or bullish conditions.
o Red or orange tones indicate caution, sell signals, or bearish conditions.
o Blue tones indicate neutral or stable conditions.
• Row 3 (Status Indicators): Emoji-like icons and bars provide a quick visual gauge of each metric's intensity or signal strength:
o For example, "🟢🟢🟢" suggests very strong bullish momentum, while "🔴🔴🔴" suggests strong bearish momentum.
o Progress bar visually demonstrates oscillator movement toward oversold or overbought extremes.
________________________________________
Practical Interpretation Tips
• A Buy signal with green colors and strong momentum usually precedes upward price moves.
• An Overbought status with red background and red table colors warns of potential price corrections or reversals.
• Watch the Turbulence to gauge market instability; spikes may precede price shocks or volatility bursts.
• Confirm signals with the Trend and Momentum columns to avoid false entries.
• Use the Progress bar to anticipate oscillations approaching key threshold levels for timing trades.
________________________________________
Alerts
The oscillator supports alerts for:
• Buy and sell signals based on oscillator crossovers.
• Overbought and oversold levels reached.
These help traders automate awareness of important market conditions.
________________________________________
Disclaimer
The FluidFlow Oscillator and its signals are for educational and informational purposes only. They do not guarantee profits and should not be considered as financial advice. Always conduct your own research and use proper risk management when trading. Past performance is not indicative of future results.
________________________________________
This detailed explanation should help you understand the workings of the FluidFlow Oscillator, its components, signal logic, and how to analyze its professional dashboard for informed trading decisions.

Momentum Commitment Delta (MCD)What it is
M C D fuses five micro-structure clues into one 0-to-1 score that says, “how hard are traders actually leaning on this move?”
1. Body-Delta Momentum – average net candle body direction.
2. Volume Commitment – up-volume ÷ down-volume over the same window.
3. Wick Compression – shrinking upper/lower wicks = clean conviction.
4. Candle Sequencing – rewards orderly, staircase-style body growth.
5. Pin Ratio – where the close pins inside each candle’s range.
The five factors are multiplied, then auto-normalized so extremes always land near 0 / 1 on any symbol or timeframe.
I recommend tweaking the settings to fit your edge, the pre-loaded settings may not be suitable for most traders. The MCD works on all timeframes as well :)
⸻
How to read basic signals
• Fresh cross above 0.70 → often the birth of a real breakout.
• Cluster of > 0.70 bars → “commitment lock,” pull-backs usually shallow.
• Price makes new high while M C D doesn’t → beware...
• Cross back below 0.30 after a run → momentum is out of fuel.
⸻
Because M C D is multiplicative, it’s hard to hit the extremes—so when the bars light lime green, the print is usually telling the truth.
I personally use the MCD to identify the peak of a high-conviction range, NOT a breakout. If a bar prints over 0.70 (green) and then a range forms off of the bar which exceeded 0.70, the breakout has a high chance to be explosive, regardless of what MCD reads at the breakout inflection point.
Play around with it, im sure there are plenty of other patterns.
Disclaimer: The Momentum Commitment Delta (MCD) indicator is provided strictly for educational and informational purposes. It does not constitute financial or investment advice, nor is it a recommendation to buy or sell any security. Trading involves substantial risk, and you should always perform your own due diligence and consult a qualified financial professional before making any trading decisions. Past performance is not indicative of future results.
Stochastic Z-Score [AlgoAlpha]🟠 OVERVIEW
This indicator is a custom-built oscillator called the Stochastic Z-Score , which blends a volatility-normalized Z-Score with stochastic principles and smooths it using a Hull Moving Average (HMA). It transforms raw price deviations into a normalized momentum structure, then processes that through a stochastic function to better identify extreme moves. A secondary long-term momentum component is also included using an ALMA smoother. The result is a responsive oscillator that reacts to sharp imbalances while remaining stable in sideways conditions. Colored histograms, dynamic oscillator bands, and reversal labels help users visually assess shifts in momentum and identify potential turning points.
🟠 CONCEPTS
The Z-Score is calculated by comparing price to its mean and dividing by its standard deviation—this normalizes movement and highlights how far current price has stretched from typical values. This Z-Score is then passed through a stochastic function, which further refines the signal into a bounded range for easier interpretation. To reduce noise, a Hull Moving Average is applied. A separate long-term trend filter based on the ALMA of the Z-Score helps determine broader context, filtering out short-term traps. Zones are mapped with thresholds at ±2 and ±2.5 to distinguish regular momentum from extreme exhaustion. The tool is built to adapt across timeframes and assets.
🟠 FEATURES
Z-Score histogram with gradient color to visualize deviation intensity (optional toggle).
Primary oscillator line (smoothed stochastic Z-Score) with adaptive coloring based on momentum direction.
Dynamic bands at ±2 and ±2.5 to represent regular vs extreme momentum zones.
Long-term momentum line (ALMA) with contextual coloring to separate trend phases.
Automatic reversal markers when short-term crosses occur at extremes with supporting long-term momentum.
Built-in alerts for oscillator direction changes, zero-line crosses, overbought/oversold entries, and trend confirmation.
🟠 USAGE
Use this script to track momentum shifts and identify potential reversal areas. When the oscillator is rising and crosses above the previous value—especially from deeply negative zones (below -2)—and the ALMA is also above zero, this suggests bullish reversal conditions. The opposite holds for bearish setups. Reversal labels ("▲" and "▼") appear only when both short- and long-term conditions align. The ±2 and ±2.5 thresholds act as momentum warning zones; values inside are typical trends, while those beyond suggest exhaustion or extremes. Adjust the length input to match the asset’s volatility. Enable the histogram to explore underlying raw Z-Score movements. Alerts can be configured to notify key changes in momentum or zone entries.

PRO Investing - Apex EnginePRO Investing - Apex Engine
1. Core Concept: Why Does This Indicator Exist?
Traditional momentum oscillators like RSI or Stochastic use a fixed "lookback period" (e.g., 14). This creates a fundamental problem: a 14-period setting that works well in a fast, trending market will generate constant false signals in a slow, choppy market, and vice-versa. The market's character is dynamic, but most tools are static.
The Apex Engine was built to solve this problem. Its primary innovation is a self-optimizing core that continuously adapts to changing market conditions. Instead of relying on one fixed setting, it actively tests three different momentum profiles (Fast, Mid, and Slow) in real-time and selects the one that is most synchronized with the current price action.
This is not just a random combination of indicators; it's a deliberate synthesis designed to create a more robust momentum tool. It combines:
Volatility analysis (ATR) to generate adaptive lookback periods.
Momentum measurement (ROC) to gauge the speed of price changes.
Statistical analysis (Correlation) to validate which momentum measurement is most effective right now.
Classic trend filters (Moving Average, ADX) to ensure signals are only taken in favorable market conditions.
The result is an oscillator that aims to be more responsive in volatile trends and more stable in quiet periods, providing a more intelligent and adaptive signal.
2. How It Works: The Engine's Three-Stage Process
To be transparent, it's important to understand the step-by-step logic the indicator follows on every bar. It's a process of Adapt -> Validate -> Signal.
Stage 1: Adapt (Dynamic Length Calculation)
The engine first measures market volatility using the Average True Range (ATR) relative to its own long-term average. This creates a volatility_factor. In high-volatility environments, this factor causes the base calculation lengths to shorten. In low-volatility, they lengthen. This produces three potential Rate of Change (ROC) lengths: dynamic_fast_len, dynamic_mid_len, and dynamic_slow_len.
Stage 2: Validate (Self-Optimizing Mode Selection)
This is the core of the engine. It calculates the ROC for all three dynamic lengths. To determine which is best, it uses the ta.correlation() function to measure how well each ROC's movement has correlated with the actual bar-to-bar price changes over the "Optimization Lookback" period. The ROC length with the highest correlation score is chosen as the most effective profile for the current moment. This "active" mode is reflected in the oscillator's color and the dashboard.
Stage 3: Signal (Normalized Velocity Oscillator)
The winning ROC series is then normalized into a consistent oscillator (the Velocity line) that ranges from -100 (extreme oversold) to +100 (extreme overbought). This ensures signals are comparable across any asset or timeframe. Signals are only generated when this Velocity line crosses its signal line and the trend filters (explained below) give a green light.
3. How to Use the Indicator: A Practical Guide
Reading the Visuals:
Velocity Line (Blue/Yellow/Pink): The main oscillator line. Its color indicates which mode is active (Fast, Mid, or Slow).
Signal Line (White): A moving average of the Velocity line. Crossovers generate potential signals.
Buy/Sell Triangles (▲ / ▼): These are your primary entry signals. They are intentionally strict and only appear when momentum, trend, and price action align.
Background Color (Green/Red/Gray): This is your trend context.
Green: Bullish trend confirmed (e.g., price above a rising 200 EMA and ADX > 20). Only Buy signals (▲) can appear.
Red: Bearish trend confirmed. Only Sell signals (▼) can appear.
Gray: No clear trend. The market is likely choppy or consolidating. No signals will appear; it is best to stay out.
Trading Strategy Example:
Wait for a colored background. A green or red background indicates the market is in a tradable trend.
Look for a signal. For a green background, wait for a lime Buy triangle (▲) to appear.
Confirm the trade. Before entering, confirm the signal aligns with your own analysis (e.g., support/resistance levels, chart patterns).
Manage the trade. Set a stop-loss according to your risk management rules. An exit can be considered on a fixed target, a trailing stop, or when an opposing signal appears.
4. Settings and Customization
This script is open-source, and its settings are transparent. You are encouraged to understand them.
Synaptic Engine Group:
Volatility Period: The master control for the adaptive engine. Higher values are slower and more stable.
Optimization Lookback: How many bars to use for the correlation check.
Switch Sensitivity: A buffer to prevent frantic switching between modes.
Advanced Configuration & Filters Group:
Price Source: The data source for momentum calculation (default close).
Trend Filter MA Type & Length: Define your long-term trend.
Filter by MA Slope: A key feature. If ON, allows for "buy the dip" entries below a rising MA. If OFF, it's stricter, requiring price to be above the MA.
ADX Length & Threshold: Filters out non-trending, choppy markets. Signals will not fire if the ADX is below this threshold.
5. Important Disclaimer
This indicator is a decision-support tool for discretionary traders, not an automated trading system or financial advice. Past performance is not indicative of future results. All trading involves substantial risk. You should always use proper risk management, including setting stop-losses, and never risk more than you are prepared to lose. The signals generated by this script should be used as one component of a broader trading plan.

Momentum Trail Oscillator [AlgoAlpha]🟠 OVERVIEW
This script builds a Momentum Trail Oscillator designed to measure directional momentum strength and dynamically track shifts in trend bias using a combination of smoothed price change calculations and adaptive trailing bands. The oscillator aims to help traders visualize when momentum is expanding or contracting and to identify transitions between bullish and bearish conditions.
🟠 CONCEPTS
The core idea combines two methods. First, the script calculates a normalized momentum measure by smoothing price changes relative to their absolute values, which creates a bounded oscillator that highlights whether moves are directional or choppy. Second, it uses a trailing band mechanism inspired by volatility stops, where bands adapt to the oscillator’s volatility, adjusting the thresholds that define a shift in directional bias. This dual approach seeks to address both the magnitude and persistence of momentum, reducing false signals in ranging markets.
🟠 FEATURES
The momentum calculation applies Hull Moving Averages and double EMA smoothing to price changes, producing a smooth, responsive oscillator.
The trailing bands are derived by offsetting a weighted moving average of the oscillator by a multiple of recent momentum volatility. A directional state variable tracks whether the oscillator is above or below the bands, updating when the momentum crosses these dynamic thresholds.
Overbought and oversold zones are visually marked between fixed levels (+30/+40 and -30/-40), with color fills to highlight when momentum is in extreme areas. The script plots signals on both the oscillator pane and optionally overlays markers on the main price chart for clarity.
🟠 USAGE
To use the indicator, apply it to any symbol and timeframe. The “Oscillator Length” controls how sensitive the momentum line is to recent price changes—lower values react faster, higher values smooth out noise. The “Trail Multiplier” sets how far the adaptive bands sit from the oscillator mid-line, which affects how often trend state changes occur. When the momentum line rises into the upper filled area and then crosses back below +40, it signals potential overbought exhaustion. The opposite applies for the oversold zone below -40. The plotted trailing bands switch visibility depending on the current directional state: when momentum is trending up, the lower band acts as the active trailing stop, and when trending down, the upper band becomes active. Trend changes are marked with circular symbols when the direction variable flips, and optional overlay arrows appear on the price chart to highlight overbought or oversold reversals. Traders can combine these signals with their own price action or volume analysis to confirm entries or exits.

Future is hereOverview
"Future is Here" is an original, multi-faceted Pine Script indicator designed to provide traders with a comprehensive toolset for identifying high-probability trading opportunities. By integrating volatility-based entry zones, trend-based price targets, momentum confirmation, dynamic support/resistance levels, and risk-reward ratio (RRR) calculations, this indicator offers a cohesive and actionable trading framework. Each feature is carefully designed to complement the others, ensuring a synergistic approach that enhances decision-making across various market conditions. This script is unique in its ability to combine these elements into a single, streamlined interface with clear visual cues and customizable alerts, making it suitable for both novice and experienced traders.
Key Features and How They Work Together
Volatility-Based Entry Zones
Purpose: Identifies overbought and oversold conditions using a volatility-adjusted moving average, helping traders spot potential reversal zones.
Mechanism: Utilizes a user-defined volatility length and multiplier to calculate dynamic overbought/oversold thresholds based on the standard deviation of price. Crossovers and crossunders of these levels trigger "Buy Zone" or "Sell Zone" labels.
Synergy: These zones act as the foundation for entry signals, which are later confirmed by momentum and trend filters to reduce false signals.
Trend-Based Price Targets
Purpose: Projects potential price targets based on the prevailing trend, giving traders clear objectives for profit-taking.
Mechanism: Combines a fast and slow moving average to determine trend direction, then calculates target prices using a multiplier of the price deviation from the slow MA. Labels display bullish or bearish targets when the fast MA crosses the slow MA.
Synergy: Works in tandem with entry zones and momentum signals to align targets with market conditions, ensuring traders aim for realistic price levels supported by trend strength.
Momentum Confirmation
Purpose: Validates entry signals by assessing momentum strength, filtering out weak setups.
Mechanism: Uses the momentum indicator to detect bullish or bearish momentum crossovers, labeling them as "Strong" or "Weak" based on a comparison with a smoothed momentum average.
Synergy: Enhances the reliability of buy/sell signals by ensuring momentum aligns with volatility zones and trend direction, reducing the risk of premature entries.
Dynamic Support/Resistance Levels
Purpose: Highlights key price levels where the market is likely to react, aiding in trade planning and risk management.
Mechanism: Detects pivot highs and lows over a user-defined lookback period, drawing horizontal lines for the most recent support and resistance levels (limited to two each for clarity). Labels mark these levels with price values.
Synergy: Complements entry zones and price targets by providing context for potential reversal or continuation points, helping traders set logical stop-losses or take-profits.
Buy/Sell Signals with Risk-Reward Ratios
Purpose: Generates precise buy/sell signals with integrated take-profit (TP), stop-loss (SL), and RRR calculations for disciplined trading.
Mechanism: Combines volatility zone crossovers, trend confirmation, and positive momentum to trigger signals. ATR-based TP and SL levels are calculated, and the RRR is displayed in labels for quick assessment.
Synergy: This feature ties together all previous components, ensuring signals are only generated when volatility, trend, and momentum align, while providing clear risk-reward metrics for trade evaluation.
Customizable Alerts
Purpose: Enables traders to stay informed of trading opportunities without constant chart monitoring.
Mechanism: Alert conditions are set for buy and sell signals, delivering notifications with the entry price for seamless integration into trading workflows.
Synergy: Enhances usability by allowing traders to act on high-probability setups identified by the indicator’s combined logic.
Originality
"Future is Here" is an original creation that distinguishes itself through its holistic approach to technical analysis. Unlike single-purpose indicators, it integrates volatility, trend, momentum, and support/resistance into a unified system, reducing the need for multiple scripts. The inclusion of RRR calculations directly in signal labels is a unique feature that empowers traders to evaluate trade quality instantly. The script’s design emphasizes clarity and efficiency, with cooldowns to prevent label clutter and a limit on support/resistance lines to maintain chart readability. This combination of features, along with its customizable parameters, makes it a versatile and novel tool for traders seeking a robust, all-in-one solution.
How to Use
Setup: Add the indicator to your TradingView chart and adjust input parameters (e.g., Volatility Length, Trend Length, TP/SL Multipliers) to suit your trading style and timeframe.
Interpretation:
Look for "Buy Zone" or "Sell Zone" labels to identify potential entry points.
Confirm entries with "Bull Mom" or "Bear Mom" labels and trend direction (Bull/Bear Target labels).
Use Support/Resistance lines to set logical TP/SL levels or anticipate reversals.
Evaluate Buy/Sell signals with TP, SL, and RRR for high-probability trades.
Alerts: Set up alerts for Buy/Sell signals to receive real-time notifications.
Customization: Fine-tune multipliers and lengths to adapt the indicator to different markets (e.g., stocks, forex, crypto) or timeframes.

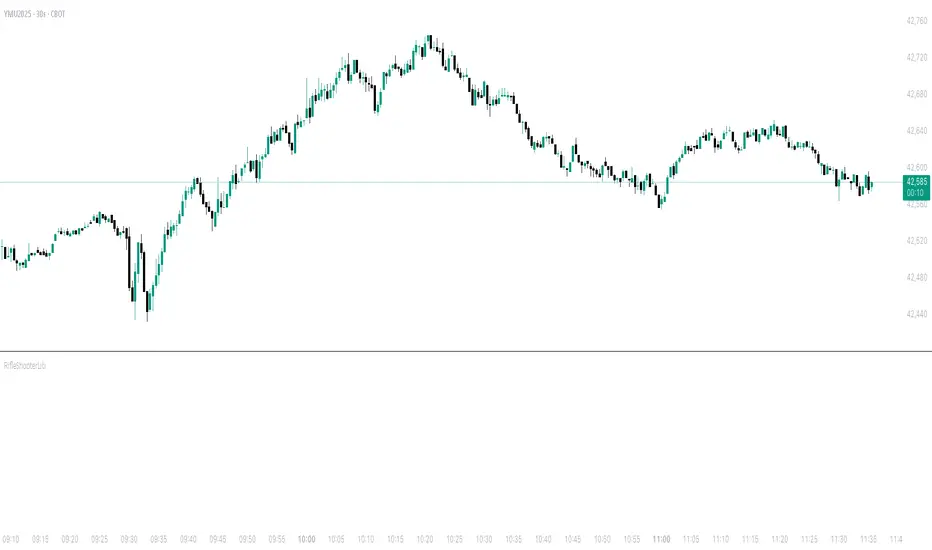
RifleShooterLibLibrary "RifleShooterLib"
Provides a collection of helper functions in support of the Rifle Shooter Indicators.
Functions support the key components of the Rifle Trade algorithm including
* measuring momentum
* identifying paraboloic price action (to disable the algorthim during such time)
* determine the lookback criteria of X point movement in last N minutes
* processing and navigating between the 23/43/73 levels
* maintaining a status table of algorithm progress
toStrRnd(val, digits)
Parameters:
val (float)
digits (int)
_isValidTimeRange(startTimeInput, endTimeInput)
Parameters:
startTimeInput (string)
endTimeInput (string)
_normalize(_src, _min, _max)
_normalize Normalizes series with unknown min/max using historical min/max.
Parameters:
_src (float) : Source series to normalize
_min (float) : minimum value of the rescaled series
_max (float) : maximum value of the rescaled series
Returns: The series scaled with values between min and max
arrayToSeries(arrayInput)
arrayToSeries Return an array from the provided series.
Parameters:
arrayInput (array) : Source array to convert to a series
Returns: The array as a series datatype
f_parabolicFiltering(_activeCount, long, shooterRsi, shooterRsiLongThreshold, shooterRsiShortThreshold, fiveMinuteRsi, fiveMinRsiLongThreshold, fiveMinRsiShortThreshold, shooterRsiRoc, shooterRsiRocLongThreshold, shooterRsiRocShortThreshold, quickChangeLookbackBars, quckChangeThreshold, curBarChangeThreshold, changeFromPrevBarThreshold, maxBarsToholdParabolicMoveActive, generateLabels)
f_parabolicFiltering Return true when price action indicates a parabolic active movement based on the provided inputs and thresholds.
Parameters:
_activeCount (int)
long (bool)
shooterRsi (float)
shooterRsiLongThreshold (float)
shooterRsiShortThreshold (float)
fiveMinuteRsi (float)
fiveMinRsiLongThreshold (float)
fiveMinRsiShortThreshold (float)
shooterRsiRoc (float)
shooterRsiRocLongThreshold (float)
shooterRsiRocShortThreshold (float)
quickChangeLookbackBars (int)
quckChangeThreshold (int)
curBarChangeThreshold (int)
changeFromPrevBarThreshold (int)
maxBarsToholdParabolicMoveActive (int)
generateLabels (bool)
rsiValid(rsi, buyThreshold, sellThreshold)
rsiValid Returns true if the provided RSI value is withing the associated threshold. For the unused threshold set it to na
Parameters:
rsi (float)
buyThreshold (float)
sellThreshold (float)
squezeBands(source, length)
squezeBands Returns the squeeze bands momentum color of current source series input
Parameters:
source (float)
length (int)
f_momentumOscilator(source, length, transperency)
f_momentumOscilator Returns the squeeze pro momentum value and bar color states of the series input
Parameters:
source (float)
length (int)
transperency (int)
f_getLookbackExtreme(lowSeries, highSeries, lbBars, long)
f_getLookbackExtreme Return the highest high or lowest low over the look back window
Parameters:
lowSeries (float)
highSeries (float)
lbBars (int)
long (bool)
f_getInitialMoveTarget(lbExtreme, priveMoveOffset, long)
f_getInitialMoveTarget Return the point delta required to achieve an initial rifle move (X points over Y lookback)
Parameters:
lbExtreme (float)
priveMoveOffset (int)
long (bool)
isSymbolSupported(sym)
isSymbolSupported Return true if provided symbol is one of the supported DOW Rifle Indicator symbols
Parameters:
sym (string)
getBasePrice(price)
getBasePrice Returns integer portion of provided float
Parameters:
price (float)
getLastTwoDigitsOfPrice(price)
getBasePrice Returns last two integer numerals of provided float value
Parameters:
price (float)
getNextLevelDown(price, lowestLevel, middleLevel, highestLevel)
getNextLevelDown Returns the next level above the provided price value
Parameters:
price (float)
lowestLevel (float)
middleLevel (float)
highestLevel (float)
getNextLevelUp(price, lowestLevel, middleLevel, highestLevel)
getNextLevelUp Returns the next level below the provided price value
Parameters:
price (float)
lowestLevel (float)
middleLevel (float)
highestLevel (float)
isALevel(price, lowestLevel, middleLevel, highestLevel)
isALevel Returns true if the provided price is onve of the specified levels
Parameters:
price (float)
lowestLevel (float)
middleLevel (float)
highestLevel (float)
getClosestLevel(price, lowestLevel, middleLevel, highestLevel)
getClosestLevel Returns the level closest to the price value provided
Parameters:
price (float)
lowestLevel (float)
middleLevel (float)
highestLevel (float)
f_fillSetupTableCell(_table, _col, _row, _text, _bgcolor, _txtcolor, _text_size)
f_fillSetupTableCell Helper function to fill a setup table celll
Parameters:
_table (table)
_col (int)
_row (int)
_text (string)
_bgcolor (color)
_txtcolor (color)
_text_size (string)
f_fillSetupTableRow(_table, _row, _col0Str, _col1Str, _col2Str, _bgcolor, _textColor, _textSize)
f_fillSetupTableRow Helper function to fill a setup table row
Parameters:
_table (table)
_row (int)
_col0Str (string)
_col1Str (string)
_col2Str (string)
_bgcolor (color)
_textColor (color)
_textSize (string)
f_addBlankRow(_table, _row)
f_addBlankRow Helper function to fill a setup table row with empty values
Parameters:
_table (table)
_row (int)
f_updateVersionTable(versionTable, versionStr, versionDateStr)
f_updateVersionTable Helper function to fill the version table with provided values
Parameters:
versionTable (table)
versionStr (string)
versionDateStr (string)
f_updateSetupTable(_table, parabolicMoveActive, initialMoveTargetOffset, initialMoveAchieved, shooterRsi, shooterRsiValid, rsiRocEnterThreshold, shooterRsiRoc, fiveMinuteRsi, fiveMinuteRsiValid, requireValid5MinuteRsiForEntry, stallLevelOffset, stallLevelExceeded, stallTargetOffset, recoverStallLevelValid, curBarChangeValid, volumeRoc, volumeRocThreshold, enableVolumeRocForTrigger, tradeActive, entryPrice, curCloseOffset, curSymCashDelta, djiCashDelta, showDjiDelta, longIndicator, fontSize)
f_updateSetupTable Manages writing current data to the setup table
Parameters:
_table (table)
parabolicMoveActive (bool)
initialMoveTargetOffset (float)
initialMoveAchieved (bool)
shooterRsi (float)
shooterRsiValid (bool)
rsiRocEnterThreshold (float)
shooterRsiRoc (float)
fiveMinuteRsi (float)
fiveMinuteRsiValid (bool)
requireValid5MinuteRsiForEntry (bool)
stallLevelOffset (float)
stallLevelExceeded (bool)
stallTargetOffset (float)
recoverStallLevelValid (bool)
curBarChangeValid (bool)
volumeRoc (float)
volumeRocThreshold (float)
enableVolumeRocForTrigger (bool)
tradeActive (bool)
entryPrice (float)
curCloseOffset (float)
curSymCashDelta (float)
djiCashDelta (float)
showDjiDelta (bool)
longIndicator (bool)
fontSize (string)
Session-Based Sentiment Oscillator [TradeDots]Track, analyze, and monitor market sentiment across global trading sessions with this advanced multi-session sentiment analysis tool. This script provides session-specific sentiment readings for Asian (Tokyo), European (London), and US (New York) markets, combining price action, volume analysis, and volatility factors into a comprehensive sentiment oscillator. It is an original indicator designed to help traders understand regional market psychology and capitalize on cross-session sentiment shifts directly on TradingView.
📝 HOW IT WORKS
1. Multi-Component Sentiment Engine
Price Action Momentum : Calculates normalized price movement relative to recent trading ranges, providing directional sentiment readings.
Volume-Weighted Analysis : When volume data is available, incorporates volume flow direction to validate price-based sentiment signals.
Volatility-Adjusted Factors : Accounts for changing market volatility conditions by comparing current ATR against historical averages.
Weighted Combination : Merges all components using optimized weightings (Price: 1.0, Volume: 0.3, Volatility: 0.2) for balanced sentiment readings.
2. Session-Segregated Tracking
Automatic Session Detection : Precisely identifies active trading sessions based on user-configured time parameters.
Independent Calculations : Maintains separate sentiment accumulation for each major session, updated only during respective active hours.
Historical Preservation : Stores session-specific sentiment values even when sessions are closed, enabling cross-session comparison.
Real-Time Updates : Continuously processes sentiment during active sessions while preserving inactive session data.
3. Cross-Session Transition Analysis
Sentiment Differential Detection : Monitors sentiment changes when transitioning between trading sessions.
Configurable Thresholds : Generates signals only when sentiment shifts exceed user-defined minimum thresholds.
Directional Signals : Provides distinct bullish and bearish transition alerts with visual markers.
Smart Filtering : Applies smoothing algorithms to reduce false signals from minor sentiment variations.
⚙️ KEY FEATURES
1. Session-Specific Dashboard
Real-Time Status Display : Shows current session activity (ACTIVE/CLOSED) for all three major sessions.
Sentiment Percentages : Displays precise sentiment readings as percentages for easy interpretation.
Strength Classification : Automatically categorizes sentiment as HIGH (>50%), MEDIUM (20-50%), or LOW (<20%).
Customizable Positioning : Place dashboard in any corner with adjustable size options.
2. Advanced Signal Generation
Transition Alerts : Triangle markers indicate significant sentiment shifts between sessions.
Extreme Conditions : Diamond markers highlight overbought/oversold threshold breaches.
Configurable Sensitivity : Adjust signal thresholds from 0.05 to 0.50 based on trading style.
Alert Integration : Built-in TradingView alert conditions for automated notifications.
3. Forex Currency Strength Analysis
Base/Quote Decomposition : For forex pairs, separates sentiment into individual currency strength components.
Major Currency Support : Analyzes USD, EUR, GBP, JPY, CHF, CAD, AUD, NZD strength relationships.
Relative Strength Display : Shows which currency is driving pair movement during active sessions.
4. Visual Enhancement System
Session Background Colors : Distinct background shading for each active trading session.
Overbought/Oversold Zones : Configurable extreme sentiment level visualization with colored zones.
Multi-Timeframe Compatibility : Works across all timeframes while maintaining session accuracy.
Customizable Color Schemes : Full color customization for dashboard, signals, and plot elements.
🚀 HOW TO USE IT
1. Add the Script
Search for "Session-Based Sentiment Oscillator " in the Indicators tab or manually add it to your chart. The indicator will appear in a separate pane below your main chart.
2. Configure Session Times
Asian Session : Set Tokyo market hours (default: 00:00-09:00) based on your chart timezone.
European Session : Configure London market hours (default: 07:00-16:00) for European analysis.
US Session : Define New York market hours (default: 13:00-22:00) for American markets.
Timezone Adjustment : Ensure session times match your broker's specifications and account for daylight saving changes.
3. Optimize Analysis Parameters
Sentiment Period : Choose 5-50 bars (default: 14) for sentiment calculation lookback period.
Smoothing Settings : Select 1-10 bars smoothing (default: 3) with SMA, EMA, or RMA options.
Component Selection : Enable/disable volume analysis, price action, and volatility factors based on available data.
Signal Sensitivity : Adjust threshold from 0.05-0.50 (default: 0.15) for transition signal generation.
4. Interpret Readings and Signals
Positive Values : Indicate bullish sentiment for the active session.
Negative Values : Suggest bearish sentiment conditions.
Dashboard Status : Monitor which session is currently active and their respective sentiment strengths.
Transition Signals : Watch for triangle markers indicating significant cross-session sentiment changes.
Extreme Alerts : Note diamond markers when sentiment reaches overbought (>70%) or oversold (<-70%) levels.
5. Set Up Alerts
Configure TradingView alerts for:
- Bullish session transitions
- Bearish session transitions
- Overbought condition alerts
- Oversold condition alerts
❗️LIMITATIONS
1. Data Dependency
Volume Requirements : Volume-based analysis only functions when volume data is provided by your broker. Many forex brokers do not supply reliable volume data.
Price Action Focus : In absence of volume data, sentiment calculations rely primarily on price movement and volatility factors.
2. Session Time Sensitivity
Manual Adjustment Required : Session times must be manually updated for daylight saving time changes.
Broker Variations : Different brokers may have slightly different session definitions requiring time parameter adjustments.
3. Ranging Market Limitations
Trend Bias : Sentiment calculations may be less reliable during extended sideways or low-volatility market conditions.
Lag Consideration : As with all sentiment indicators, readings may lag during rapid market transitions.
4. Regional Market Focus
Major Session Coverage : Designed primarily for major global sessions; may not capture sentiment from smaller regional markets.
Weekend Gaps : Does not account for weekend gap effects on sentiment calculations.
⚠️ RISK DISCLAIMER
Trading and investing carry significant risk and can result in financial loss. The "Session-Based Sentiment Oscillator " is provided for informational and educational purposes only. It does not constitute financial advice.
- Always conduct your own research and analysis
- Use proper risk management and position sizing in all trades
- Past sentiment patterns do not guarantee future market behavior
- Combine this indicator with other technical and fundamental analysis tools
- Consider overall market context and your personal risk tolerance
This script is an original creation by TradeDots, published under the Mozilla Public License 2.0.
Session-based sentiment analysis should be used as part of a comprehensive trading strategy. No single indicator can predict market movements with certainty. Exercise proper risk management and maintain realistic expectations about indicator performance across varying market conditions.

EMA Pullback Speed Strategy 📌 **Overview**
The **EMA Pullback Speed Strategy** is a trend-following approach that combines **price momentum** and **Exponential Moving Averages (EMA)**.
It aims to identify high-probability entry points during brief pullbacks within ongoing uptrends or downtrends.
The strategy evaluates **speed of price movement**, **relative position to dynamic EMA**, and **candlestick patterns** to determine ideal timing for entries.
One of the key concepts is checking whether the price has **“not pulled back too much”**, helping focus only on situations where the trend is likely to continue.
⚠️ This strategy is designed for educational and research purposes only. It does not guarantee future profits.
🧭 **Purpose**
This strategy addresses the common issue of **"jumping in too late during trends and taking unnecessary losses."**
By waiting for a healthy pullback and confirming signs of **trend resumption**, traders can enter with greater confidence and reduce false entries.
🎯 **Strategy Objectives**
* Enter in the direction of the prevailing trend to increase win rate
* Filter out false signals using pullback depth, speed, and candlestick confirmations
* Predefine Take-Profit (TP) and Stop-Loss (SL) levels for safer, rule-based trading
✨ **Key Features**
* **Dynamic EMA**: Reacts faster when price moves quickly, slower when market is calm – adapting to current momentum
* **Pullback Filter**: Avoids trades when price pulls back too far (e.g., more than 5%), indicating a trend may be weakening
* **Speed Check**: Measures how strongly the price returns to the trend using candlestick body speed (open-to-close range in ticks)
📊 **Trading Rules**
**■ Long Entry Conditions:**
* Current price is above the dynamic EMA (indicating uptrend)
* Price has pulled back toward the EMA (a "buy the dip" situation)
* Pullback depth is within the threshold (not excessive)
* Candlesticks show consecutive bullish closes and break the previous high
* Price speed is strong (positive movement with momentum)
**■ Short Entry Conditions:**
* Current price is below the dynamic EMA (indicating downtrend)
* Price has pulled back up toward the EMA (a "sell the rally" setup)
* Pullback is within range (not too deep)
* Candlesticks show consecutive bearish closes and break the previous low
* Price speed is negative (downward momentum confirmed)
**■ Exit Conditions (TP/SL):**
* **Take-Profit (TP):** Fixed 1.5% target above/below entry price
* **Stop-Loss (SL):** Based on recent price volatility, calculated using ATR × 4
💰 **Risk Management Parameters**
* Symbol & Timeframe: BTCUSD on 1-hour chart (H1)
* Test Capital: \$3000 (simulated account)
* Commission: 0.02%
* Slippage: 2 ticks (minimal execution lag)
* Max risk per trade: 5% of account balance
* Backtest Period: Aug 30, 2023 – May 9, 2025
* Profit Factor (PF): 1.965 (Net profit ÷ Net loss, including spreads & fees)
⚙️ **Trading Parameters & Indicator Settings**
* Maximum EMA Length: 50
* Accelerator Multiplier: 3.0
* Pullback Threshold: 5.0%
* ATR Period: 14
* ATR Multiplier (SL distance): 4.0
* Fixed TP: 1.5%
* Short-term EMA: 21
* Long-term EMA: 50
* Long Speed Threshold: ≥ 1000.0 (ticks)
* Short Speed Threshold: ≤ -1000.0 (ticks)
⚠️Adjustments are based on BTCUSD.
⚠️Forex and other currency pairs require separate adjustments.
🔧 **Strategy Improvements & Uniqueness**
Unlike basic moving average crossovers or RSI triggers, this strategy emphasizes **"momentum-supported pullbacks"**.
By combining dynamic EMA, speed checks, and candlestick signals, it captures trades **as if surfing the wave of a trend.**
Its built-in filters help **avoid overextended pullbacks**, which often signal the trend is ending – making it more robust than traditional trend-following systems.
✅ **Summary**
The **EMA Pullback Speed Strategy** is easy to understand, rule-based, and highly reproducible – ideal for both beginners and intermediate traders.
Because it shows **clear visual entry/exit points** on the chart, it’s also a great tool for practicing discretionary trading decisions.
⚠️ Past performance is not a guarantee of future results.
Always respect your Stop-Loss levels and manage your position size according to your risk tolerance.

CoffeeShopCrypto Supply Demand PPO AdvancedCoffeeShopCrypto PPO Advanced is a structure-aware momentum oscillator and price-trend overlay designed to help traders interpret momentum strength, exhaustion, and continuation across evolving market conditions. It’s not a “buy/sell” signal tool — it's a momentum context tool that helps confirm trend intent.
Original Code derived from the Price Oscillator Indicators (PPO) found in the TradingView Technical Indicators categories. You can view the info and calculation for the original PPO here
www.tradingview.com
Much like the MACD, the PPO uses a couple lagging indicators to present Momentum as a percentage. But it lacks context to market structure.
What It’s Based On
This tool is based on a dual-moving-average PPO oscillator structure (Percentage Price Oscillator) enhanced by:
Oscillator pivot structure: detection of Lower Highs (LH) and Higher Lows (HL) inside the oscillator.
Detection of Supply and Demand Trends via Market Absorption
Ability to transfer its average plots to price action
Detection of Trend Exhaustion
Real-time price-based exhaustion levels: projecting potential future supply and demand using trendlines from weakening momentum.
Integrated fast and slow Moving Averages on price using the same inputs as the oscillator, to visualize alignment between short- and long-term trends.
These elements combine momentum context with price action in a visual, intuitive system.
How It Works
1. Oscillator Structure
LHs (above zero): momentum weakening in uptrends.
HLs (below zero): momentum strengthening in downtrends.
Only valid pivots are shown (e.g., an LH must be preceded by a valid LL).
2. Exhaustion Levels
Green demand lines: price is making new lows, but oscillator prints HL → potential exhaustion.
Red supply lines: price is making new highs, but oscillator prints LH → potential exhaustion.
These lines are future-facing, projecting likely reaction zones based on momentum weakening.
3. Moving Averages on Price
Two MAs are drawn on the price chart:
Fast MA (same length as PPO short input)
Slow MA (same length as PPO long input)
These are not signal lines — they're visual guides for trend alignment.
MA crossover = PO crosses zero. This indicates short- and long-term momentum are syncing — a powerful signal of trend conviction.
When price is above both MAs, and the PO is rising above zero, bullish momentum is dominant.
When price is below both MAs, and the PO is falling below zero, bearish momentum dominates.
How Traders Can Use It
✅ Spot Trend Initiation
Wait for clear trend confirmation in price.
Use PPO Momentum+ to confirm momentum structure is aligned (e.g., HH/HL in oscillator + price above both MAs).
🔁 Track Continuations
In uptrends, look for oscillator HH and HL sequences with price holding above both MAs.
In downtrends, seek LL and LH sequences with price below both MAs.
⚠️ Watch for Exhaustion
Price breaking below red (supply) lines after oscillator LH = bearish exhaustion signal.
Price breaking above green (demand) lines after oscillator HL = bullish exhaustion signal.
These levels act like pre-mapped S/R zones, showing where momentum previously failed and price may react.
Why This Is Different
Momentum tools often lag or mislead when used blindly. This tool visualizes structural failure in momentum and maps potential outcomes. The integration of oscillator and price-based tools ensures traders are always reading context, not just raw signals.
Demand Trendlines
Demand trendlines show us Wykoff's law of "Absorbed Supply Reversal" In real time.
When aggressive selling pressure is persistently absorbed by passive buying interest without significant downward price continuation, and supply becomes exhausted, the market structure shifts as demand regains control—resulting in a directional reversal to the upside.
This commonly happens in a 3 phase interaction of price.
1. Selling pressure is absorbed quickly by buyers.
This PPO tool will calculate the trend of this absorption process
2. After there is a notable Bearish Exhaustion of price action, the PPO tool will draw a trendline of this absorption showing us the potential future prices where aggressive buyers will want to step in at lower prices.
3. After higher lows are defined in the oscillator, you'll see prices react in a strong bullish pattern at this trendline where aggressive buyers stepped in to reverse price action to the upside.
Supply Trendlines
Supply trendlines show us Wykoff's law of "Absorbed Demand Reversal" In real time.
When aggressive buying pressure is persistently absorbed by passive selling interest without significant downward price continuation, and demand becomes exhausted, the market structure shifts as supply regains control—resulting in a directional reversal to the downside.
This commonly happens in a 3 phase interaction of price.
1. Buying pressure is absorbed quickly by sellers.
This PPO tool will calculate the trend of this absorption process.
2. After there is a notable Bullish Exhaustion of price action, the PPO tool will draw a trendline of this absorption showing us the potential future prices where aggressive sellers will want to step in at higher prices.
3. After lower highs are defined in the oscillator, you'll see prices react in a strong bearish pattern at this trendline where aggressive sellers stepped in to reverse price action to the downside.
Lower High and Higher Low Signals
When the oscillator signals Lower Highs or High Lows its only noting that momentum in that trend direction is slowing. THis indicates a coming pause in the market and the proceeding longs of an uptrend or shorts of a downtrend should be taken with caution.
**These LH and HL markers are not reading as divergences in price vs momentum.**
They are simply registering against the highs and lows of itself..
Moving Averages on Price Action
The Oscillator will cross over its ZERO level the same time your Short and Long MAs cross each other. This will indicate that the short term average trend is moving ahead of the long term.
Crossovers are not an entry signal. It's a method in determining you current timeframe trend strength. Always observe price action as it passes through each of your moving averages and compare it to the positioning and direction of the oscillator.
If price dips in between the moving averages while the oscillator still shows a strong trend strength, you can wait for price to move ahead of your fast moving average.
Bar Colors and Signal Line for Trend Strength
Good Bullish Trend = Oscillator above zero + Signal rising below Oscillator
Weak Bullish Trend = Oscillator above zero + Signal above Oscillator
Good Bearish Trend = Oscillator below zero + Signal falling above Oscillator
Weak Bearish Trend = Oscillator below zero + Signal below Oscillator
Bar Colors
Bars are colored to match Oscillator Momentum Strength. Colors are set by user.
Why alter the known PPO (Percentage Price Oscillator) in this manner?
The PPO tool is great for measuring the strength as percentage of price action over and average amount of candles however, with these changes,
you know have the ability to correlate:
Wycoff theory of supply and demand,
Measure the depth of reversals and pullback by price positioning against moving averages,
Project potential reversal and exhaustion pricing,
Visibly note the structure of momentum much like you would note market structure,
Its not enough to know there is momentum. Its better to know
A) Is it enough
B) Is there something in the way which will cause price to push back
C) Does this momentum correlate to the prevailing trend

PEAD strategy█ OVERVIEW
This strategy trades the classic post-earnings announcement drift (PEAD).
It goes long only when the market gaps up after a positive EPS surprise.
█ LOGIC
1 — Earnings filter — EPS surprise > epsSprThresh %
2 — Gap filter — first regular 5-minute bar gaps ≥ gapThresh % above yesterday’s close
3 — Timing — only the first qualifying gap within one trading day of the earnings bar
4 — Momentum filter — last perfDays trading-day performance is positive
5 — Risk management
• Fixed stop-loss: stopPct % below entry
• Trailing exit: price < Daily EMA( emaLen )
█ INPUTS
• Gap up threshold (%) — 1 (gap size for entry)
• EPS surprise threshold (%) — 5 (min positive surprise)
• Past price performance — 20 (look-back bars for trend check)
• Fixed stop-loss (%) — 8 (hard stop distance)
• Daily EMA length — 30 (trailing exit length)
Note — Back-tests fill on the second 5-minute bar (Pine limitation).
Live trading: enable calc_on_every_tick=true for first-tick entries.
────────────────────────────────────────────
█ 概要(日本語)
本ストラテジーは決算後の PEAD を狙い、
EPS サプライズがプラス かつ 寄付きギャップアップ が発生した銘柄をスイングで買い持ちします。
█ ロジック
1 — 決算フィルター — EPS サプライズ > epsSprThresh %
2 — ギャップフィルター — レギュラー時間最初の 5 分足が前日終値+ gapThresh %以上
3 — タイミング — 決算当日または翌営業日の最初のギャップのみエントリー
4 — モメンタムフィルター — 過去 perfDays 営業日の騰落率がプラス
5 — リスク管理
• 固定ストップ:エントリー − stopPct %
• 利確:終値が日足 EMA( emaLen ) を下抜け
█ 入力パラメータ
• Gap up threshold (%) — 1 (ギャップ条件)
• EPS surprise threshold (%) — 5 (EPS サプライズ最小値)
• Past price performance — 20 (パフォーマンス判定日数)
• Fixed stop-loss (%) — 8 (固定ストップ幅)
• Daily EMA length — 30 (利確用 EMA 期間)
注意 — Pine の仕様上、バックテストでは寄付き 5 分足の次バーで約定します。
実運用で寄付き成行に合わせたい場合は calc_on_every_tick=true を有効にしてください。
────
ご意見や質問があればお気軽にコメントください。
Happy trading!

Money Flow Pulse💸 In markets where volatility is cheap and structure is noisy, what matters most isn’t just the move — it’s the effort behind it. Money Flow Pulse (MFP) offers a compact, color-coded readout of real-time conviction by scoring volume-weighted price action on a five-tier scale. It doesn’t try to predict reversals or validate trends. Instead, it reveals the quality of the move in progress: is it fading , driving , exhausting , or hollow ?
🎨 MFP draws from the traditional Money Flow Index (MFI), a volume-enhanced momentum oscillator, but transforms it into a modular “pressure readout” that fits seamlessly into any structural overlay. Rather than oscillating between extremes with little interpretive guidance, MFP discretizes the flow into clean, color-coded regimes ranging from strong inflow (+2) to strong outflow (–2). The result is a responsive diagnostic layer that complements, rather than competes with, tools like ATR and/or On-Balance Volume.
5️⃣ MFP uses a normalized MFI value smoothed over 13 periods and classified into a 5-tier readout of Volume-Driven Conviction :
🍆 Exhaustion Inflow — usually a top or blowoff; not strength, but overdrive (+2)
🥝 Active Inflow — supportive of trend continuation (+1)
🍋 Neutral — chop, coil, or fakeouts (0)
🍑 Selling Intent — weakening structure, possible fade setups (-1)
🍆 Exhaustion Outflow — often signals forced selling or accumulation traps (-2)
🎭 These tiers are not arbitrary. Each one is tuned to reflect real capital behavior across timeframes. For instance, while +1 may support continuation, +2 often precedes exhaustion — especially on the lower timeframes. Similarly, a –1 reading during a pullback suggests sell-side pressure is building, but a shift to –2 may mean capitulation is already underway. The difference between the two can define whether a move is tradable continuation or strategic exhaustion .
🌊 The MFI ROC (Rate of Change) feature can be toggled to become a volatility-aware pulse monitor beneath the derived MFI tier. Instead of scoring direction or structure, ROC reveals how fast conviction is changing — not just where it’s headed, but how hard it's accelerating or decaying. It measures the raw Δ between the current and previous MFI values, exposing bursts of energy, fading pressure, or transitional churn .
🎢 Visually, ROC appears as a low-opacity area fill, anchored to a shared lemon-yellow zero line. When the green swell rises, buying pressure is accelerating; when the red drops, flow is actively deteriorating. A subtle bump may signal early interest — while a steep wave hints at an emotional overreaction. The ROC value itself provides numeric insight alongside the raw MFI score. A reading of +3.50 implies strong upside momentum in the flow — often supporting trend ignition. A score of –6.00 suggests rapid deceleration or full exhaustion — often preceding reversals or failed breakouts.
・ MFI shows you where the flow is
・ ROC tells you how it’s behaving
😎 This blend reveals not just structure or intent — but also urgency . And in flow-based trading, urgency often precedes outcome.
🧩 Divergence isn’t delay — it’s disagreement . One of the most revealing features of MFP is how it exposes momentum dissonance — situations where price and flow part ways. These divergences often front-run pivots , traps , or velocity stalls . Unlike RSI-style divergence, which whispers of exhaustion, MFI divergence signals a breakdown in conviction. The structure may extend — but the effort isn’t there.
・ Price ▲ MFI ▼ → Effortless Markup : Often signals distribution or a grind into liquidity. Without rising MFI, the rally lacks true flow participation — a warning of fragility.
・ Price ▼ MFI ▲ → Absorption or Early Accumulation : Price breaks down, but money keeps flowing in — a hidden bid. Watch for MFI tier shifts or ROC bursts to confirm a reversal.
🏄♂️ These moments don’t require signal overlays or setup hunting. MFP narrates the imbalance. When price breaks structure but flow does not — or vice versa — you’re not seeing trend, you’re seeing disagreement, and that's where edge begins.
💤 MFP is especially effective on intraday charts where volume dislocations matter most. On the 1H or 15m chart, it helps distinguish between breakouts with conviction versus those lacking flow. On higher timeframes, its resolution softens — it becomes more of a drift indicator than a trigger device. That’s by design: MFP prioritizes pulse, not position. It’s not the fire, it’s the heat.
📎 Use MFP in confluence with structural overlays to validate price behavior. A ribbon expansion with rising MFP is real. A compression breakout without +1 flow is "fishy". Watch how MFP behaves near key zones like anchored VWAP, MAs or accumulation pivots. When MFP rises into a +2 and fails to sustain, the reversal isn’t just technical — it’s flow-based.
🪟 MFP doesn’t speak loudly, but it never whispers without reason. It’s the pulse check before action — the breath of the move before the breakout. While it stays visually minimal on the chart, the true power is in the often overlooked Data Window, where traders can read and interpret the score in real time. Once internalized, these values give structure-aware traders a framework for conviction, continuation, or caution.
🛜 MFP doesn’t chase momentum — it confirms conviction. And in markets defined by noise, that signal isn’t just helpful — it’s foundational.

DEMA Trend Oscillator Strategy📌 Overview
The DEMA Trend Oscillator Strategy is a dynamic trend-following approach based on the Normalized DEMA Oscillator SD.
It adapts in real-time to market volatility with the goal of improving entry accuracy and optimizing risk management.
⚠️ This strategy is provided for educational and research purposes only.
Past performance does not guarantee future results.
🎯 Strategy Objectives
The main goal of this strategy is to respond quickly to sudden price movements and trend reversals,
by combining momentum-based signals with volatility filters.
It is designed to be user-friendly for traders of all experience levels.
✨ Key Features
Normalized DEMA Oscillator: A momentum indicator that normalizes DEMA values on a 0–100 scale, allowing intuitive identification of trend strength
Two-Bar Confirmation Filter: Requires two consecutive bullish or bearish candles to reduce noise and enhance entry reliability
ATR x2 Trailing Stop: In addition to fixed stop-loss levels, a trailing stop based on 2× ATR is used to maximize profits during strong trends
📊 Trading Rules
Long Entry:
Normalized DEMA > 55 (strong upward momentum)
Candle low is above the upper SD band
Two consecutive bullish candles appear
Short Entry:
Normalized DEMA < 45 (downward momentum)
Candle high is below the lower SD band
Two consecutive bearish candles appear
Exit Conditions:
Take-profit at a risk-reward ratio of 1.5
Stop-loss triggered if price breaks below (long) or above (short) the SD band
Trailing stop activated based on 2× ATR to secure and extend profits
💰 Risk Management Parameters
Symbol & Timeframe: Any (AUDUSD 5M example)
Account size (virtual): $3000
Commission: 0.4PIPS(0.0004)
Slippage: 2 pips
Risk per trade: 5%
Number of trades (backtest):534
All parameters can be adjusted based on broker specifications and individual trading profiles.
⚙️ Trading Parameters & Considerations
Indicator: Normalized DEMA Oscillator SD
Parameter settings:
DEMA Period (len_dema): 40
Base Length: 20
Long Threshold: 55
Short Threshold: 45
Risk-Reward Ratio: 1.5
ATR Multiplier for Trailing Stop: 2.0
🖼 Visual Support
The chart displays the following visual elements:
Upper and lower SD bands (±2 standard deviations)
Entry signals shown as directional arrows
🔧 Strategy Improvements & Uniqueness
This strategy is inspired by “Normalized DEMA Oscillator SD” by QuantEdgeB,
but introduces enhancements such as a two-bar confirmation filter and an ATR-based trailing stop.
Compared to conventional trend-following strategies, it offers superior noise filtering and profit optimization.
✅ Summary
The DEMA Trend Oscillator Strategy is a responsive and practical trend-following method
that combines momentum detection with adaptive risk management.
Its visual clarity and logical structure make it a powerful and repeatable tool
for traders seeking consistent performance in trending markets.
⚠️ Always apply appropriate risk management. This strategy is based on historical data and does not guarantee future results.
