Probability-Based Adaptive Detection🙏🏻 PBAD (Probability-Based Adaptive Detection) : adaptive control tool for outliers || novelty detection, made for worst case data & processes, for the highest time complexity O(n^2) compared with the alternatives (would be explained in a sec). Thresholds are completely data driven and axiomatic, no need in provided hyperparameters, are not learned or optimized. The method accepts multiple weights, e.g. both temporal and volatility weights.
Method briefly explained (I can go deeper if any1 asks explicitly):
Performs weighted KDE on initial input data, finds KDE global maximum (mode), creates new “residuals” dataset by centering initial data around this value;
Performs weighted KDE on residuals, uses sigmoid based probability mass targets with increasing probability coverage to construct a set of non-disjoint High Density Intervals (also called HDR, HPD in Bayesian terms);
Uses these intervals to calculate analogs of centralized & standardized moments;
Uses these ^^ moments to construct a set of control thresholds. The scheme used in PBAD is not only based on a central threshold, or on neighboring ones, it utilizes all previous thresholds, gaining more information.
...
The most important part is to understand whether you really need PBAD. Because even tho it seems to be the best one given highest algocomplexity, irl it would work worse in cases when it’s not required by your data.
Here’s the menu (aka taxonomy omg) of methods you can use that would let you make the right choice:
Moment-Based Adaptive Detection (MBAD) :
Norm: L2
Time complexity: original O(n), successfully reduced to O(1) in online version
Use case: default, general purpose
Based on: method of moments (powers of residuals from mean)
Thresholds architecture: centralized
Quantile-Based Adaptive Detection (QBAD):
Norm: L1
Time complexity: O(nlogn)
Use case: either bad data Or process instability
Based on: quantile moments (dyadic percentiles of residuals from median)
Thresholds architecture: chained/recursive/sequential
Probability-Based Adaptive Detection (PBAD):
Norm: L0
Time complexity: O(n^2)
Use case: both bad data And process instability
Based on: probability moments (target probability masses of residuals from KDE mode)
Thresholds architecture: decentralized (for lack of a better name xd, the idea is that these thresholds gain information from the all other threshold and are Not exclusively based on the central or neighboring thresholds)
...
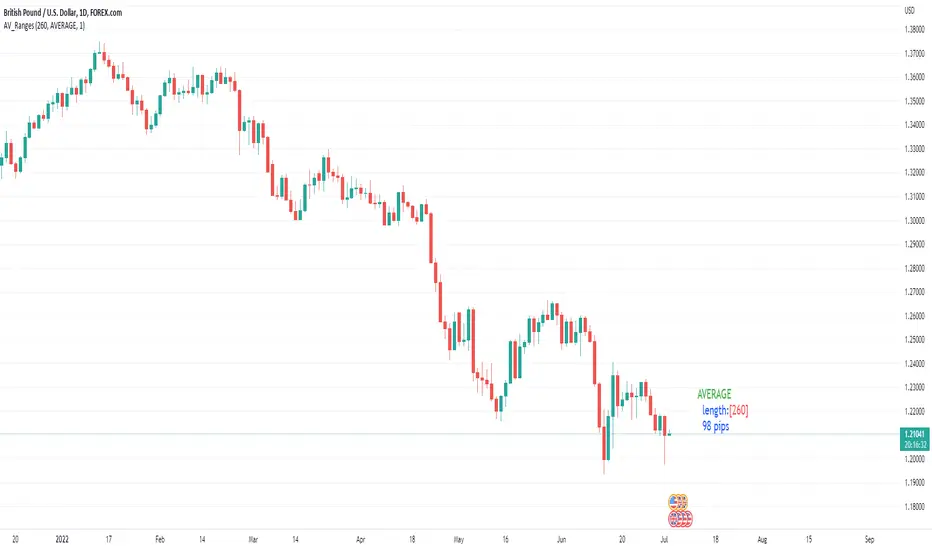
Examples of true use cases:
^^ an appropriate financial instrument to use PBAD
^^ and another one
...
Additional details about how to use it:
Keep the student5 kernel, it’s the best you can do. I added others mostly for comparisons and if you want to use the tool Not for its primary purpose (on a fine data)
“Calculate for N bars” and “Starting at bar N” options allow to reduce calculation period only on the N number of last bars or next bars from a chosen one. It's vital, because calculations here are heavy
Keep plotting offset at 1 (allows to visually compare current bar with the previous threshold values). This is the way it should be done on price data.
HLC3 is the optimal source input, unless you want to use your own better one point estimate of each datapoint (in the best case done by using PBAD itself on OHLC+ values).
In essence it should be used just like MBAD or QBAD, fade/push extensions and limit, fade/push/skip deviations & basis, or other strategies of your. Again, the only reason for 3 methods to exist is to be chosen for according data characteristics.
Btw:
This is the initial version, I don’t consider it perfected tbh, even tho it works as expected, however this method is very situational anyways.
In this script KDE function is modified to ensure the outcoming probabilities Do sum up to 1. I didn’t do this normalization in Weighted KDE Mode script , but there it’s not required since we just need a KDE global max.
see ya
∞
Mode

Average, Median, Mode, Biggest: Pip Range Measures & LabelsApply various simple statistical measures to series of full candle ranges over user input length (in bars).
Choose between AVERAGE, MEDIAN, MODE, BIGGEST.
All calculations derive from the high-low range of a candle.
Default length = 260, the number of daily candles in a year.
MODE is calculated from pip ranges rounded to reasonable increments (to nearest 10pips foreign currencies; to nearest 100 pips for DXY ; nearest $10 for other assets). Best only use MODE for the major FX pairs encoded, and on Daily timeframe .
User input 'unit multiplier' only applies when asset is NOT a major Forex pair (unit and multiplier is auto applied for for major FX pairs).
© twingall
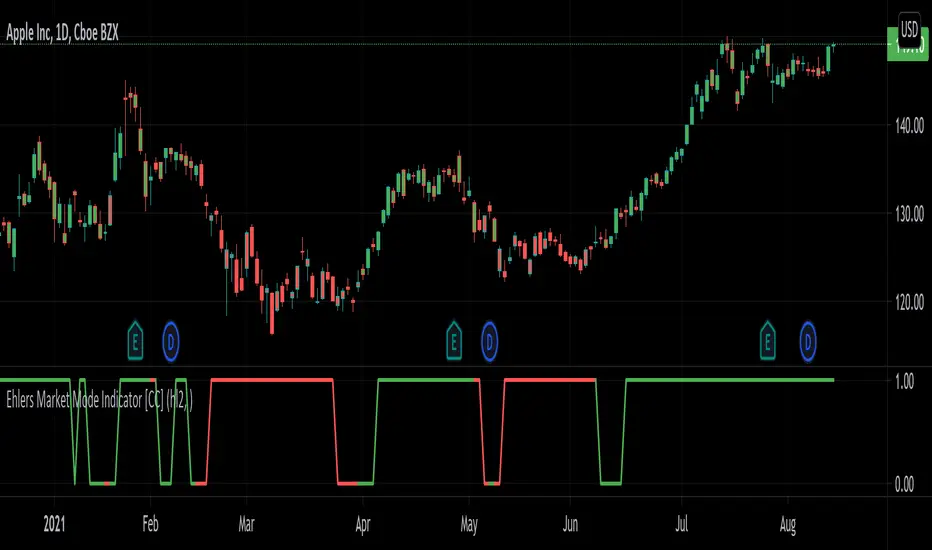
Ehlers Market Mode Indicator [CC]The Market Mode Indicator was created by John Ehlers (Rocket Science For Traders pgs 114-117) and this is a handy tool that will tell you if the market is currently in a cycle or a trend. When the current market is in a cycle or choppy state then the indicator will read 0 and when it is in a trend then it will read 1. He uses some advanced digital signal processing to figure out the current trend and for how long it has been trending. I have included buy and sell signals using the trendline and so buy when the line turns green and sell when it turns red. Let me know if this indicator is useful for you.
Let me know if there are any other indicators you would like to see me publish!
Scalpius Trend & Decreasing VolatilityScalpius Trend & Decreasing Volatility
Identify trends and 'decreasing volatility' trends (strong trends)
Can be used on any market
Setup usually used for 3 timeframes e.g. 2 min, 5 min, 10 min
Contains 2 parts:
I) Trend Indicator
Trends can be defined in several ways,
this indicator defines a trend that uses statistally significant price behaviour that includes the use of the Bollinger Bands
II) Decreasing Volatility Indicator
Trends that are accompanied by decreasing volatility are statistically more likely to go further and longer,
this indicator shows you when 'Decreasing Volalitility Mode' is on and when it turns off using 'pivot highs' and Average True Range
Using this indicator you can filter your trades to 2 types of trades: trend trades and mean reversion trades
I) Trend indicator
-----------------------
Trend Mode ON:
1) A candle touching the Bollinger Band (default settings: length=20, standard deviation=2) (the Bollinger Candle)
2a) (uptrend) A follow-up candle with a higher high and a higher close than the Bollinger Candle
2b) (downtrend) A follow-up candle with a lower low and a lower close than the low of the Bollinger Candle
Examples Trend Mode ON:
Uptrend
Downtrend
Trend Mode OFF when:
1) Price touches the opposite Bollinger Band
2) 20 candles without new high or low
3a) (uptrend) price closes consecutively below 2 EMA's (8 EMA & 21 EMA), above and below again, without making new trend highs
3b) (downternd) price closes consecutively above 2 EMA's (8 EMA & 21 EMA), below and above again, without making new trend lows
Examples Trend Mode OFF:
Uptrend ends because of opposite Bollinger Band touch:
Uptrend ends because of 20 candles without new high:
Uptrend ends because of price consecutively close below, above, below EMA 8 and EMA 21:
Downtrend ends because of opposite Bollinger Band touch:
Downtrend ends because of 20 candles without new low:
Downtrend ends because of price consecutively close above, below, above EMA 8 and EMA 21:
II) Decreasing Volatility Indicator
Decreasing Volatility Mode ON:
1) Trend Mode must be ON
2) Highest or lowest close in the trend must happen on a DOWNTICK in ATR (Average True Range, default setting=14)
Decreasing Volatility Mode OFF:
1) New ATR high in the trend
2) Breaking the pattern of lower lows and lower highs in ATR, aka 'pivot high' or '2 pivot high'
Examples DV Mode ON:
In an uptrend:
In a downtremd:
Examples DV Mode OFF:
In an uptrend:
In a downtremd:
If trend stops, DV Mode stays ON until DV OFF signal comes

Trend Mode Indicator by Kripto MuhtarEn: This indicator is a combination of both linear regression slope and relative strength index. Linear regression slope is calculated, maximum and minimum values of a certain period is determined and a band for slope movement is declared. This bands is a similar of Bollinger Bands. While the slope is refered as speed, the speed of the trend mode is calculated by the movement in the bands. If slope crosses the mid band and sRSI is above 55(50 +filter value), it is accepted that the trend is in rising mode and vice versa. The RSI filter is optional. Blue area is rising trend mode, red area is falling trend mode, silver area is ranging trend mode.
The inputs:
Look back:Calculation period of linear regression slope
Smoothing: Weighted moving average period of the slope
Filter Value: The constant to add/subtract from smoothed RSI on signal line 50.
SRSI Period: Smoothed RSI period
Tr: Bu indikatör, lineer regresyon eğimi ve göreceli güç endeksi indikatörlerinin birleştirilmesi sonucu elde edilmiştir. Öncelikle lineer regresyon eğimi hesaplanmış, belirli bir periyotta maksimum ve minimum değerleri hesaplanmış ve bu sonuçlara göre Bollinger Bantlarına benzeyen bir bant elde edilmiştir. Hız, eğim ile ifade edildiğinden trendin hareket hızı da bant içindeki eğimin hareketine göre belirlenerek trend modu tespit edilmiştir. Eğer eğim çizgisi orta bandı yukarı keser ve sRSI 55(50+filter value) üzerinde ise bu koşul yükselen bir trendi göstermektedir ya da tersi. RSI filtresi opsiyoneldir. Mavi bölge yükselen trend modunu, kırmızı bölge düşen trend modunu, gümüş bölge yatay trend modunu göstermektedir.
Girdiler:
Look back: Lineer regresyon eğiminin hesaplama perioyodu
Smoothing: Eğimin ağırlıklı ortalama periyodu
Filter Value: RSI sinyal çizgisi 50 değerine eklenip çıkartılacak değer
SRSI Period: Yumuşatılmış RSI hesaplama periyodu

CryptoField - TREND Mode indicatorThe CryptoField TREND Mode indicator identifies the trend direction (uptrend or downtrend) and the mode (trending or sideways) of the market.
Uptrend when green
Downtrend when red
Sideways when orange
Trending when green or red
Basically the indicator works like a double moving average, but the algorithm reacts faster on movements and it tolerates "noisy"/volatile markets better which makes it more effective on crypto markets.
It can be applied to strategies or other indicators as a trend direction or market mode filter.

Simple Moving ModeIntroduction
While this indicator is the first of it's type and has never been built before, it is as fundamental as a moving average!
The code complexity was very high which is the primary reason this has not been done before.
The indicator operates in real-time and does not change after it has been plotted as it has been coded in the latest Pinescript V3 meaning that it is fully functional for trading!
Understanding the Simple Moving Mode (SMMO)
By definition, the mode is the value within a set of data that occurs the most often. This makes it different to an average or median. In this context, the “Period” of the moving mode defines how many candlesticks should be used in the data set.
Once the period of data has been defined, the most commonly occurring price within that set must be determined. Unfortunately, the event of any high, low, or closing value of a time stamp being the same is infrequent as many securities trade to the precision of at least two decimal places. To overcome this, the middle value represents each candlestick in the data set and a user defined precision factor has been created labelled, Range .
Setting this value to zero will mean that each value within the period must be the same, while setting this value to “1” will allow for +/-0.5% between the values, making modal occurrences more common. If a mode does not occur within a set, the indicator will automatically plot the candle value.
Indicator Utility
The Simple Moving Mode has many different applications. While price action can be used as a point of reference when trading with the indicator, it is recommended to pair the SMM with other indicators to create points of interest.
Remember, the mode will only change when another more commonly occurring value presents itself. For this reason, the SMM appears as a Step-Line. This indicator works as a perfect representation of a Moving Mode with a defined period. Any indicator that is plotted as a smoothed or curved line is NOT MODAL.
Don't forget to give it a like!
Right now, the script only caters to a period length of 1 to 50. If there is enough interest, I will continue to finish up to a period length of 200 (this will probably be another 1000 lines of code).
Happy Trading!

Function Mean Median Mode V0EXPERIMENTAL:
Request for GLAZ
Functions to handle Mean, Median, Mode Calculation.

Empirical Mode Decomposition The related article is copyrighted material from Stocks & Commodities Mar 2010
You can use in the xPrice any series: Open, High, Low, Close, HL2, HLC3, OHLC4 and ect...
