Currency Strength Meter (8 Majors) — invincible3
📊 Currency Strength Meter (8 Majors) — Description
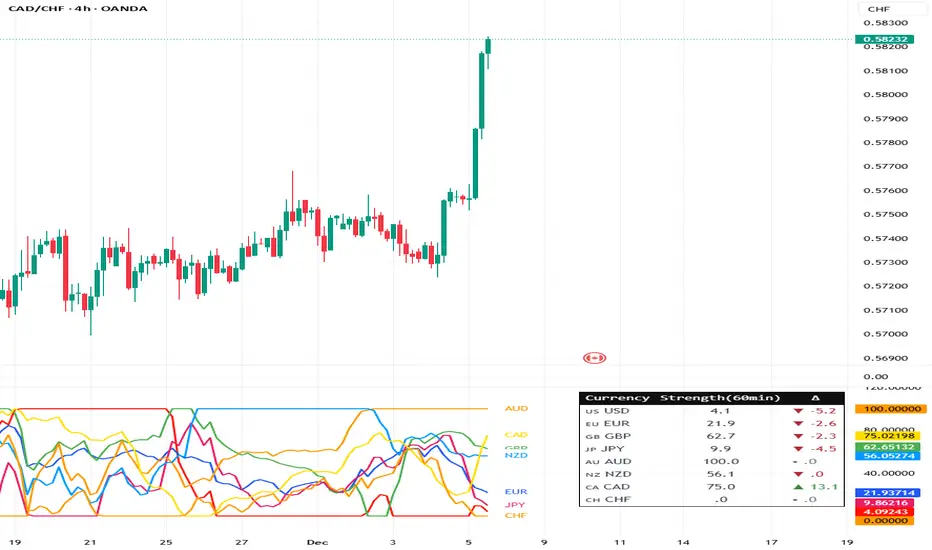
The Currency Strength Meter (8 Majors) calculates the relative performance of the major global currencies — USD, EUR, GBP, JPY, AUD, NZD, CAD, CHF — using aggregated logarithmic returns across all major FX pairs. Strength values are normalized on every bar, allowing users to quickly identify the strongest and weakest currencies at any moment in time.
Each currency’s strength is computed from a basket of 7 related currency pairs, smoothed with EMA, converted into z-scores, and finally normalized to a 0–100 scale for easy comparison.
A built-in table displays the real-time strength for all currencies, along with bar-to-bar delta and directional arrows.
🔶 SETTINGS
General
Broker Prefix
Select the broker symbol prefix used for pair requests (e.g., OANDA:, FX_IDC:).
Calculation Timeframe
Timeframe used to calculate the log returns of currency pairs.
Higher timeframes reduce noise, lower timeframes increase sensitivity.
Lookback Bars
Number of bars (on the calculation timeframe) used to measure logarithmic performance.
Smoothing (EMA)
Smooths currency strength with an EMA of selectable length.
Plot Lines
Option to display the normalized strength of each currency (0–100) directly on the chart.
🔹 Strength Meter Table
Show Table
Enables the on-chart strength meter table.
Show ▲▼ Delta Arrows
Displays directional arrows indicating bar-over-bar momentum:
▲ increasing strength
▼ decreasing strength
• neutral
Size
Controls the table text size (Tiny → Huge).
Layout
Shows:
Currency name & flag
Strength (0–100)
Delta (current – previous bar)
🔶 USAGE
This indicator helps traders quickly determine which currencies are strong and which are weak , and how that strength evolves over time.
Because currencies are evaluated relative to one another , trend strength becomes easier to identify across FX pairs.
Use cases include:
Finding strong vs. weak currency pair combinations
Confirming trend continuation or exhaustion
Identifying momentum shifts through the delta column
Spotting early reversals when strength begins to diverge
Comparing currency performance over multiple timeframes
📈 Example Interpretation
If the USD shows:
Strength = 82
Delta = +3 (▲)
…USD is not only strong, but also getting stronger relative to the previous bar.
If AUD shows:
Strength = 22
Delta = -5 (▼)
…AUD is weak and weakening further.
This makes strong/weak pairing intuitive:
Prefer strong vs weak pairs (e.g., USD/AUD if USD strong & AUD weak)
Avoid neutral or mixed-strength pairs
🔶 DETAILS
Currency Strength Calculation
For each currency pair, the indicator calculates the log-return over the selected lookback window.
Each currency aggregates 7 major related pairs to form a composite strength value.
The aggregated value is smoothed using EMA.
All 8 currencies are converted into z-scores, then normalized to a 0–100 scale for cross-sectional comparison.
A bar-to-bar delta is computed to reveal strengthening or weakening momentum.
This structure ensures the indicator remains stable, consistent, and highly responsive for intraday and higher-timeframe trading.
Meter
Volume Profile Two-Tone - Hit Counter - Meter V1 Volume Profile Two-Tone - Hit Counter - Meter V1
Overview
The Volume Profile Two-Tone - Hit Counter - Meter V1 is a Pine Script v6 indicator for TradingView, designed to visualize buy and sell activity distribution across price levels within a user-defined window or intraday session. It plots a dual-color horizontal histogram showing buying (green) and selling (red) volume intensity, along with optional hit-count numbers and meter overlays. The profile dynamically updates as new bars form, providing an intuitive picture of where market participants are most active.
The enhanced V1 edition introduces persistent hit counts, real-time adaptive row rebuilding, and improved memory management for smoother performance in both rolling-window and session modes.
How It Works
The indicator divides the selected range into rows (price bins) and aggregates trade volume (or tick volume) per bar.
Each bin separately sums up bullish and bearish contributions based on candle direction and delta logic, then draws side-by-side histogram bars:
• Buy Volume (green): Total volume from bullish bars within the bin.
• Sell Volume (red): Total volume from bearish bars within the bin.
A rolling or session-based window determines how many recent bars are analyzed. Value Area (VA), Point of Control (POC), and total hits per bin are computed continuously. The display auto-adjusts as price moves, keeping the profile anchored to the latest visible bars.
Behind the scenes, optimized arrays manage active boxes, lines, and labels for each bin. Functions like ensure_rows() rebuild buffers only when necessary, guaranteeing efficiency without repainting past data. Persistent hit-tracking ensures each price level maintains its count even when temporarily hidden.
Key Features
• Dual-Tone Volume Histogram: Buy/sell split with distinct colors for immediate visual contrast.
• Rolling or Session Profiles: Choose between continuous rolling windows or intraday session resets.
• Persistent Hit Counts: Displays total touches per bin, remaining stored even when bins refresh.
• Adaptive Row Management: Automatic rebuilding when zooming, scrolling, or changing resolution.
• Value Area + POC Detection: Highlights the most active price levels and volume concentration zones.
• Meter Overlay Option: Adds gradient bars or directional meters for quick trend context.
• Performance Optimized: Uses lightweight arrays and cached line handles for minimal CPU load.
• Custom Color Control: Editable buy/sell colors, opacity, row count, and profile width.
• Full Persistence Mode: Profiles remain visually consistent across bar updates without redraw gaps.
What It Displays
The Volume Profile Two-Tone - Hit Counter - Meter V1 presents an adaptive horizontal histogram beside the chart’s candles, revealing how volume is distributed across price.
• Green segments show dominant buying interest; red segments reveal selling pressure.
• POC line identifies the highest-volume price.
• Hit-count numbers quantify how often price traded at each level.
• Optional meters display relative directional strength within the same range.
This visual layering helps traders quickly identify supply/demand zones, balance areas, and developing auction profiles across intraday or multi-session contexts.
Originality
The Pine Script v6 indicator uses efficient array management (array.new_*, array.set, array.get) and native math operations for rendering.
It avoids external dependencies, relying only on built-in TradingView functions like request.security, box.new, line.new, and label.new for dynamic plotting.
Common Ways People Use It
• Scalpers: Study short-term imbalances or high-activity levels to time entries/exits.
• Day Traders: Track evolving session volume and POC migration.
• Swing Analysts: Compare rolling distributions to identify value shifts over multiple days.
• Volume Profilers: Combine with VWAP or order-flow tools for deeper context.
Configuration Notes
Profile Mode: Select Rolling Window (bars) or Session (intraday).
Rows and Width: Default = 72 rows, 44 bars width.
Colors and Opacity: Adjust to match chart theme.
Performance Mode: Choose Accurate or Fast (approximate) for speed control.
Show Hits / Meter: Enable hit-count numbers and gradient meters for added context.
Legal Disclaimer
For informational and educational purposes only—not investment, financial, or trading advice. Past performance does not guarantee future results; trading involves significant risk. Provided “as is,” without warranties. Consult a qualified professional before making decisions. By using, you accept all risks and agree to this disclaimer.

Price Heat Meter [ChartPrime]⯁ OVERVIEW
Price Heat Meter visualizes where price sits inside its recent range and turns that into an intuitive “temperature” read. Using rolling extremes, candles fade from ❄️ aqua (cold) near the lower bound to 🔥 red (hot) near the upper bound. The tool also trails recent extreme levels, tags unusually persistent extremes with a % “heat” label, and shows a bottom gauge (0–100%) with a live arrow so you can read market heat at a glance.
⯁ KEY FEATURES
Rolling Heat Map (0–100%):
The script measures where the close sits between the current Lowest Low and Highest High over the chosen Length (default 50).
Candles use a two-stage gradient: aqua → yellow (0–50%), then yellow → red (50–100%). This makes “how stretched are we?” instantly visible.
Dynamic Extremes with Time Decay:
When a new rolling High or Low is set, the script starts a faint horizontal trail at that price. Each bar that passes without a new extreme increases a counter; the line’s color gradually fades over time and fully disappears after ~100 bars, keeping the chart clean.
Persistent-Extreme Tags (Reversal Hints):
If an extreme persists for 40 bars (i.e., price hasn’t reclaimed or surpassed it), the tool stamps the original extreme pivot with its recorded Heat% at the moment the extreme formed.
• Upper extremes print a red % label (possible exhaustion/resistance context).
• Lower extremes print an aqua % label (possible exhaustion/support context).
Bottom Heat Gauge (0–100% Scale):
A compact, gradient bar renders at the bottom center showing the current Heat% with an arrow/label. ❄️ anchors the left (0%), 🔥 anchors the right (100%). The arrow adopts the same candle heat color for consistency.
Minimal Inputs, Clear Theme:
• Length (lookback window for H/L)
• Heat Color set (Cold / Mid / Hot)
The defaults give a balanced, legible gradient on most assets/timeframes.
Signal Hygiene by Design:
The meter doesn’t “call” reversals. Instead, it contextualizes price within its range and highlights the aging of extremes. That keeps it robust across regimes and assets, and ideal as a confluence layer with your existing triggers.
⯁ HOW IT WORKS (UNDER THE HOOD)
Range Model:
H = Highest(High, Length), L = Lowest(Low, Length). Heat% = 100 × (Close − L) / (H − L).
Extreme Tracking & Fade:
When High == H , we record/update the current upper extreme; same for Low == L on the lower side. If the extreme doesn’t change on the next bar, a counter increments and the plotted line’s opacity shifts along a 0→100 fade scale (visual decay).
40-Bar Persistence Labels:
On the bar after the extreme forms, the code stores the bar_index and the contemporaneous Heat% . If the extreme survives 40 bars, it places a % label at the original pivot price and index—flagging levels that were meaningfully “tested by time.”
Unified Color Logic:
Both candles and the gauge use the same two-stage gradient (Cold→Mid, then Mid→Hot), so your eye reads “heat” consistently across all elements.
⯁ USAGE
Treat >80% as “hot” and <20% as “cold” context; combine with your trigger (e.g., structure, OB, div, breakouts) instead of acting on heat alone.
Watch persistent extreme labels (40-bar marks) as reference zones for reaction or liquidity grabs.
Use the fading extreme lines as a memory map of where price last stretched—levels that slowly matter less as they decay.
Tighten Length for intraday sensitivity or increase it for swing stability.
⯁ WHY IT’S UNIQUE
Rather than another oscillator, Price Heat Meter translates simple market geometry (rolling extremes) into a readable temperature layer with time-aware extremes and a synchronized gauge . You get a continuously updated sense of stretch, persistence, and potential reversal context—without clutter or overfitting.

7-Channel Trend Meter v3🔥 7-Channel Trend Meter – Ultimate Trend Confirmation Tool 💹
Purpose: Supplementary indicator used as confirmation
The 7-Channel Trend Meter offers an all-in-one confirmation system that combines 7 high-accuracy indicators into one easy-to-read visual tool. Say goodbye to guesswork and unnecessary tab-switching—just clear, actionable signals for smarter trades. Whether you're trading stocks, crypto, or forex, this indicator streamlines your decision-making process and enhances your strategy’s performance.
⚙️ What’s Inside The Box?
Here is each tool that the Trend Meter uses, and why/how they're used:
Average Directional Index: Confirms market strength ✅
Directional Movement Index: Confirms trend direction ✅
EMA Cross: Confirms reversals in trend through average price ✅
Relative Strength Index: Confirms trend through divergences ✅
Stochastic Oscillator: Confirms shifts in momentum ✅
Supertrend: Confirms trend-following using ATR calculations ✅
Volume Delta: Confirms buying/selling pressure weight by finding differences ✅
🧾 How To Read It:
🟨 Bar 1 – Market Strength Meter:
Light Gold 🟡: Strong market with trending conditions.
Dark Gold 🟤: Weakening market or consolidation—proceed with caution.
📊 Bars 2 to 7 – Trend Direction Confirmations:
🟩 Green: Bullish signal, uptrend likely.
🟥 Red: Bearish signal, downtrend likely.
💯 Why it's helpful to traders:
✅ 7 Confirmations in 1 View: No need to flip between multiple charts.
✅ Visual Clarity: Spot trends instantly with a quick glance.
✅ Perfect for Entry Confirmation: Confirm trade signals before pulling the trigger.
✅ Boosts Your Win Rate: Make data-backed decisions, not guesses.
✅ Works Across Multiple Markets: Stocks, crypto, forex—you name it 🌍.
🤔 "What's with the indicator mashup/How do these components work together? 🤔
The 7-Channel Trend Meter is designed as an original and useful tool that integrates multiple indicators to enhance trading decisions, rather than merely combining existing tools without logical coherence. This strategic mashup creates a comprehensive analysis framework that offers deeper insights into market conditions by capitalizing on each component's unique strengths. The careful integration of seven indicators creates a unified system that eliminates conflicting signals and enhances the decision-making process. Rather than simply merging indicators for the sake of it, the 7-Channel Trend Meter is designed to streamline trading strategies, making it a practical tool for traders across various markets. By leveraging the combined strengths of these indicators, traders can act with greater confidence, backed by comprehensive data rather than fragmented insights. Here’s how they synergistically work together:
Average Directional Index (ADX) and Directional Movement Index (DMI): The reason for this mashup is because ADX indicates the strength of the prevailing trend, while the DMI pinpoints its direction. Together, they equip traders with a dual framework that not only identifies whether to engage with a trend but also quantifies its strength, allowing for more decisive trading strategies.
EMA Cross: The reason for this addition to the mashup is because this tool signals potential trend reversals by identifying moving average crossovers. When combined with the ADX and DMI, traders can better differentiate between genuine trend shifts and market noise, leading to more accurate entries.
Relative Strength Index (RSI) and Stochastic Oscillator: The reason for this mashup is because by using both momentum indicators, traders gain a multifaceted view of market dynamics. The RSI assesses overbought or oversold conditions, while the Stochastic Oscillator confirms momentum shifts. When both agree with the trend signals from the DMI, it enhances the reliability of reversal or continuation strategies.
Supertrend: The reason for this addition to the mashup is because as a trailing stop based on market volatility, the Supertrend indicator works hand-in-hand with the ADX’s strength assessment, allowing traders to ride strong trends while managing risk. This cohesion prevents premature exits during minor pullbacks.
Volume Delta: The reason for this addition to the mashup is because integrating volume analysis helps validate signals from the price action indicators. Significant volume behind a price movement reinforces the likelihood of its continuation, ensuring that traders can act on well-supported signals.
🔍 How it does what it says it does 🔍
While the exact calculations remain proprietary, the following outlines how the components synergistically work to aid traders in making informed decisions:
Market Strength Assessment: Average Directional Index (ADX)
This component is used as confirmation by measuring the strength of the market trend on a scale from 0 to 100. A reading above 20 generally indicates a strong trend, while readings below 20 suggest sideways movement. The Trend Meter flags strong trends, effectively helping traders identify optimal conditions for entering positions.
Trend Direction Confirmation: Directional Movement Index (DMI)
This component is used as confirmation by distinguishing between bullish and bearish trends by evaluating price movements. This combination allows traders to confirm not only if a trend exists but also its direction, informing whether to buy or sell.
Trend Reversal Detection: Exponential Moving Average (EMA) Cross
This component is used as confirmation by calculating two EMAs (one shorter and one longer) to identify potential reversal points. When the shorter EMA crosses above the longer EMA, it signals a bullish reversal, and vice versa for bearish reversals. This helps traders pinpoint optimal entry or exit points.
Momentum Analysis: Relative Strength Index (RSI) and Stochastic Oscillator
These components are used as confirmation by providing insights into momentum. The RSI assesses the speed and change of price movements, indicating overbought or oversold conditions. The Stochastic Oscillator compares a particular closing price to a range of prices over a specified period. This helps identify whether momentum is slowing or speeding up, offering a clear view of potential reversal points. When both the RSI and Stochastic Oscillator converge on signals, it increases the reliability of those signals in trading decisions.
Volatility-Based Trend Following: Supertrend
This component is used as confirmation by utilizing Average True Range (ATR) calculations to help traders stay in momentum-driven trades by providing dynamic support and resistance levels that adapt to volatility. This enables better risk management while allowing traders to capture stronger trends.
Volume Confirmation: Volume Delta
This component is used as confirmation by analyzing buying and selling pressure by measuring the difference between buy and sell volumes, offering critical insights into market sentiment. Significant volume behind a price movement increases confidence in the sustainability of that move.
🧠 Pro Tip:
When all 7 bars line up in green or red, it’s time to take action: load up for a confirmed move or sit back and wait for market confirmation. Let the Trend Meter guide your strategy with precision.
Conclusion:
Integrate the 7-Channel Trend Meter as useful confirmation for your TradingView strategy and stop trading like the average retail trader. This tool eliminates the noise and helps you stay focused on high-confidence trades.

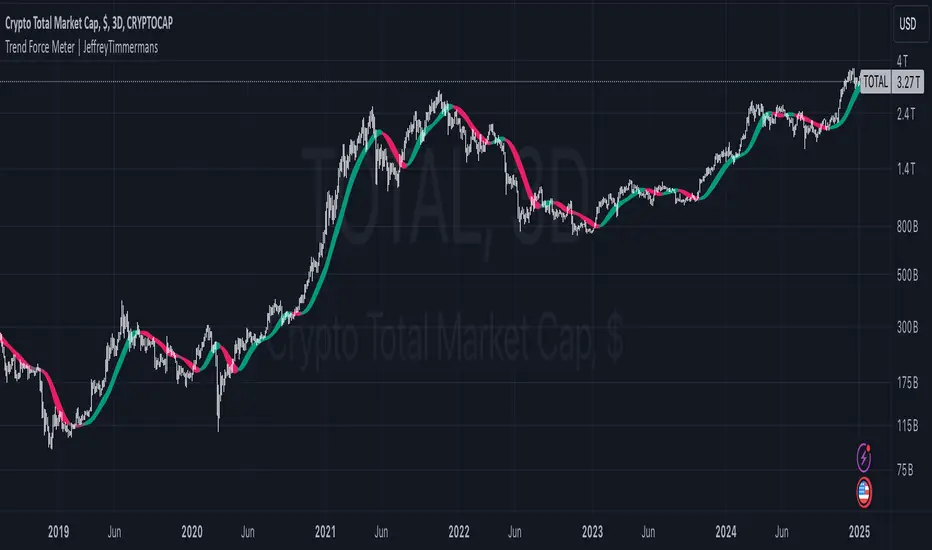
Trend Force Meter | JeffreyTimmermansTrend Force Meter
The "Trend Force Meter" is an innovative trading tool designed to visualize trend strength and provide precise signals for identifying market dynamics. By combining the Hull Moving Average (HMA) with the Simple Moving Average (SMA), it delivers a comprehensive analysis of trend forces and directions. With customizable smoothing, low-pass filtering, and an advanced color-coded display, this indicator is a valuable addition to any trader's toolkit.
Overview
The Trend Force Meter uses a unique approach to trend analysis by calculating the difference between smoothed HMA and SMA values. This difference is normalized and converted into a visually intuitive gradient to represent bullish and bearish conditions. The indicator also incorporates features for noise reduction and enhanced visualization.
Key Features
Dual Moving Averages
Hull Moving Average (HMA): Provides a highly responsive measure of trend direction and strength.
Simple Moving Average (SMA): Offers a stable and reliable long-term trend baseline.
Customizable Smoothing
Enable/Disable Smoothing: Adjust the sensitivity of the HMA and SMA calculations.
Smoothing Length: Fine-tune the smoothing parameters to match your trading style, balancing between responsiveness and stability.
Low-Pass Filtering
Noise Reduction: Optional low-pass filter reduces market noise, providing clearer trend signals.
Filter Length: Adjustable parameter for fine control over the noise reduction level.
Gradient-Based Visualization
Dynamic Color Coding: Bullish trends are displayed in shades of green, while bearish trends appear in shades of red, providing immediate visual clarity.
Strength Meter: A gradient-based strength meter quantifies the intensity of the current trend, from weak to strong.
Trend Strength Normalization
Normalizes trend strength over a configurable period, ensuring consistent and meaningful readings across various market conditions.
Alerts
Bullish Trend Alert: Notifies when the trend transitions to a bullish phase.
Bearish Trend Alert : Signals when the trend turns bearish.
Enhanced Functionality
Trend Strength Gauge
Displays a real-time strength gauge that visualizes the trend intensity, allowing traders to assess the market at a glance.
Automatically adjusts to reflect normalized trend values, ensuring accuracy across different timeframes and volatility conditions.
Visual Gradient
A refined gradient coloring system dynamically adjusts based on trend direction and intensity, enabling traders to easily interpret market sentiment.
Advanced Customization
Length Settings: Fine-tune HMA and SMA lengths to match specific trading strategies.
Smoothing Options: Toggle smoothing and low-pass filtering on or off as needed.
Gradient Color Range: Provides flexible options for customizing the visual display.
Use Cases
Trend Analysis: Quickly identify the direction and strength of market trends to make informed trading decisions.
Momentum Confirmation : Use the gradient and strength meter to validate potential breakout or reversal scenarios.
Noise Reduction: Employ the low-pass filter to focus on meaningful trends while ignoring short-term market fluctuations.
How It Works
Calculate HMA and SMA: The indicator computes smoothed HMA and SMA values.
Difference Extraction: The difference between the smoothed HMA and SMA forms the core trend signal.
Optional Filtering: Low-pass filtering reduces noise, enhancing the clarity of trend signals.
Normalization: The difference is normalized over the selected period, ensuring consistent scaling.
Visualization: A color-coded gradient and trend strength gauge display the trend’s intensity and direction.
Customization Options
MA Lengths: Adjust the calculation periods for HMA and SMA.
Smoothing and Filtering: Enable or disable smoothing and filtering to refine the signal output.
Color Palette: Choose custom colors to align with personal preferences or trading environments.
Conclusion
The Trend Force Meter is an invaluable addition to any trader’s toolkit, combining cutting-edge techniques with intuitive visuals to make trend analysis more accessible and actionable. Its flexibility and precision cater to various trading strategies, ensuring traders stay ahead of market movements.
This script is inspired by "VanHels1ng" . However, it is more advanced and includes additional features and options.
-Jeffrey
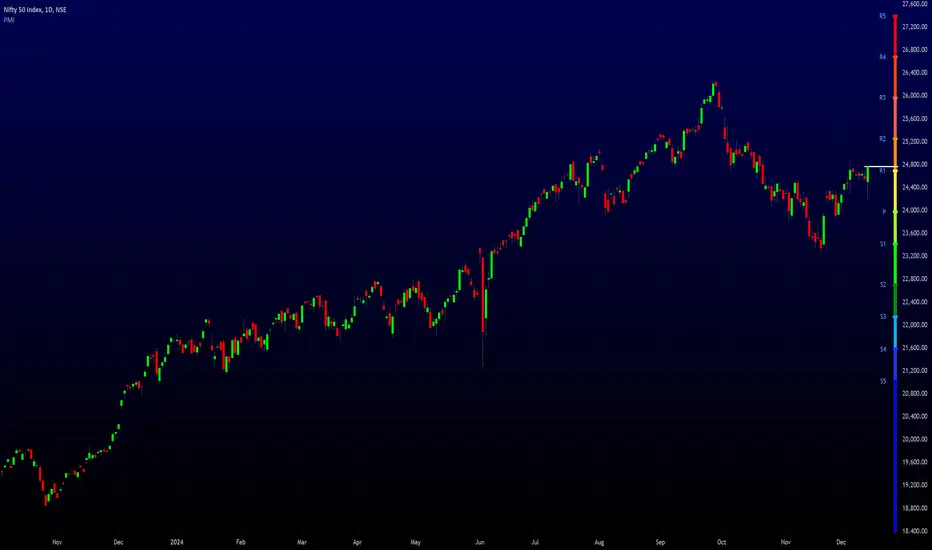
Pivot MeterThe "Pivot Meter" is a indicator designed to plot pivot levels (support and resistance) directly on the chart. It offers two types of pivot calculations STANDARD and FIBONACCI, allowing traders to choose their preferred method. Here's an overview of its features and functionalities:
________________________________________
Key Features
1. Pivot Types:
o STANDARD: Traditional calculation based on the previous period's high, low, and close.
o FIBONACCI: Uses Fibonacci ratios to calculate support and resistance levels.
2. Dynamic Time Frame Adjustment:
o The indicator adjusts its calculations based on the chart's timeframe, aligning pivot calculations with appropriate periods.
3. Pivot Levels:
o Resistance Levels (R1 to R5): Five resistance levels calculated based on the selected pivot type.
o Support Levels (S1 to S5): Five support levels corresponding to the pivot type.
o Central Pivot (P): The base pivot level for reference.
4. Visualization:
o All pivot levels are plotted as coloured horizontal bands on the chart for easy identification.
o Colours range from warm tones (red for higher resistance levels) to cool tones (blue for lower support levels).
o Thickness and styling make these levels visually prominent.
5. Real-Time Price Line:
o A dynamically updating line marks the current price, with customizable colour and width for visibility.
6. Labels for Levels:
o Labels are placed next to each pivot level for identification (e.g., R1, S1, Pivot).
o Labels dynamically adjust their position with the chart’s bar progression.
________________________________________
Purpose
This indicator helps traders identify potential reversal points, support and resistance levels, and critical price zones. It is especially useful for:
• Day Traders: Quickly assess key levels for short-term trades.
• Swing Traders: Spot significant support/resistance zones over longer periods.
• Trend Followers: Use pivot levels to confirm breakouts or bounces.
________________________________________
Customization Options
• Pivot Type Selection: Choose between STANDARD and FIBONACCI.
• Price Line Colour: Customize the colour of the current price line for better integration with your chart setup.
________________________________________
Technical Details
• Security Function: Data from higher timeframes is accessed using request.security, ensuring accurate and multi-timeframe pivot calculations.
• Dynamic Labelling: Labels update their positions with every new bar to remain synchronized with the latest data.
________________________________________
Usage
Traders can add this indicator to their TradingView charts to monitor critical levels and strategize entries, exits, and stop-loss placements based on the proximity to these pivots. The dual pivot calculation methods make it versatile for diverse trading styles.
MarketVision Screener█ OVERVIEW
• Screens 36 Assets at Once
• This Screener is Unique in that it turns my MarketVision series of Indicators Into a Complete Trading System
• To help you Automatically find Possible Turning Points in the Market the Following MarketVision Parameters are Displayed
o Linear Regression Direction and whether Price can be considered Over Bought / Sold according to the Linear Regression Channel (This works exceptionally well if used in confluence with manually drawn Fibonacci retracements)
o RSI value and Over / Very Over Bought / Sold condition
o Trend Meter – Shows Condition of the Trend Meter and its associated Trend / Money Flow Bar
o Wave Trend Crossing Condition taken from MarketVision B or Cipher B
o Wave Trend Divergences
o Super Trend Direction – Not a usual MarketVision parameter but it helps
• Furthermore you can choose where abouts on your chart you want the Screener displayed – this allows for multiple Screeners on one chart
█ HOW TO USE IT
• Look for Confluence between different parameters,
• For example Linear Regression Pointing Down and Price Over Bought according to both RSI and Linear Regression Channel, this is where you can look for maybe a Wave Trend cross down or a specific Candle Stick Pattern on you Chart with a Divergence
• Other confluences that work well are Trend Meter cross at the same time as a Wave Trend cross – Look for This Symbol "⯅ ⬱🡅⇶" or "⬱🡇⇶ ⯆"
• There are many possibilities the rest is up to you and your Trading Style / System
• Feel the Power
█ LIMITATIONS
• Can Not Set Alerts at This Stage – This is for a future Update or Script
• Slow Loading Time – As this is a rather long script Loading time is dependent on Internet Speed and your Computer Hardware
█ CREDITS
• Tradingview for the Pine Script Engine found under the hood of these amazing scripts
• QuantNomad and Others for their pioneering work making it possible to bring these sorts of advanced scripts to life
█ DISCLAIMER
• Not Financial Advice BUT
• Always use Proper Risk / Money Management – Never Risk more than you can Afford to Lose, Preferably not more than 1% - 2% of your Account
• Do Not FOMO or Revenge Trade
• Please remember that Past Performance may not be indicative of future results
Due to various factors, including changing market conditions, the strategy may no longer perform as well as in historical Back Testing

Signals Pirate™ Trend MeterSignalsPirate™ Trend Meter gives a complete and all in one insight into the current price action trend and its underlying strength for any asset on any timeframe!
This tool utilise a multitude of tried and tested technical indicators to dynamically and accurately determine the current trend strength of a given asset. Depending on the level of trend strength, this indicator will collate all data to print 5 ‘Points’ with either a green or red colour. This point based system allows for simple and easy understanding of the current direction of price.
The ‘Points’ are each calculated independently to ensure versatile and dependable results. The calculation of each point being bullish or bearish is down to what criteria price action is currently fulfilling. If any of the criteria is in a ‘neutral’ zone and neither bullish (green) or bearish (red), the point will remain its previous colour until a trend change occurs. How the points are calculated:
- If price is above key moving averages on multiple time frames, 1 point is created green. If price is below key moving averages, the point will be red.
- If SOME key moving averages are currently in order to the upside (for example, 9ma is above the 21ma, which is below the 50ma etc), a green point is created – vice versa for a red point.
- If ALL key moving averages are currently in order to the upside (for example, 9ma is above the 21ma, which is above the 50ma etc), a green point is created – vice versa for a red point.
- If key momentum/strength indicators (RSI & Stoch) are bullish, a green point is created – vice versa for a red point.
- If price is above key levels of S/R (calculated through price action levels and pivot points), a green point is created – vice versa for a red point.
You can then set the amount of points needed for a signal to be generated, by default this is set to 5 so all trend identification criteria need to be bullish or bearish for a signal., but this could be set to 4 for example for faster signals. You can also decide whether to be alerted every time the conditions are met, or just when the bias flips entirely from bullish to bearish (green to red) and vice versa.
The default settings are the best settings we’ve found so far but you can change them to build your own unique trading strategy. We’d recommend experimenting with these values to find the best results for the asset you are trading, and your own personal trading style.
Direction for use:
1. Use on any asset class and time frame.
2. Adjust the ‘Trend Strength for Signal’ value.
3. Enter Long on Green ‘Bullish’ signal after candle close, enter Short on Red ‘Bearish’ signal after candle close.
4. Exit position on opposite entry signal, for example if you’re currently in a Long position and a Red ‘Bearish’ signal is printed, close your Long position at the candle close, even if you do not plan on shorting and vice versa.
As mentioned previously, this is a trend identification system that dynamically operates to function with superior accuracy regardless of what you’re trading. But with the level of customisation available, this can easily be fine tuned to accommodate scalping, reversal trading, or even long term investing.
We hope you love this package, and it takes your trading and investing to the next level. Please let us know if you have any questions or queries regarding the logic behind the bundle, or if you have any suggestions for improvements etc. We love your feedback and are constantly striving to continuously improve!

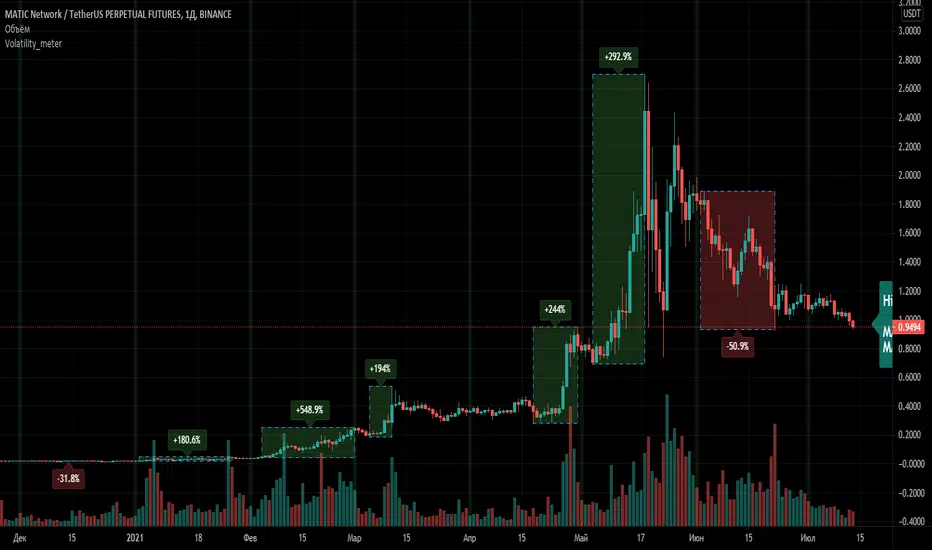
Volatility_meterThis script allows you to quickly estimate the maximum drawdown/growth level in percent on the history. The indicator is designed for TF=1D and is suitable for any instrument.
In the settings, you can select a resolution of 1 month or 1 week in size, the indicator will mark the interval you selected on the chart and calculate the maximum price change for this period.
The text value of the growth and fall extremes for the entire available period is also displayed.
This indicator will be especially useful for those who use grid trading to correctly assess risks and form a safe price corridor when placing purchase orders.
If you have any questions, you can write to me in private messages or in Telegram (see contacts in my signature).
--------------------------
Данный скрипт позволяет быстро оценить максимальный уровень просадки/роста в процентах на истории. Индикатор предназначен для ТФ=1Д и подходит для любого инструмента.
В настройках можно выбрать резолюцию размером в 1 месяц или в 1 неделю, индикатор разметит выбранный вами интервал на графике и расcчитает максимальное изменение цены за этот период.
Также отображается текстовое значение экстремумов роста и падения за весь доступный период.
Этот индикатор будет особенно полезен для тех, кто использует сеточную торговлю, чтобы правильно оценить риски и сформировать безопасный ценовой коридор при выставлении ордеров на покупки.
По любым вопросам Вы можете написать мне в личные сообщения или в Telegram (смотри контакты в моей подписи).
Normalized Oscillators Spider Chart [LuxAlgo]This indicator displays a spider chart overlaid on the user’s current chart allowing the visualization of information given by various normalized oscillators. It is possible to customize the spider chart by hiding certain oscillators from within the settings which removes their corresponding spokes from the chart.
Users can control the length settings of each oscillator individually or use a global length setting that applies to every oscillator. An additional meter element is displayed and aims to give the overall sentiment returned by the oscillators. This can also be used to gauge whether the market is trending or ranging.
This is a relatively simple application of a spider chart but can prove to be useful to some users.
1. Settings
RSI: Displays the Relative Strength Index spoke on the spider chart, includes the length setting on the right of the toggle.
%K: Displays the Stochastic Oscillator "%K" spoke on the spider chart, includes the length setting on the right of the toggle.
COR: Displays the Correlation Oscillator spoke on the spider chart, includes the length setting on the right of the toggle.
MFI: Displays the Money Flow Index oscillator spoke on the spider chart, includes the length setting on the right of the toggle.
WPR: Displays the Williams Percent Rank oscillator spoke on the spider chart, includes the length setting on the right of the toggle.
%UP: Displays the percentage of upward variations spoke on the spider chart, includes the length setting on the right of the toggle.
CMO: Displays the Chande Momentum Oscillator spoke on the spider chart, includes the length setting on the right of the toggle.
AOS: Displays the Aroon oscillator spoke on the spider chart, includes the length setting on the right of the toggle.
Global Oscillators Length: Determines whether all oscillators should use the same length settings, determined by the setting on the right of the toggle.
1.1 Style Settings
Spider Chart Length: Determines the horizontal width of the spider chart.
Spider Chart Offset: Offset between the most recent bar and the left extremity of the spider chart.
2. Usage
A spider chart can be a very useful visualization tool when it comes to seeing the individual characteristics of various variables at the same time.
Here, the tool can give a general sentiment on the direction of the trend without adding each indicator to your chart. It is also possible to determine when an oscillator is considered overbought or oversold with this indicator.
The dashed line represents the central value for each oscillator.
Disabling any of the oscillators from the settings will return a spider chart using fewer spokes.
The script also displays a meter that can be used to determine the overall sentiment given by all oscillators. This metric is based on the average value between each oscillator. An overall sentiment closer to 50 would indicate a ranging market.

Price/Volume Trend MeterAnother simple indicator from the sweet indicator series, This is a combination of the Volume and Price Trend Meter indicators combined (Links below) into one indicator called PVTM (Price Volume Trend Meter).
PVTM measures the strength of price and volume pressure on a histogram.
The indicator sums up all green candles price and volume and red candles price and volume over a specific period of bars and plots based on Price summed value. The result will look similar to Price Trend Meter with the benefit of trying to filter out more noise.
Use this indicator to identify the increasing asset of price and volume with the green candles (Close is higher than open) and decreasing of price and volume with the red candles (Close is lower than open).
======= Calculation ==========
Bright Green Color Column: Total summed up Price and Volume are higher than 0.
Bright Red Color Column: Total summed up Price and Volume are Lower than 0.
Weak Green Color Column: Conflict between Price and Volume (One positive and one negative) so we continue based on previous color .
Weak Red Color Column: Conflict between Price and Volume (One positive and one negative) so we continue based on previous color.
======= Price/Volume Trend Meter Colors =======
Green: Increasing buying pressure.
Weaker Green: Declining Buying pressure (Possible Sell Reversal).
Red: Increasing selling pressure.
Weaker Red: Declining Selling pressure (Possible Buy Reversal).
Other sweet indicators that this indicator is based on:
Volume Trend Meter:
Price Trend Meter:
Like if you Like and Follow me for upcoming indicators/strategies: www.tradingview.com

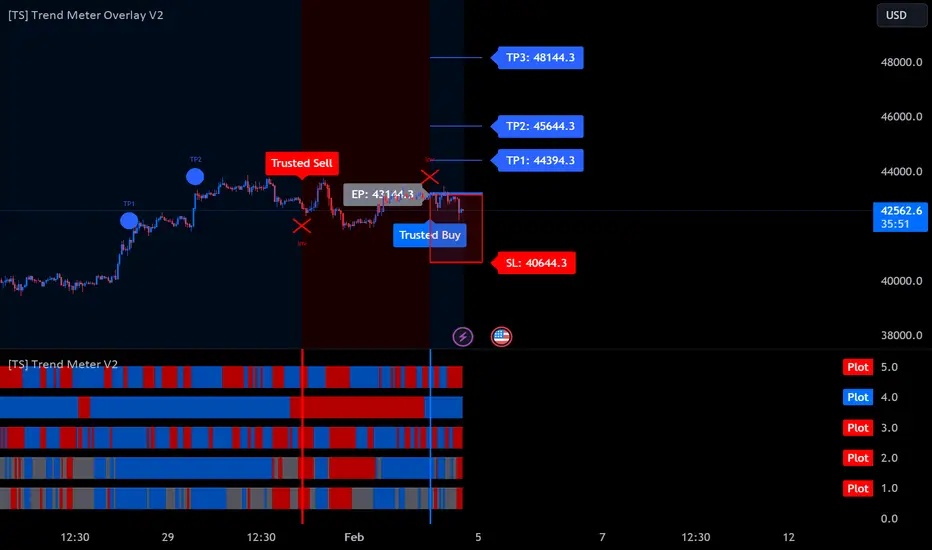
[TS] Trend MeterHOW IT WORKS
The meter consists of 5 Different Trend Indicators: Gann HILO Activator, ParabolicSAR, our custom TS Oscillator, our non-repainting/non-lagging Higher Timeframe Trend Indicator, plus our Market Sentiment Indicator
HOW TO USE
1. When the majority of the meters turn green, it is a sign the market is heading up.
2. When the majority of the meters turn red, it is a sign the market is going down.
- The user has the option to select how many meters must allign for a signal to show
- The indicator also has the ability to setup Alerts when the selected number of meters turn green or red. This feature is also signaled by the red or green vertical lines.
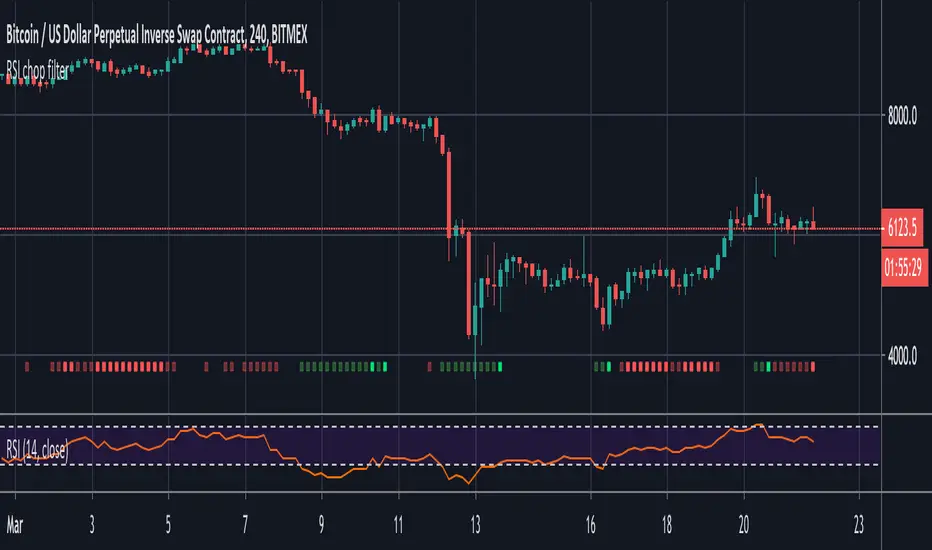
RSI chop filterThis demonstrates how you might filter your signals using RSI, but the same technique could be applied to Stochastic RSI and any other oscillator that has overbought and oversold conditions.
Use it as a visual indicator to determine when to enter a trade:
Red = Chop zone (no trade)
Bright red = Tight chop (dear god stay away)
Green = Overbought or oversold (signals permitted)
Bright green = Crossing up/down (take the trade)
To apply the filter, simply add 'and not chop' after your conditions as seen in the commented out example.
Trend MeterUse as a supplementary Indicator to confirm your entries, but it is as good on it's own.
When you first apply the indicator to your chart make sure you shrink it down It looks a lot better that way
The indicator consists of 3 different Trend Meters and a Trend Bar which are used to confirm trend
As a bonus Possible Momentum Setup entries based on Stochastics are marked as well, these are very Powerful however please use with caution
How to Use
The more Trend meters are lit up the better
Look for Support or Resistance Levels for price to be attracted to
Find confluence with other indicators
Enter Long above the Setup Bar
Enter Short Below the Setup Bar

BOSS EMA Trend Meter PRO With Alerts BOSS PRO TRADING SYSTEM INDICATORS
Bullish Uptrend
To determine bullish uptrend there must beat least 2 green squares on all three trend meters. This is a great predictor that a uptrend is imminent. You can set alerts for top two meters being green as well as all 3 meters being green
Bearish Downtrend
To determine bearish downtrend there must beat least 2 red squares on all three trend meters. This is a great predictor that a downtrend is imminent. You can set alerts for top two meters being red as well as all 3 meters being red.
Purchase Here: bosscripts.com

[HLTTM] Hiubris Long-Term Trend MeterThis is a FREE script meant to be used as an auxiliary Indicator to confirm your entries, but it is as good on it's own.
HOW IT WORKS
The indicator consists of 3 different Trend meters, ranked from top to bottom, according to their Trend detection accuracy. The bottom Meter is using 3 different candle lengths in order to enhance it's displayed accuracy.
HOW TO USE
1. When the majority of all three meters turn green, it is a sign the market is heading up.
2. When the majority of all three meters turn red, it is a sign the market is going down.
- The indicator also has the ability to setup Alerts when all three meters turn green or red. This feature is also signaled by the red or green vertical lines.
- It has 2 Trend Length Settings, that you can adjust depending on your trading style
NOTES
We used the best combination of indicators so you can be sure that, no matter what ticker you're trading (Forex, Stocks or Crypto) - when you get a full green, or full red meter, the price is 100% trending in that direction!
- This indicator does NOT Repaint! In fact, none of my published indicators repaint!

BOSS EMA Trend MeterTHE BEST FOREX, BINARY OPTIONS, AND CRYPTO INDICATORS FOR TRADINGVIEW.COM
Bullish Uptrend
To determine bullish uptrend there must beat least 2 green squares on all three trend meters. This is a great predictor that a uptrend is imminent.
Bearish Downtrend
To determine bearish downtrend there must beat least 2 red squares on all three trend meters. This is a great predictor that a downtrend is imminent.
For best results use with Boss Bull/Bear Stochastic RSI
If you get a buy signal on Boss Bull/Bear Stochastic RSI and trend meter has a minimum of 2 green squares then this is a great buy/long entry.
If you get a sell signal on Boss Bull/Bear Stochastic RSI and trend meter has a minimum of 2 red squares then this is a great sell/short entry
Available at bosscripts.com
Website bosscripts.com

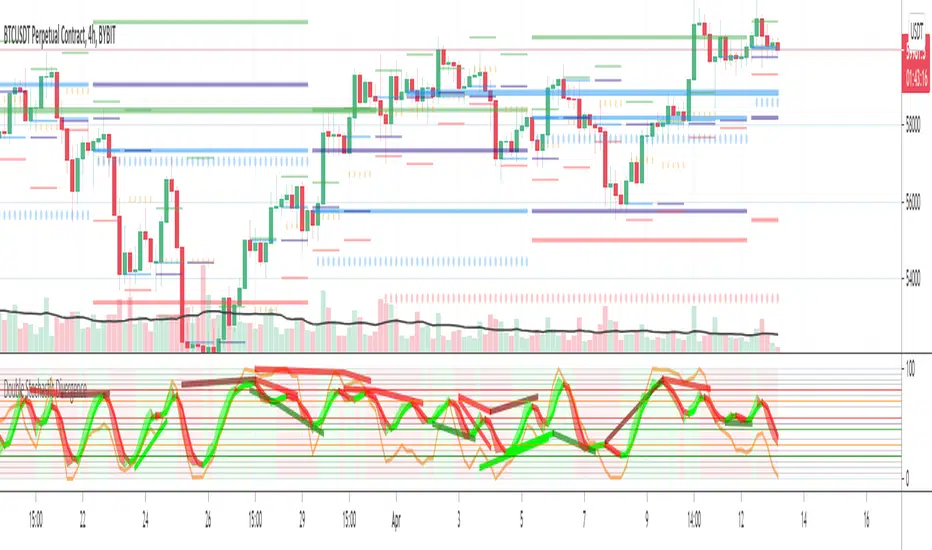
Double Stochastic DivergenceSame as my protected script but you can now see the code
This Study plots divergences and overlays a second %K as a fractal and changes the color of %D for the non fractal
Option to use Stochastic RSI for Fractal
Background Shading according to trend
Feel Free to change the indicator values to suit your style / system
The divergence script is thanks to @RicardoSantos, I've just adjusted it to suite my indicator
Remember that divergences work best when traded with the trend or very late in a trend when going against the trend
Common value for %K is 5, I have chosen 3 as it gives faster entries when using multiple time frames
If you are not using a momentum indicator as a trailing stop and using only cycle indicator
then I would recommended %K be 4 for exits
Double Stochastic DivergenceThis Study plots divergences and overlays a second %K as a fractal and changes the colour of %D for the non fractal
Feel Free to change the indicator values to suit your style / system
The divergence script is thanks to @RicardoSantos, I've just adjusted it to suite my indicator
Remember that divergences work best when traded with the trend or very late in a trend when going against the trend
Common value for %K is 5, I have chosen 3 as it gives faster entries when using multiple time frames
If you are not using a momentum indicator as a trailing stop and using only cycle indicator
then I would recommended %K be 4 for exits
