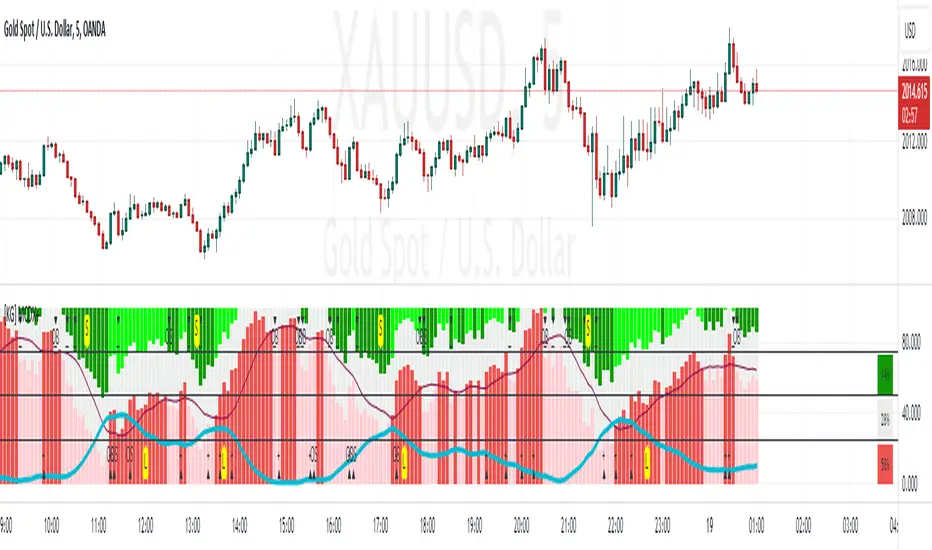
Smart Money Flow Pro (Dual Mode: MCD & MCDX) MI02bSmart Money Flow Pro (MI02b) indicator shows Buyer / Seller activities by calculating series of Price & Volume data, over a certain period of time.
It analyses Institutional fund possible behavior from the pool of data derived from price volume movement every trading day.
RED bar represents percentage of stock holders are currently in profit.
Purple line is RED bar's moving average.
Green bar represents percentage of stock holders are currently in loss.
Lime Green line is Green bar's moving average.
Yellow bar represents percentage of daily traders (buy & sell at the same day).
Pink line is Yellow bar's moving average.
RED bar > 50% shows institution fund has in control, uptrend is likely easier to continue.
BLUE bar > 50% shows retailer fund is stucked inside, downtrend is likely easier to continue.
Crossing of moving average lines indicates changing of trend (reversal sign):
1) Purple line up-crossed Green line - UPTREND
2) Green line up-crossed Purple line - DOWNTREND
Smart Money Flow Pro includes 6 Long/Buy signals (🔺, ⭕️, 👍, 😊, 📈, 🔷)
Each signals comes with individual alert setting.
Disclaimer:
This script indicator is solely for the purpose of education / opinion sharing only, and should not be construed as investment advice or recommendations to buy or sell any security.
Get your trade advise from a legit broker, you are responsible on your own trade.
Thank you.
Mcdx
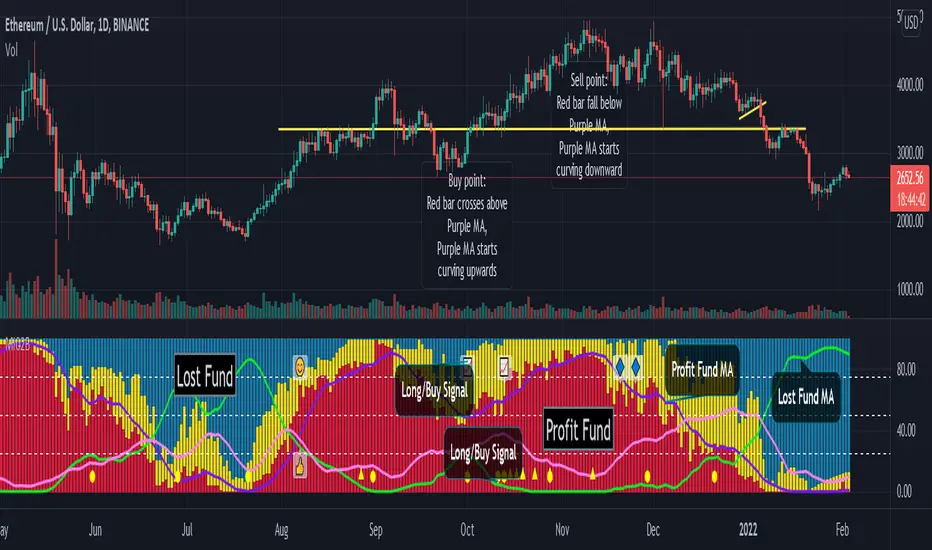
Profit Loss Fund Template ( PLFT / MCDX )Profit Loss Fund Template indicator shows Buyer / Seller activity by calculating series of daily Price & Volume data, over a certain period of time.
It helps to analyse Institution fund's possible behavior with pool of data derived from price volume movement.
RED bar represents percentage of stock holders are currently in profit.
Purple line is RED bar's moving average.
BLUE bar represents percentage of stock holders are currently in loss.
Green line is BLUE bar's moving average.
RED bar > 50% shows institution fund has in control, uptrend is likely easier to continue.
BLUE bar > 50% shows retailer fund is stucked inside, downtrend is likely easier to continue.
Crossing of moving average lines indicates changing of trend (reversal sign):
1) Purple line up-crossed Green line - UPTREND
2) Green line up-crossed Purple line - DOWNTREND

[HuD] Multi Color Dragon Pro+HuD MultiColor Dragon Pro+ is a trend indicator.
- It measures the strength of Bull(Uptrend) and Bear(Downtrend).
- Bull strength is represented by red bar.
- The higher the red bar, the stronger is the trend (Uptrend).
- If the red bar exceeds Level 50 and follows by continuous increment, it means that stock is ready to make strong uptrend movement.
- If red bar is less than previous red bar, the color will change to pink. This to indicate a decrease in momentum.
- The uptrend is considered weak when the black line is higher than red/pink bar.
There are 3 "Buy Signal" from this indicator. I call it SBW :
1. S = Star Icon = is Bottom Catch signal, or also known as Buy on Dip.
2. B = Blue Diamond = when red bar crossover black line
3. W = White Dot = when Golden Cross happen between black line and cyan line ( Bull crossover Bear )
Note :
When trader make entry from these signal (SBW), trader needs to consider to exit the trade if the price BREAK either :
a- Middle candle where signal SBW trigger ( 1st consideration to exit ) or
b- Open Price where signal SBW trigger ( 2nd consideration to exit ) or
c- Low Price where signal SBW trigger ( MUST exit )
Others :
- Black Line = moving average of Bull
- White Dot = moving average of Bear
- Alert for 3 signal provided in script

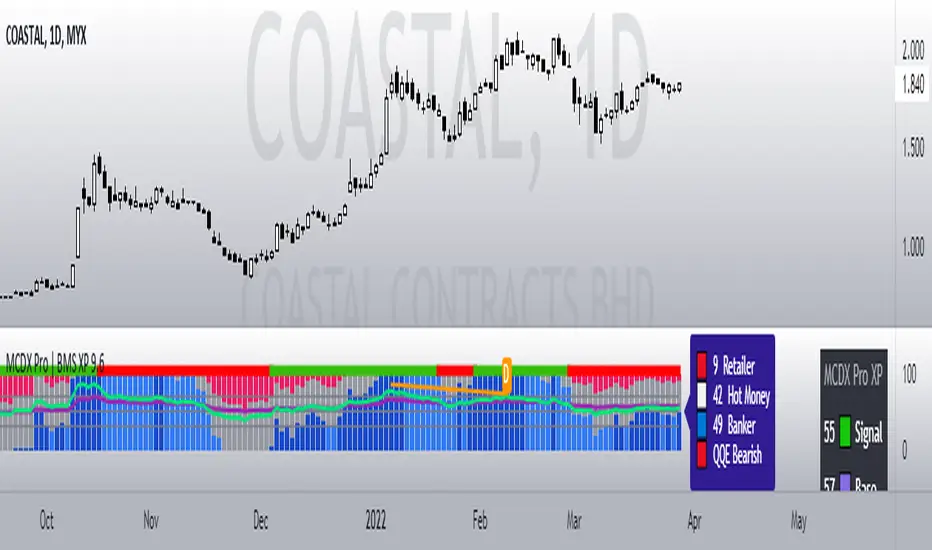
MCDX Pro+ | BMSPublished 10 June 2021
MCDX Pro+ | BMS
Bull Momentum System Pro
Use this indicators with other BMS indicators.
(Smart Power / MC Pro++ / SMI Pro+)
How to use:
This indicator detects Banker volume.
Green Bars = Retailer ( Bearish / Downtrend)
Gray Bars = Hot Money (Sideways / FIFO)
Red Bars = Banker Smart Money ( Bullish Uptrend)
Pink Bars = Weak Banker (Pullback / Unloading / Technical Rebound)
Blue line = FIFO entry
- Blue line is a fast signal to enter when there is no banker yet.
- Good for BTST / FIFO trade.
- If Blue Line is up too strong a fast pullback may happen
- Yellow line = Bearish (pullback)
- Blue line up together with Red bars means strong bullish.
Overbought / Oversold symbol:
Orange Circle = Overbought / Possible very strong bull
Blue Circle = Oversold / Possible bottom catch / Rebound
Banker levels and Rocket symbol:
Level 0% = No Banker show 0 Rocket
Level 25% = Banker step-in show 1 Rocket
Level 50% = Banker build position show 2 Rocket
Level 75% = Banker takes control show 3 Rocket
Level 100% = Banker overbought show 4 Rocket
Best entry when position is Oversold and Red Banker step-in
and build-up position more than 50% level.
Take profit when Overbought, Pink Bars (banker unloading) and
Blue line turns Yellow line.
Baz: Mcdx HeatmapThis indicator is to detect buying and selling momentum based on volume and price action with multiple timeframe mcdx.
Improve version of mcdx to let you see clearly real-time changes in 15mins, 30mins, 1h, 2h, 4h, 1D of the mcdx value.
Heatmap:
Green > Yellow > Orange > Red = Retailer shifting to banker
How it works?
The color subsides based on the resolution of chart, for example
We should focus on larger timeframe, which is >50 on the heatmap. Giving a clear signal that banker is still involved.
For value <50 on heatmap, you get faster signal without changing to smaller timeframe getting all the mcdx value, which save us a lot of time to look at bigger picture what is going on.
For example,
Lets check on each timeframe chart, starting from 15mins
For 15mins and 30min chart, mcdx is < 50
For 1H chart, mcdx is about 50
For 2H, 4H 1D, mcdx > 90

Baz: Mcdx+This indicator is based on Relative Strength Index(RSI) with different periods and bases to show the volatility of the price movement. However, this indicator's signal is delayed or based on historical price movement and should not be used as the only buy or sell indicator. Though, it is a useful confimation tool.
*Histogram
Red : Banker volume
Light Red : Weak Banker volume / possibility of unloading
White : Hot money volume
Green : Retailer volume
*MACD crosses
User can choose different type of moving averages and value for fast and slow signal. Default (5ema, 10ema)
Golden cross : Bull force
Dead cross: Bear force
*Diamonds:
Blue : Oversold, RSI < 30
Red : Overbought, RSI > 70
Release Notes:
1. Light red Column to filter out noise
2. Fast and slow moving average signals
3. Disable Offset
4. Enable Banker, Hot money and Retailers moving averages
5. Enable "More Sensitive" Setting
@Credit to Mango2Juice's magic formula

MCDX PlusINTRODUCTION
Upgraded version of MCDX (Add Moving Average) PROTECTED VERSION
This indicator is similar to original MCDX to detect Buyer and Seller momentum based on Price and Volume to detect Buyer and Seller momentum
This indicator helps to detect “Strong Buyer Activities a.k.a Bankers” based on volume and price movement.
HOW TO USE THE INDICATOR?
There are 2 parts . BARs & Moving Average Lines
BARs
RED BAR = POSSIBILITY of BANKER VOLUME
YELLOW BAR = POSSIBILITY of HOT MONEY VOLUME
GREEN BAR = POSSIBILITY of RETAILER VOLUME
Red Bar Increase means Buyer's momentum increases.
Green Increase means Seller's momentum increases.
We focus on RED Bar to buy. i.e PREFERABLY we buy when RED bar increase.
Example:-
If Banker’s Bar (Red Bar) crosses above 5 (25%) = Banker begins to build position
If Banker’s Bar > 10 (50%) = Banker already built positions. Price will start accelerate
If Banker’s Bar > 15 (75%) = Banker in control. Price will rocket
If Green colour is Retailer (Avoid)..
MCDX Plus comes with Moving Average
DEAD CROSS (shares down)
Banker’s MA cross below Retail’s MA
Banker’s MA cross below Hot Money’s MA
Hot Money’s MA cross below Retail’s MA
GOLDEN CROSS (shares up)
Banker’s MA cross above Retail’s MA
Banker’s MA cross above Hot Money’s MA
Hot Money’s MA cross above Retail’s MA
Contact me to find out more about Turtle Trading System and indicators