M-oscillator

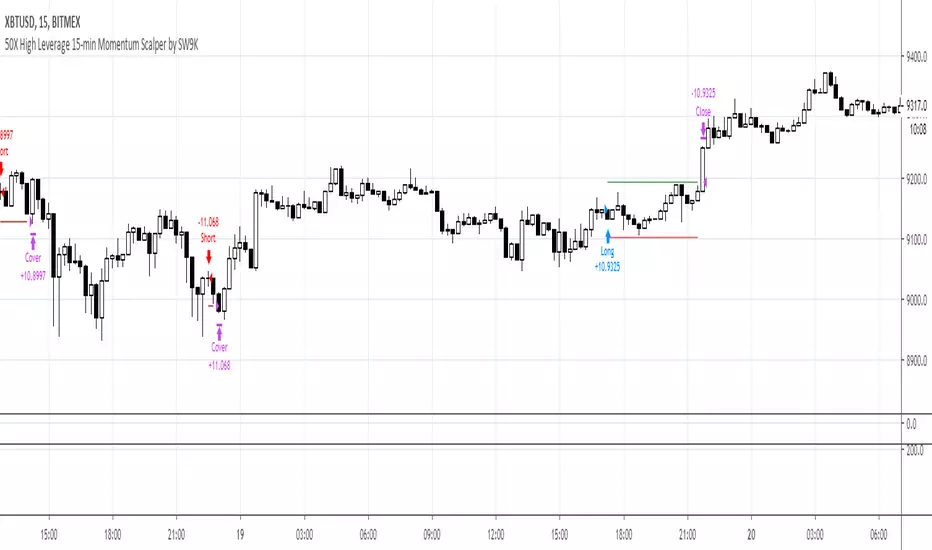
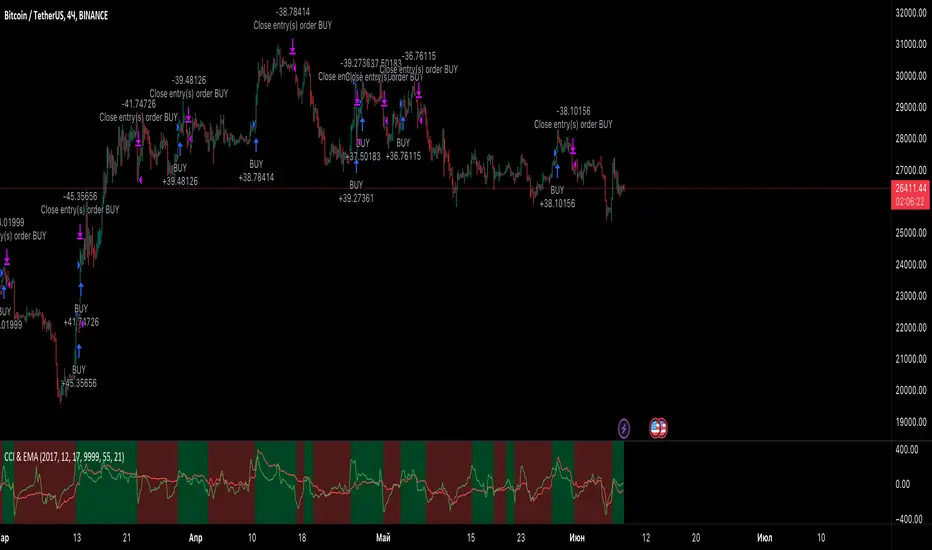
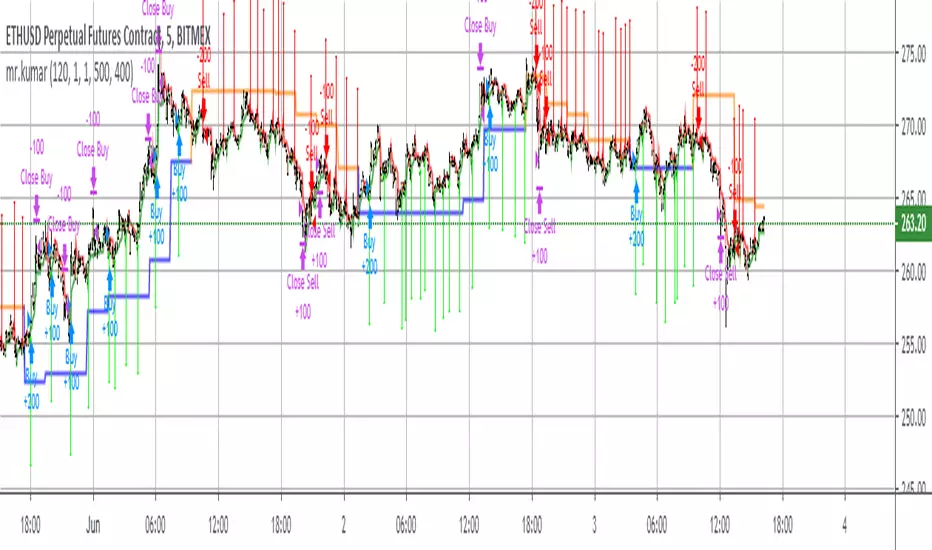
15MEX Momentum Scalper (5X)Working prototype to accurately scalp on the 15 min chart for $XBTUSD pair on BitMex. Designed to let winners run a bit, without any pre-set stop loss. Model is optimized to allow 5X leveraged underwater positions to recover into profitability. Do NOT overleverage with this strategy or you will be liquidated.
Simulated with trades since March 1, 2019, with 100k contract size entries.
Combo Backtest 123 Reversal & Bill Williams. AO with Signal Line This is combo strategies for get a cumulative signal.
First strategy
This System was created from the Book "How I Tripled My Money In The
Futures Market" by Ulf Jensen, Page 183. This is reverse type of strategies.
The strategy buys at market, if close price is higher than the previous close
during 2 days and the meaning of 9-days Stochastic Slow Oscillator is lower than 50.
The strategy sells at market, if close price is lower than the previous close price
during 2 days and the meaning of 9-days Stochastic Fast Oscillator is higher than 50.
Second strategy
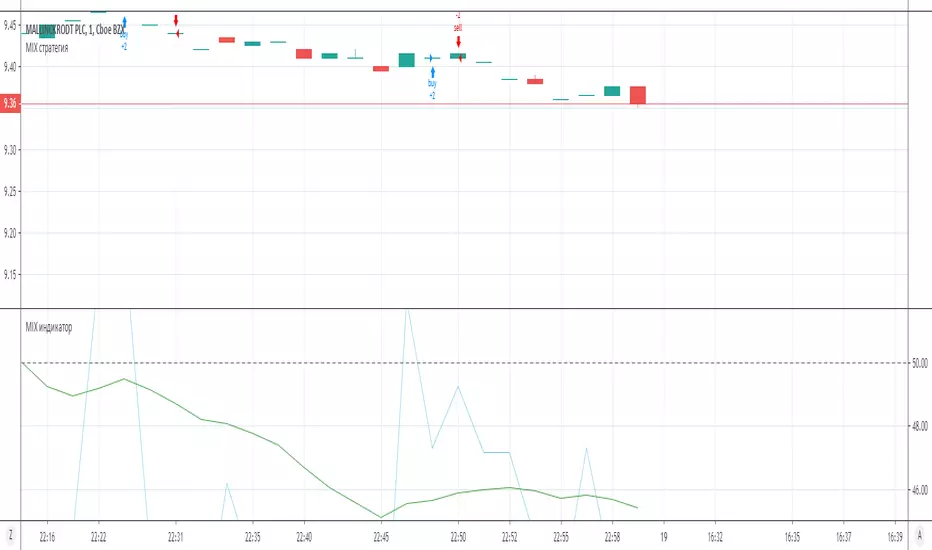
This indicator plots the oscillator as a histogram where blue denotes
periods suited for buying and red . for selling. If the current value
of AO (Awesome Oscillator) is above previous, the period is considered
suited for buying and the period is marked blue. If the AO value is not
above previous, the period is considered suited for selling and the
indicator marks it as red.
You can make changes in the property for set calculating strategy MA, EMA, WMA
WARNING:
- For purpose educate only
- This script to change bars colors.

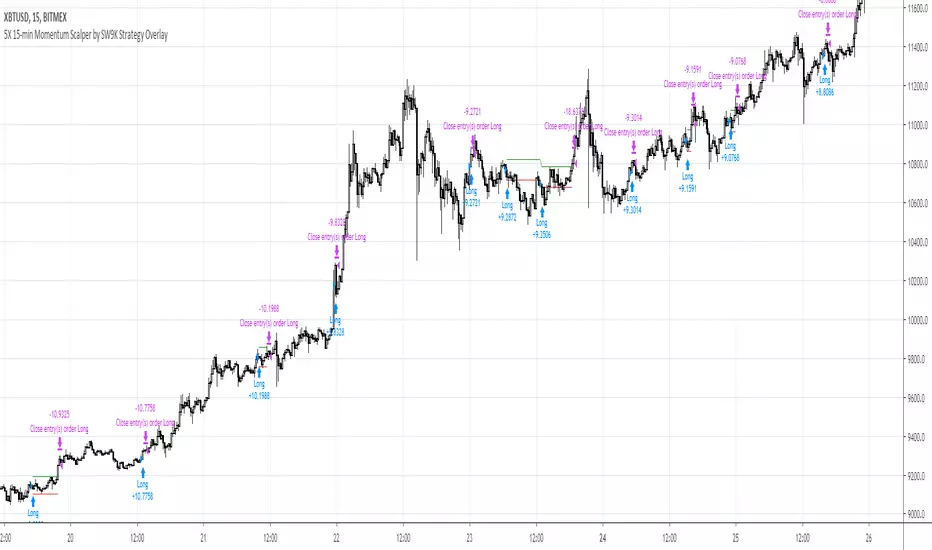
15MEX Momentum ScalperAlpha product project in development. Uses a combination of MACD and T3-CCI with tweaked settings to catch directional momentum and scalp a small move. Strategy is quantity of trades over quality of trades to build profits.
Use this strategy for 15-min Bitmex scalping on XBT contracts only. Recommend 100k contract size or less; backtested with 100k contracts.
Market enter, then use post-only limit exits and stop losses.
Setting is pre-optimized for 0.5% tp target and 0.5% sl of entry price. Recommend default 3 bars as basis for confirming recent MACD crossover as well as default 0.618 Fibonacci ratio as the T3-CCI basis.
Default risk level setting is approximately 2-3 trades a day. You can double the amount to 4-5 trades a day by enabling Aggressive mode. This may lead to larger profits and more entries, but with more frequent stop losses.
Future version will include trailing TPs/stops. Still undergoing optimization and refinement.
Combo Backtest 123 Reversal & Bill Williams Averages. 3Lines This is combo strategies for get
a cumulative signal. Result signal will return 1 if two strategies
is long, -1 if all strategies is short and 0 if signals of strategies is not equal.
First strategy
This System was created from the Book "How I Tripled My Money In The
Futures Market" by Ulf Jensen, Page 183. This is reverse type of strategies.
The strategy buys at market, if close price is higher than the previous close
during 2 days and the meaning of 9-days Stochastic Slow Oscillator is lower than 50.
The strategy sells at market, if close price is lower than the previous close price
during 2 days and the meaning of 9-days Stochastic Fast Oscillator is higher than 50.
Second strategy
This indicator calculates 3 Moving Averages for default values of
13, 8 and 5 days, with displacement 8, 5 and 3 days: Median Price (High+Low/2).
The most popular method of interpreting a moving average is to compare
the relationship between a moving average of the security's price with
the security's price itself (or between several moving averages).
WARNING:
- For purpose educate only
- This script to change bars colors.

Rock1) There is no "security (tickerid, 'D', close)", which has "Blue Sky day 90%", "Vdub" and etc
2) The tested values which you can see below were without "Pyramiding"

E21) There is no "security (tickerid, 'D', close)", which has "Blue Sky day 90%", "Vdub" and etc
2) The tested values which you can see below were without "Pyramiding"
[pti] DAX 5M 7P TP ScalpHey guys, here is a new Script for the Dax. It's only working in 5mins and only with the Dax or Ger30. It has a take profit of 7 points and no(!) stop loss.
Hope you enjoy.
If you want: Do you have an idea how i can maximize the profit with additional trailing stops or what ever? Feel free to write me!

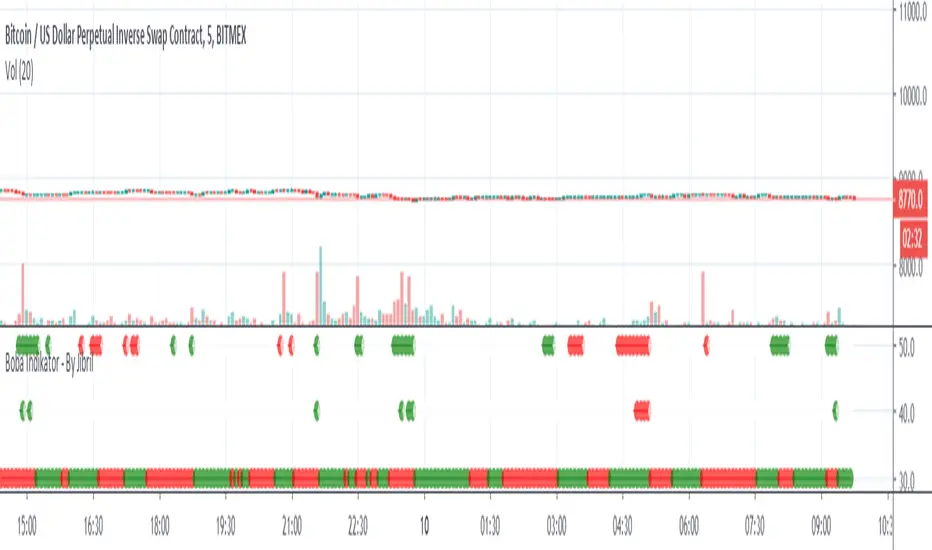
Mossy ADX and DI with Buy/Sell SignalsBasic ADX DI with colored bars to show buy and sell signals , made for 1min but shows general signals of strong or weak buy and sell signals.
Dark Red = Heavy Signal
Light Red = weak signal
Green = buy signal
Dark Green = Heavy Signal
Colors are to confirm or warn, Buy/Sell points are where to enter and exit.
Mossy ADX DI colored bars for quick scalping, works best with Heikin Ashi, confirm with other indicators, Mossy Pop is one shown and works well to confirm.

Direction Power StrategyThis strategy is based on the very well known ADX indicator, some risk management was applied, TP, SLand the most vital, trail stop.
If you have any questions let me know!
Ah, ps. It works better on longer timeframes, tried it also on shorter timeframes but becomes less profitable

Yaonology SPY StrategyOnly use this strategy in the US stock market. Especially use in SPY.
www.yaonology.com

A.I.Driven TradersAI Model Trades for 20190612The entry and exit levels here are NOT derived from any specific indicator but are coming from our A.I. driven proprietary models.
This is an attempt at exploring the trading community here at TradingView and sharing our daily trading plans published at our site with the community here in the form a Pine Script - just starting and learning this platform. Please help point out any obvious errors or gotchas committed in the scripts. Thanks and have a great trading day!
**** The Trading Plan Published for today ****
>>>> Medium-Frequency Models: <<<<< For today, Wednesday 06/12, our medium-frequency models indicate using the 2895 as a pivot point - opening a long on a break above 2895, and opening a short on a break below 2895 (wait for a close on at least a five minute chart to determine the break), both sides with a 9-point trailing stop.
Note: For the trades to trigger, the breaks should occur during the regular session hours starting at 9:30am ET. By design, these models do NOT open any new positions after 3:45pm. Only one open position at any given time.
>>>>> Aggressive Intraday Models: <<<<< For today, Wednesday 06/12, our aggressive intraday models indicate going long on a break above 2892 or 2875 with an 6-point trailing stop, and going short on a break below 2887 or 2878 with an 8-point trailing stop.
Note: For the trades to trigger, the breaks should occur during regular session hours starting at 9:30am ET. Due to the intraday nature of these aggressive models, they indicate closing any open trades at 3:55pm and remaining flat into the session close. No opening of new positions after 3:45pm. Only one open position at any given time.

Connors RSI Strategy v1.0 Modified EntriesThis Script is a request by trader acmeinvest
Find the original script here

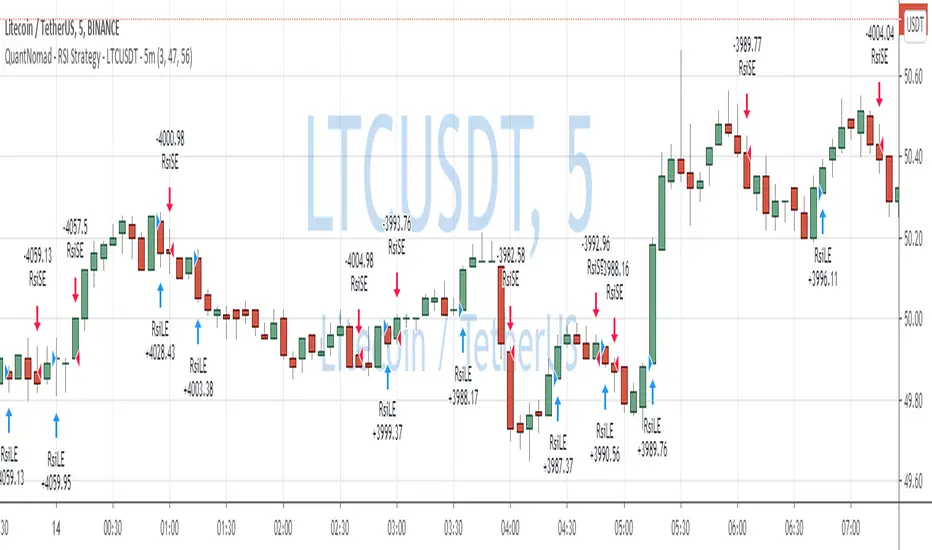
QuantNomad - RSI Strategy - LTCUSDT - 5mReally nice performance of Simple RSI Strategy for LTCUSDT ( Binance ) 5m chart.
Params: RSI Length: 3, RSI OverSold level: 47, RSI OverBought Level: 56
Performance: 391% profit, 2400 trades, 42% prof, 14.6% dd , 0.65 sharpe.
I think this strategy can be a really nice base for a pretty good strategy. We have quite a lot of trades here you can add additional filters that will improve strategy a bit.
And remember:
Past performance does not guarantee future results.
QuantNomad - RSI Strategy - NKE - 5mReally good performance of Simple RSI Strategy for Nike (NKE) 5m chart.
Params: RSI Length: 30, RSI OverSold level: 45, RSI OverBought Level: 60
Performance:57% profit, 112 trades, 73% prof, 6.7% dd, 1.36 sharpe.
And remember:
Past performance does not guarantee future results.

Combo Backtest 123 Reversal & Bear Power This is combo strategies for get
a cumulative signal. Result signal will return 1 if two strategies
is long, -1 if all strategies is short and 0 if signals of strategies is not equal.
First strategy
This System was created from the Book "How I Tripled My Money In The
Futures Market" by Ulf Jensen, Page 183. This is reverse type of strategies.
The strategy buys at market, if close price is higher than the previous close
during 2 days and the meaning of 9-days Stochastic Slow Oscillator is lower than 50.
The strategy sells at market, if close price is lower than the previous close price
during 2 days and the meaning of 9-days Stochastic Fast Oscillator is higher than 50.
Second strategy
Bear Power Indicator
To get more information please see "Bull And Bear Balance Indicator"
by Vadim Gimelfarb.
WARNING:
- For purpose educate only
- This script to change bars colors.


Noro's DI StrategyThe trading system uses indicator DI
The limit parameter reduces quantity of unprofitable signals
For:
- crypto
- timeframes: H4, D1, D7
