Universal Longs Vs. Shorts - Ratio (Any Symbol)Hello again all my Trading View friends!
This script is a variation of my other script "Universal Longs Vs. Shorts - Percentage (Any Symbol)"
It allows you to choose ANY symbol and plot the ratio against ANY other symbol, as an indicator on your given pair. It is primarily used as an indicator of longs/shorts as well as shorts/longs as a ratio to each other.
For example, you could plot BITFINEX:BTCUSDLONGS against BITFINEX:BTCUSDSHORTS.
It plots the ratio of longs/shorts or shorts/longs. For example:
If there are more longs than shorts open, the long ratio will be great than 1 with no upper limit.
If there are less longs than shorts open, the ratio will be less than 1 but greater than 0.
The same is true when comparing shorts to longs. You can choose to view Longs Ratio only, Shorts Ratio only, or Both.
This is useful to see how many more longs there are than shorts, and visa versa, at any given time interval. It does not take into consideration total volume of longs + shorts to get an absolute number, but rather a relative ratio to each other.
If there are many more positions open in one direction over the other, the ratio will rise higher and higher away from 1, which lets you know generally that there is a lot greater volume of that position open compared to its reverse.
If you found this script helpful please remember to FOLLOW and press LIKE!!
More useful scripts to come :-D
Longshort

Universal Longs Vs. Shorts - Percentage (Any Symbol)Hello all my Trading View friends!!
This script allows you to choose ANY symbol and plot the ratio against ANY other symbol, as an indicator on your given pair. It is primarily used as an indicator of longs/shorts as well as shorts/longs as a percentage of total longs + shorts.
For example, you could plot BITFINEX:BTCUSDLONGS against BITFINEX:BTCUSDSHORTS.
It takes the ratio from an absolute 100%, rather than relative to each other. Therefore, each plot has a minimum of 0% and a maximum of 100%. You can choose to view Longs Percentage only, Shorts Percentage only, or Both.
This is useful to see what percentage of total positions are either long or short at any given time interval.
If you found this script helpful please remember to FOLLOW and press LIKE!!

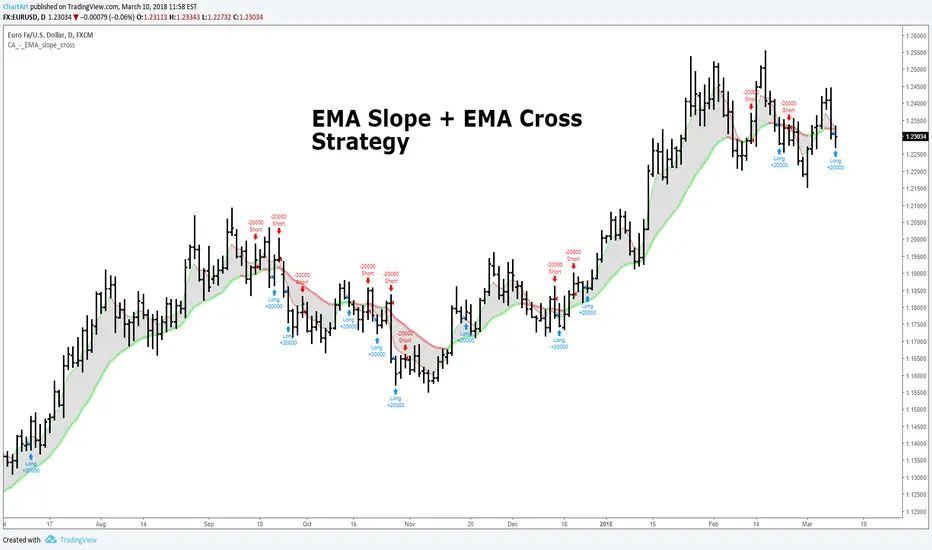
EMA Slope + EMA Cross Strategy (by ChartArt)This strategy uses divergences between three exponential moving averages and their slope directions as well as crosses between the price and these moving averages to switch between a long or short position. The strategy is non-stop in the market and always either long or short.
In addition the moving averages and price bars are colored depending if they are trending up or down.
The strategy was created for the "EURUSD" daily timeframe.
All trading involves high risk; past performance is not necessarily indicative of future results. Hypothetical or simulated performance results have certain inherent limitations. Unlike an actual performance record, simulated results do not represent actual trading. Also, since the trades have not actually been executed, the results may have under- or over-compensated for the impact, if any, of certain market factors, such as lack of liquidity. Simulated trading programs in general are also subject to the fact that they are designed with the benefit of hindsight. No representation is being made that any account will or is likely to achieve profits or losses similar to those shown.
B3 20/50 MeanSimple MA's 20 and 50 are averaged to produce a mean MA line. I like the smoothness of it, and it can help you stay in a trade in the slow moving trends. Also if you start to see a large cloud in your favor, it could be a great time take the profits.

B3 Directional Trend IndexB3 Directional Trend Index ~ All about the trend! William Blau is the designer of this gem, and IMHO it is the best trend finder of all the lagging indicators out there I have tested. It is important to pay attention to the slope and thickness of the line, and its relationship to zero. A reversion to the zero may look momentous, but in fact it could reverse when it reaches mean, only to turn back around. You can see this in March and April of this silver futures daily chart. Makes for a great instrument on anything you consider trendy, like crude oil for example. The default user inputs are set to my liking, as I find them to be great on all charts and resolutions. You may read around to find more about this on the internet, or its mentioned in Krausz's work. Also, imprtant to remember when no trend, trend finders like this sufffer, so be wise as to what market condition you are in. Rangy and within Range = no, On the Move = yes.

B3 Bar Cycle MTF (fix)Apologies, there was an error in printing for the thick gray boxes, happened when MTF was switched on. All better, and here is the details from before:
This is an interesting study that can be used as a tool for determining trend direction, and also could be a trailing stop setter. I use it as a gauge on MTF settings. If on, you can look at the bar cycle of the 1h while on the 15m giving you a lot of information in one tool. If a line is missing high or low, it is because it was broken, if both exist you are trading in range and cloud appears. If both sides break you get thick gray boxes above and below bar.
Get used to editing the inputs to suit your liking. Often 3-5 length and always looking at different resolutions to get a big picture story. You could put multiple instances of the study up to see them simultaneously. I based the idea off of Krausz's 3 day cycle which you can read about in his teachings. I tend to find it looking better using Heikin Ashi bar-style.

B3 Bar Cycle MTFThis is an interesting study that can be used as a tool for determining trend direction, and also could be a trailing stop setter. I use it as a gauge on MTF settings, in the pic MTF is turned off. If on, you can look at the bar cycle of the 1h while on the 15m giving you a lot of information in one tool. If a line is missing high or low, it is because it was broken, if both exist you are trading in range and cloud appears. If both sides break you get thick gray boxes above and below bar.
Get used to editing the inputs to suit your liking. Often 3-5 length and always looking at different resolutions to get a big picture story. You could put multiple instances of the study up to see them simultaneously. I based the idea off of Krausz's 3 day cycle which you can read about in his teachings. I tend to find it looking better using Heikin Ashi bar-style.
