Try to go long at a moving averageA simple experimental strategy that tries to go long at a moving average bounce / support level, and looks for upside.Pine Script™ 전략TraderHalai의업데이트됨 114
Bitfinex Longs vs. ShortsIt shows amount of longs vs shorts for Bitfinex. It can be applied to any currency that has a long/short option on Bitfinex. It works with any other exchange but it pulls short long data from Bitfinex. Useful for "reading" the market sentiment. Use it well. Be blessed.Pine Script® 인디케이터WealthMurphy의4447
BITFINEX Long to Short RatioShows the ratio of longs to shorts. Above 1.0 means more longs. Below 1.0 means more shorts. A value of 1.0 means equilibrium.Pine Script® 인디케이터UnknownUnicorn1484554의업데이트됨 55
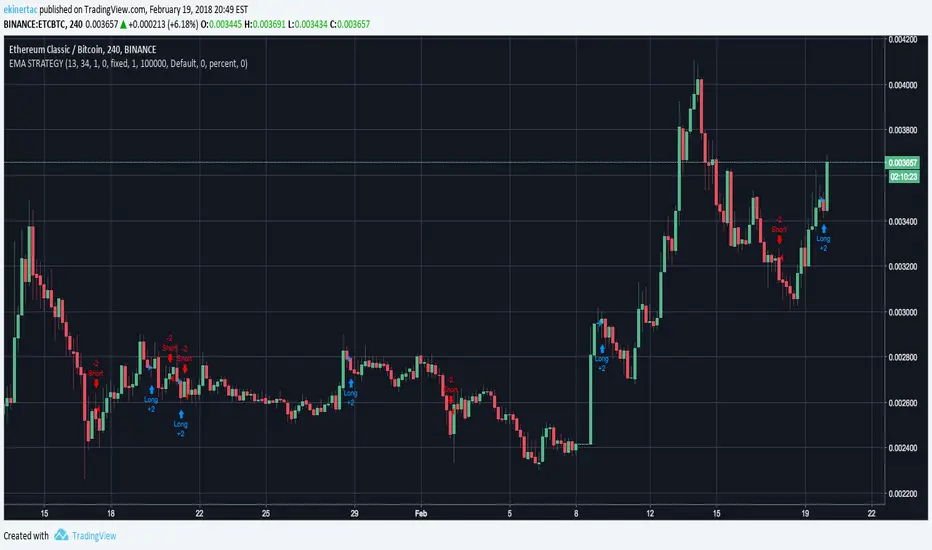
EMA STRATEGYModified by KIVANCfr3762's A2MK plot script to strategy script Pine Script™ 전략ekinertac의1189
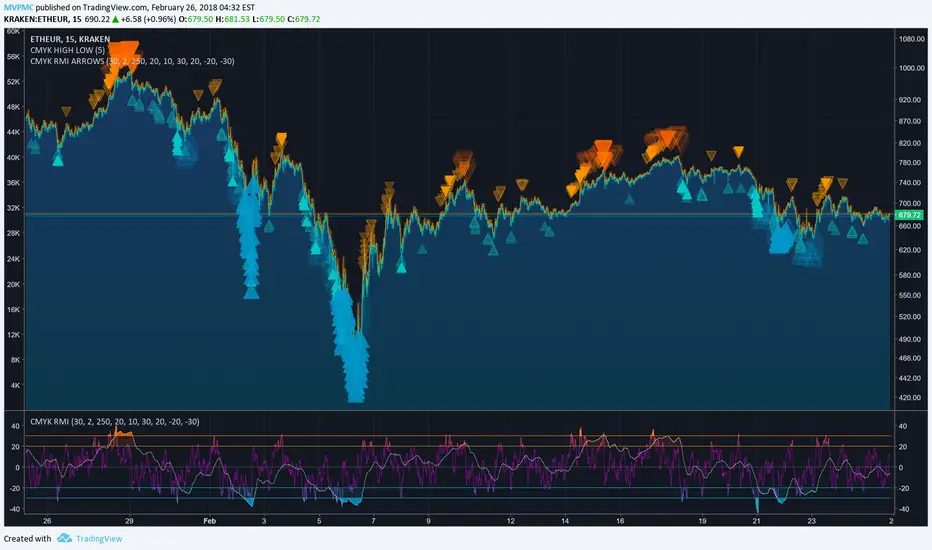
CMYK RMI ARROWS◊ Introduction I started using this script because of its fast reaction, and good tell for buy/sell moments. For larger timescales, the overall trend should be taken into account regarding the levels. In the future i will update this indicator, to automatically adjust those. This is the Overlay expansion of the Indicator Linked below. ◊ Origin The Relative Momentum Index was developed by Roger Altman and was introduced in his article in the February, 1993 issue of Technical Analysis of Stocks & Commodities magazine. While RSI counts up and down days from close to close, the Relative Momentum Index counts up and down days from the close relative to a close x number of days ago. This results in an RSI that is smoother. ◊ Adjustments CMYK color theme applied. Four levels to indicate intensity. Two Timescales, to overview the broader trend, and fast movements. ◊ Usage RMI indicates overbought and oversold zones, and can be used for divergence and trend analysis. ◊ Future Prospects Self adjusting levels, relative to an SMA trend. Alternative RMI, which functions as an overlay. ◊ ◊ ◊ ◊ ◊ ◊ ◊ ◊ ◊ ◊ ◊ ◊ ◊ ◊ ◊ ◊ ◊ ◊ ◊ ◊ ◊ ◊ ◊ ◊ ◊ ◊ ◊ ◊ ◊ ◊ ◊ ◊ ◊ ◊ ◊ ◊ ◊ ◊ ◊ ◊ ◊ ◊ ◊ ◊ ◊ ◊ ◊ ◊ ◊ ◊ ◊ ◊ ◊ ◊ ◊ ◊ ◊ ◊ ◊ ◊ ◊ ◊ ◊ ◊ ◊ ◊ ◊ ◊ ◊ ◊ ◊ ◊ ◊ ◊ ◊ ◊ ◊ ◊ ◊ ◊ ◊ ◊ ◊ ◊ ◊ ◊ ◊ ◊ ◊ ◊ ◊ ◊ ◊ ◊ ◊ ◊ ◊ ◊ ◊ ◊ ◊ ◊ ◊ ◊ ◊ ◊ ░▒▓█ CMYK ◊ RMI █▓▒░ Pine Script® 인디케이터MVPMC의업데이트됨 66225
[naoligo] 12x MA DT (5, 15, 30 & 60)This indicator is based on "Generic 8x MA Plotter", by @LazyBear. It is also based on my own indicator "10x MA (H, D, W, M)", which is good for Swing Trading and/or Position. This one is focused in daytrade and it will plot three Moving Averages based on current time interval (under 5 minutes) and nine based on chosen periods by 5, 15, 30 and 60 minutes. You will be able to see where is, for example, a 50 period's SMA of 15 minutes when using a 2 minutes time interval chart. I find it very useful to analyze, in a snap, possible price ranges and enter/exit points. All reference values are from setups known and used by daytraders. you can choose between EMA or SMA (default: SMA) for each time interval, that are distributed in: 3x MA current time interval; 3x MA 5 minutes; 2x MA 15 minutes; 2x MA 30 minutes; 2x MA 60 minutes. I've tried to keep the code as simple as possible, so you can increase the number of MA or modify the type for each time interval. Cons: Use it wisely, because if you choose to plot all the 12 Moving Averages, it will may consume a lot of your navigator resources. Enjoy!Pine Script® 인디케이터naoligo의22302
ATR+ (Stop Loss Indicator)This script is designed to aid in back-testing and trade execution. It displays three sets of values - the teal colored value is the current ATR, the green colored value is your stop loss distance (in pips) below the most recent swing low for long trades , and the red colored value is your stop loss distance (in pips) above the most recent swing high for short trades . You can change the stop loss settings to base your stop loss on a set pip amount or by however many multiples of the current ATR as you wish (eg. 1.5x ATR). Feel free to ask any questions or edit the script without permission :) - Matt.Pine Script® 인디케이터ZenAndTheArtOfTrading의업데이트됨 3434 5.2 K
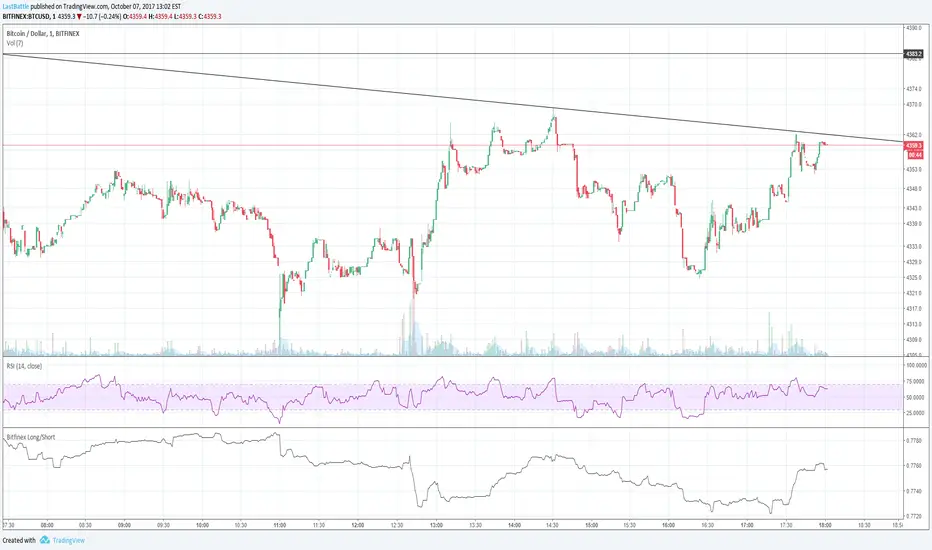
Bitfinex BTC longs vs Short ratioSelf explanatory... Shows the long / short ratio of trader's positioning in bitfinex exchange. The higher the ratio, it means there are more longs. The lower the ratio, the more shorts are currently being opened,.Pine Script® 인디케이터LastBattle의44 1.9 K
BFXLS - Compare styleDisplays BitFinex longs and shorts on your chart in the same was as if you add them by using TradingView's "compare" function - major advantage is that this works for all pairs that BitFinex supports without having to manually set up your chart each time.Pine Script® 인디케이터lvturner의55741
[naoligo] Pivot Points (Daily)Suporte/Resistência do Pivot diário para gráficos intraday Marcação do S/R tradicional e S/R Fibonacci Daily Pivot Point Support/Resistances on intraday charts Both Traditional and Fibonacci methods plotted Pine Script® 인디케이터naoligo의업데이트됨 22240
LONG TERM INVESTMENT TECHNICAL STRATEGY SCRIPT200 - WEEKLY MOVING AVERAGE GREEN LINE IS 200 WEEKS MOVING AVERAGE OF CLOSE BLUE LINE IS 200 WEEKS MOVING AVERAGE OF LOW MULTIPLIED BY 0.90 RED LINE IS 100 WEEKS MOVING AVERAGE OF CLOSE CONDITION: GREEN LINE SHOULD BE ABOVE RED LINE AND PRICE SHOULD BE ABOVE GREEN LINE BUY ONCE THE PRICE IS ABOVE GREEN LINE AND FULFILLS THE CONDITION. TARGET 1 FOR TIME FRAME 1 YEAR= 2 X GREEN LINE VALUE WHEN PRICE CROSSED IT TARGET 2 FOR TIME FRAME 3 YEARS= 3 X GREEN LINE VALUE WHEN PRICE CROSSED IT TARGET 3 FOR TIME FRAME 5 YEARS= 5 X GREEN LINE VALUE WHEN PRICE CROSSED IT TARGET 4 FOR TIME FRAME 10 YEARS= 10 X GREEN LINE VALUE WHEN PRICE CROSSED IT STOP LOSS IS TRAILING TO BLUE LINEPine Script™ 전략ResearchWings의11131
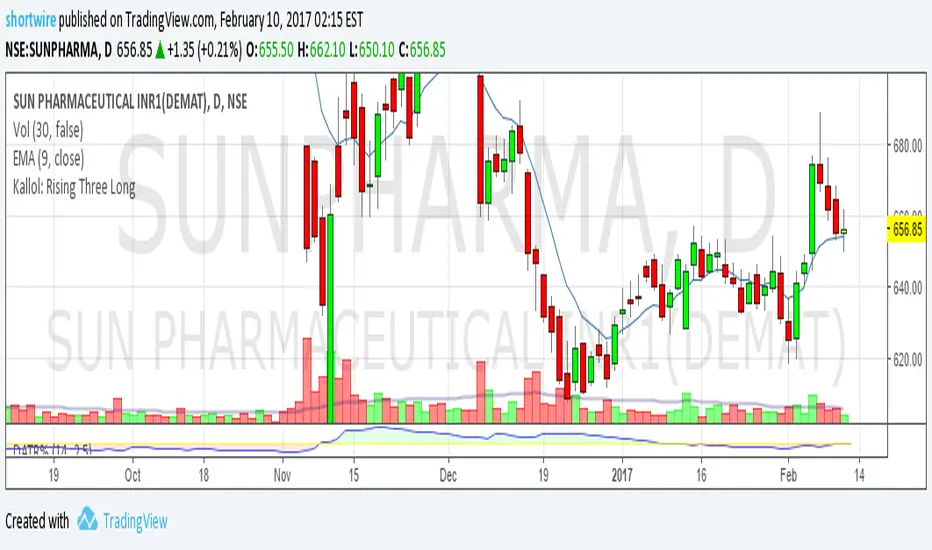
Kallol: Rising Three LongRising three bar bullish pattern indicator as described by Neetesh Jain Pine Script® 인디케이터shortwire의31
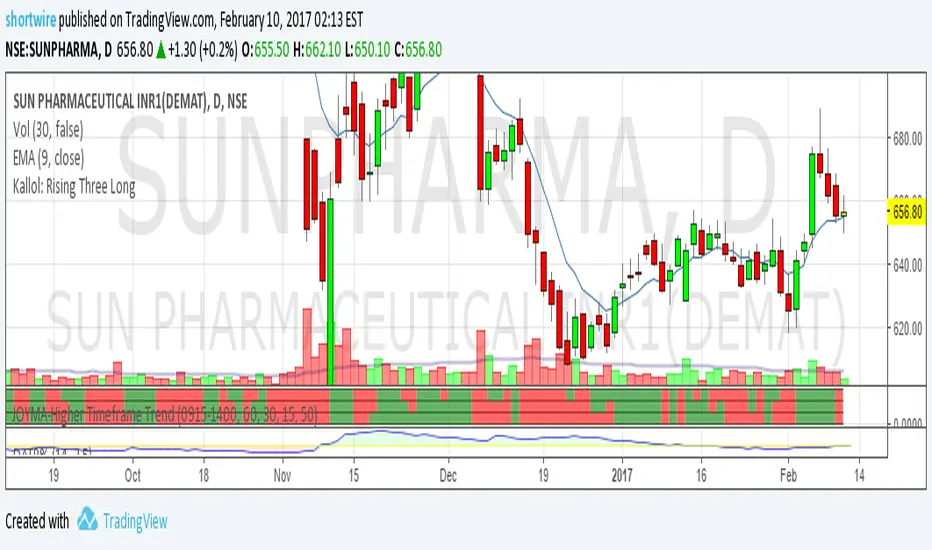
Kallol: Rising Three LongRising three bulling pattern indicator as described by Neetesh Jain: Pine Script® 인디케이터shortwire의3348
Narrow Range + Inside Day, Long Only Strategy (by ChartArt)This long only strategy determines when there is both a NR7 (narrow range 7, a trading day in which the range is narrower than any of the previous six days), plus a inside day (high of the current day is lower than the high of the previous day and the low of the current day is higher than the low of the previous day) both on the same trading day and enters a long trade when the close is larger than the open and the slope of the simple moving average is upwards, too. The strategy closes the long trade next time the daily close is larger than the open in any of the next trading days. In addition the NR7ID can be colored (the color is green when the close is larger that day than the open, else the color is red) and the SMA can be drawn with a color based on the direction of the SMA slope. To fine-tune the strategy it is highly recommended to change the period length of the SMA, which determines if the measured SMA slope is upwards or not. Inspiration: How to trade NR7 and Inside Day Pattern paststat.com Code credit: NR7 indicator script from Tradingview user Lazybear: pastebin.comPine Script™ 전략ChartArt의22 1.5 K
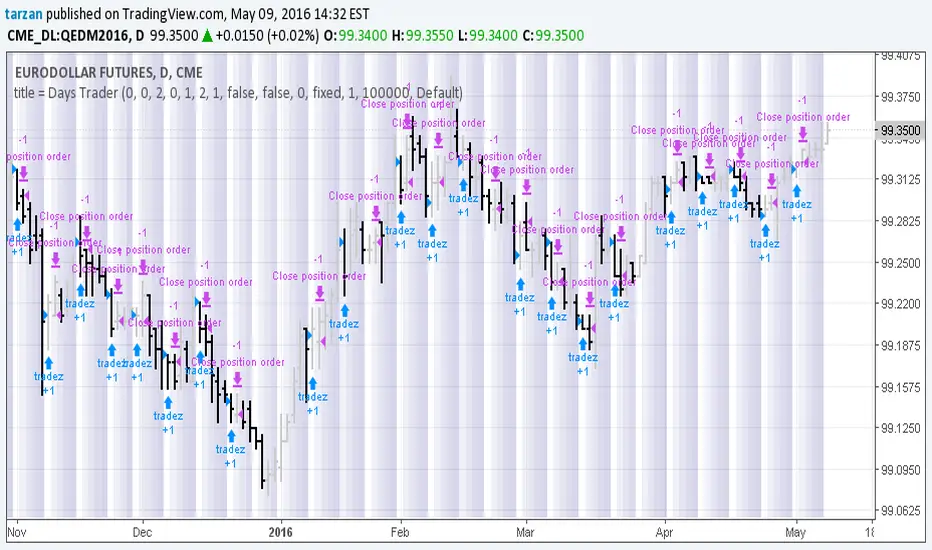
Days Trader 1.0Simple program to look for day of week or day of month patterns in chart data. All original work by Boffin Hollow Lab Author: TarzanPine Script™ 전략tarzan의11417
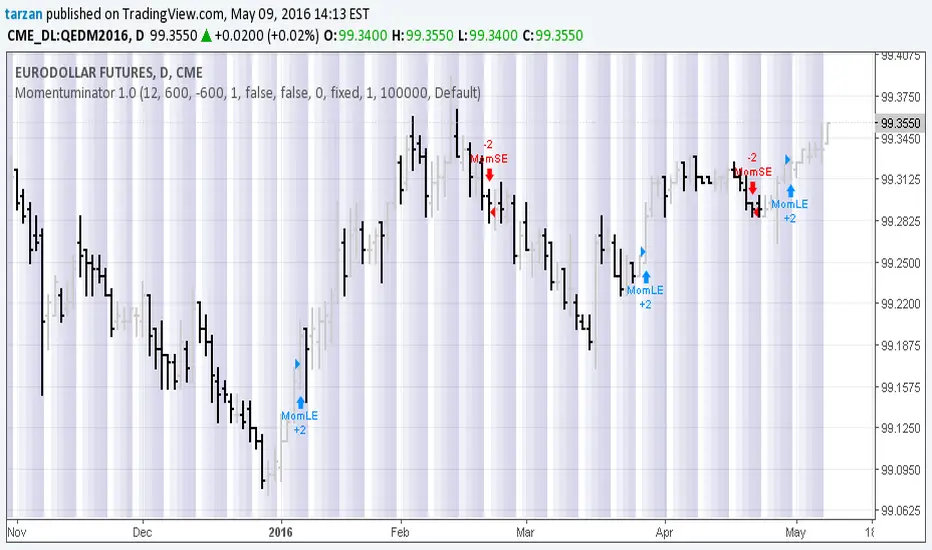
Momentuminator 1.0Here we have a general purpose momentum based long and short flip flop with optional profit target and maximum loss. Program development: Boffin Hollow Lab Author: Tarzan at tradingview.com Release: Version 1.0 May 2016 Please Note: Past Performance is not necessarily indicative of future resultsPine Script™ 전략tarzan의11118
MACDouble + RSI (rec. 15min-2hr intrv) Uses two sets of MACD plus an RSI to either long or short. All three indicators trigger buy/sell as one (ie it's not 'IF MACD1 OR MACD2 OR RSI > 1 = buy", its more like "IF 1 AND 2 AND RSI=buy", all 3 match required for trigger) The MACD inputs should be tweaked depending on timeframe and what you are trading. If you are doing 1, 3, 5 min or real frequent trading then 21/44/20 and 32/66/29 or other high value MACDs should be considered. If you are doing longer intervals like 2, 3, 4hr then consider 9/19/9 and 21/44/20 for MACDs (experiment! I picked these example #s randomly). Ideal usage for the MACD sets is to have MACD2 inputs at around 1.5x, 2x, or 3x MACD1's inputs. Other settings to consider: try having fastlength1=macdlength1 and then (fastlength2 = macdlength2 - 2). Like 10/26/10 and 23/48/20. This seems to increase net profit since it is more likely to trigger before major price moves, but may decrease profitable trade %. Conversely, consider FL1=MCDL1 and FL2 = MCDL2 + (FL2 * 0.5). Example: 10/26/10 and 22/48/30 this can increase profitable trade %, though may cost some net profit. Feel free to message me with suggestions or questions.Pine Script™ 전략RyanMartin의66547
Fisher Transform with Up/Down colours - squattterCredit to HPotter - colour code borrowed from his AO script.Pine Script® 인디케이터squattter의126
Simple RSI-MA Algo Beats DOW By Huge Margin Over Past 100 Years!This simple RSI-MA long/short algorithm beats the Dow by a FREAKING HUGE margin over the past century (excluding dividends and trading costs). The algorithm uses a fast SMA of the RSI as a buy/cover signal and a slow SMA of the RSI as a sell/short signal. Backtest period = 09/17/1916 - 11/02/2015 Dow = 98 --> 17,830 = +18,094% = 5.38% CAGR Algorithm = net profit + open P/L = +43,349% = 6.31% CAGR Notice how the algorithm dodged both the 30s' Great Depression and the 2008 Crisis. Pretty cool huh? :) ALGORITHM'S FORMULA (use weekly chart): Buy/Cover = MA10(RSI10) cross> 50 Sell/Short = MA50(RSI10) cross< 50 STRATEGY TESTER'S SETTINGS: - Initial cash = $10,000 - Pyramiding disabled - Re-investment enabled (order size = 100% of equity ) - Trade re-calculations disabled DISCLAIMER: None of my ideas and posts are investment advice. Past performance is not an indication of future results. This strategy was constructed with the benefit of hindsight and its future performance cannot be guaranteed. Pine Script™ 전략Stable_Camel의55 3.3 K