Long RSIThe RSI is a technical indicator generally used with the general setting being 14 days, and often shorter.
The accepted view is that a level of 70 indicates overbought conditions, and 30 indicates oversold conditions.
A short RSI setting will give signals quite often, and they might sometimes contradict each other.
As a individual investor, perhaps with a background in fundamental analysis, the RSI might be overlooked for other fundamental metrics.
But the idea here is that longer RSI settings can be used for investing.
The problem that arises is how to know when the indicator has reached a level that is either overbought or oversold.
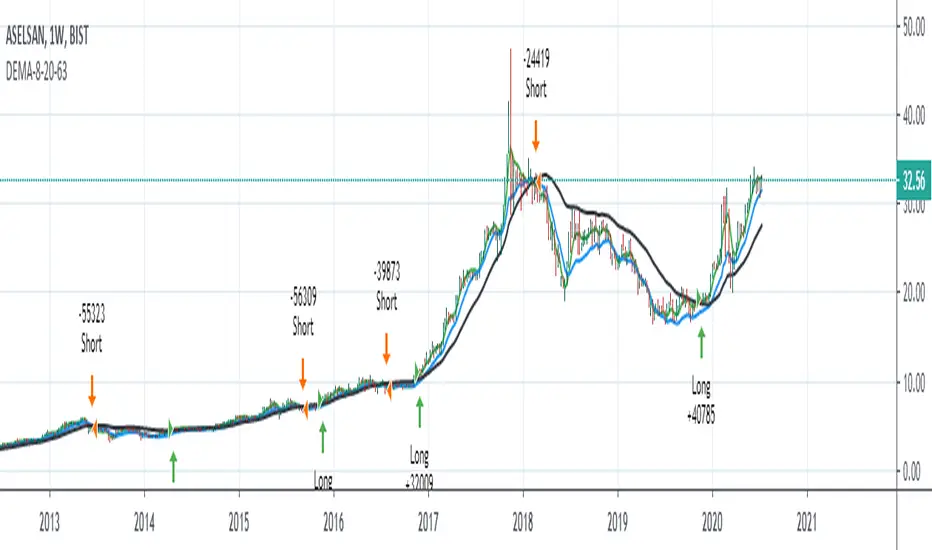
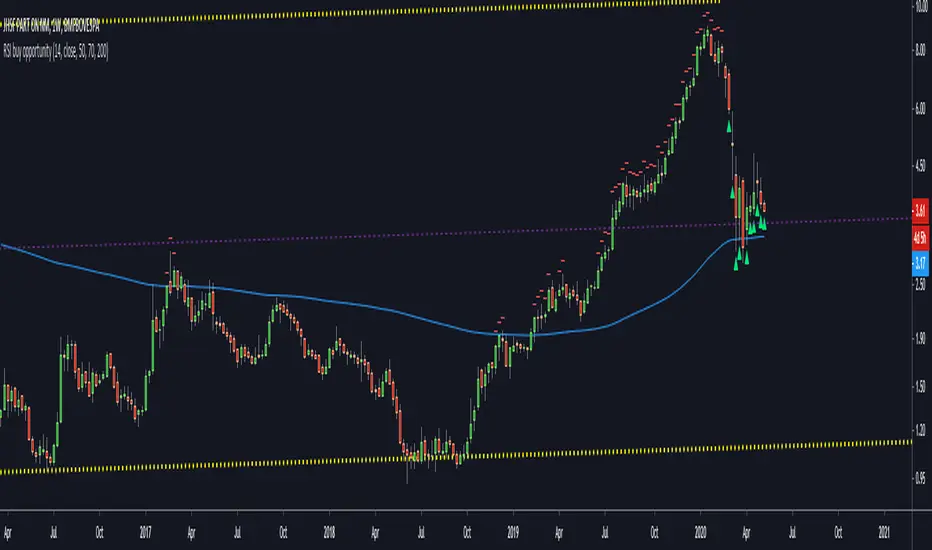
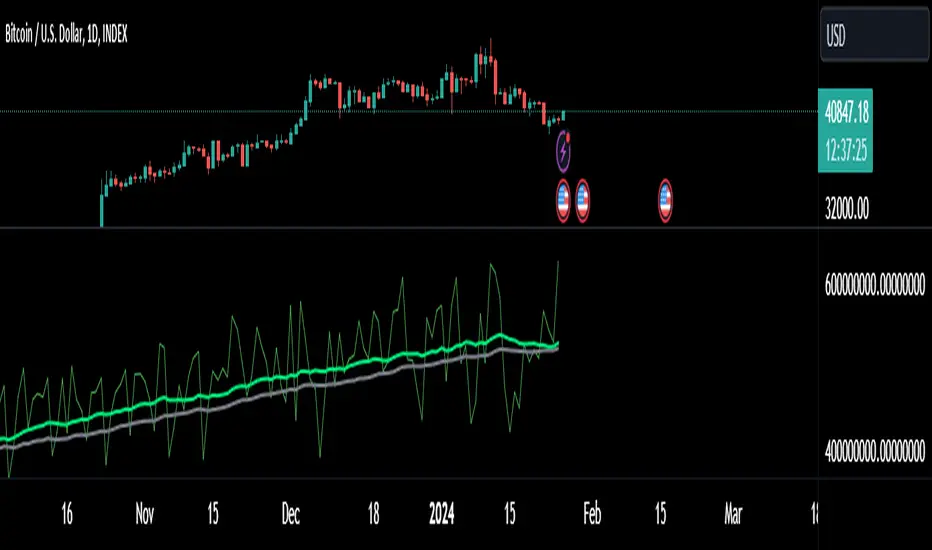
This script solves that by using a specific look back period (selectable, but the standard is 1 year), and plotting the highest/lowest value that the RSI has had for that time period.
The idea is that a buy signal occurs when the indicator is at a 'historic' low, and a sell signal occurs when it at its 'historic' high.
Since you generally want to buy when the indicator is at its low, and has stopped decreasing, the script comes with a function that shows you when yesterdays value reached a historic low, but todays value is higher than yesterday.
This is shown by a color change of the background to green. The same is true, but opposite, for sell signals and then the background turns red.
THIS IS NOT TRADING ADVICE, AND YOU SHOULD ALWAYS DO YOUR OWN RESEARCH
GOOD LUCK AND HAPPY TRADING
Pine Script® 인디케이터