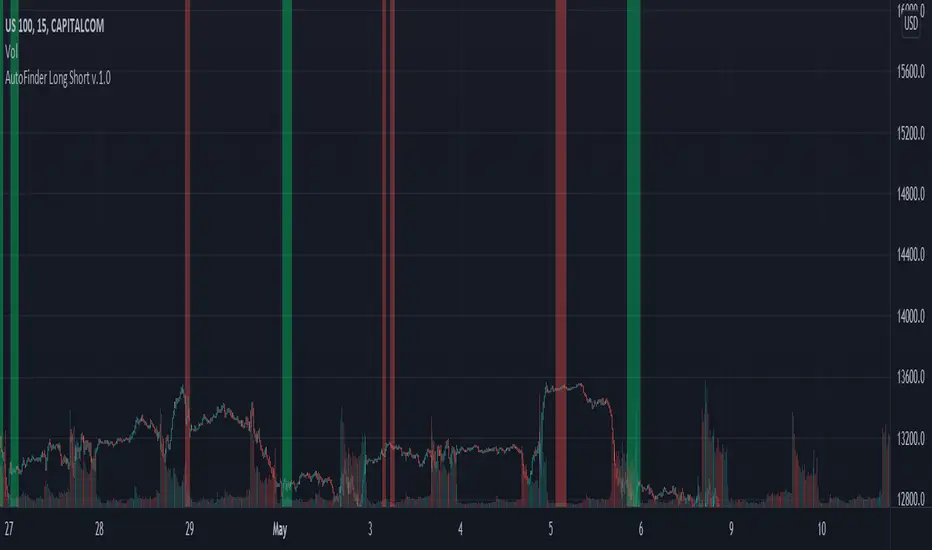
AutoFinder Long ShortAutoFinder Long Short
A simple script. It only advice you when MACD is calling for Long or Short.
You can choose your range period to find highest and lowest moment on MACD. (suggested 150 or more)
Also you can choose % for detect the change of the trend. (suggest between 70-90)
You can test what really happen moving indicator on new panel and enabling MACD Plot from settings.
Enjoy
롱
Pre-ScalperHello all,
It is an artificial intelligence indicator that can generate future predictions based on trend tracking and historical data analysis.
It will be in a period of continuous improvement to achieve the highest success rates.
You can use in all market in all time period.
This indicator does not contain any investment advice, it is only a helpful tool in your investments.
BINANCE:AAVEUSDTPERP

LOKEN (v4) BULLISH SMART MONEYThis indicator is based on Smart Money MCDX
(Pine editor @v4)
Indicator built for cryptocurrencies.
Best for day trading.
The coin seems overbought but still pump? Check this indicator
This indicator help you see when institutional buyer enter/exit trade and is a good combination with RSI + Stochastic RSI .
This indicator focus on buying activity by big players and is built for LONG or SPOT, shorter can still use it to determine when to exit short (if smart money appear on a significant TF you may not enter/stay in a short).
Banker plot show strong buyer activities (appear generally when RSI already overbought but still increasing).
It appear as a Histogram with a color code to better see the fading strength of the institutional activity :
Light Blue Bar = Institutional presence ( bullish )
Green Bar = Pump candle (very bullish ), (Banker > Banker MA)
Orange Bar = Retest candle = natural decline after a growth (Banker < Banker MA)
Black Bar = Down candle = progressive exit of institutional leads to this candle, you must have TP before.
Red Bar = Dump candle = steep decline, the institutional take profit hard. You better be out before that one.
Hot-Money plot show momentum and react fast to price action.
It appear as a filled zone (red or green) depending on the plot position compared to its average.
In a downtrend you may only see this one.
Key-Signals:
"Bullish signal 𓃓" = open a long
"Sell signal 💲" = close the long
I recommend you don't keep all the signals enabled at first.
(feel free to ask me the use of the other signals)
It seemed to me that SMART MONEY MCDX was counter-intuitive and archaic,
So i made this one for personal use,
I'm happy if this indicator helps you,
Have a good trade

WIB & 3WTCThis indicator plots the Weekly inside bar and 3 Weekly tight close.
i : Weekly inside bar
- : Weekly tight close
1. Weekly inside bar (WIB)
Which shows the price contraction where the current bar's range is lower than the previous bar's range
Conditions:
Current bar's low is higher than previous low and high less than the previous bar
Range of the current bar should be at least 30% less than the previous bar (Can be modified in the input settings)
Distance between Current bar's low and 50 D Simple Moving average should be at least less than 5% (Can be modified in the input settings)
sometimes low or high of current bar could be few points fluctuated from the previous so tolerance percentage has been set to 1 (Can be modified in the input settings)
Candle range should not be more than 10%. More the compression in the candle better it is for taking a position
Position:
Long could be initiate when the high of the current bar is broken
2. 3 Weeks Tight Close (3 WTC)
where the last three weeks close are within 1.5% range
Conditions:
Last three weeks close is with in 1.5% range (Can be modified in the input settings)
Position:
Long could be initiated current market price
Note: Below conditions apply for both the patterns
Close should be higher than Moving Average(40)
Volume should be less than Volume moving average(10)
Tip
Candle range is visible in the tooltip by hovering over the plots of WIB and WTC characters
Play with Indicator settings for the study purpose

Daily Scalping Moving AveragesThis is a technical analysis study based on the most fit leading indicators for short timeframes like EMA and SMA.
At the same time we have daily channel made from the last 2 weeks of ATR values, which will give us the daily top and bottom expected values(with 80%+ confidence)
We have 3 groups of lengths for short length, medium length and a bigger length.
At the same time we combine it with the daily vwap values .
In the end we are going to have a total of 7 indicators telling us the direction.
The way we can use it :
The max ratings that we can have are +7 for long and -7 for short
In general once we have at least 5 indicators(fast and medium ones) giving us a direction, there is a high chance that we can scalp that trend and then we can exit either when we will be at +7 or close to neutral point
At the same time is very important to be aware of the current position inside of the TOP/BOTTOM channel that we have.
For example lets assume we are at 40k on BTC and our top channel is around 41-42k while the bottom is around 38k. In this case the margin that we have for long is much smaller than for short, so we should be prepared to exit once we reach the top values and from there wait and see if there is a huge continuation or a reversal. If the top channel was hit and the market started the rebounce going downwards and the moving averages confirms it, then we have a huge advantage using the top points as a STOP LOSS and continue the short movements, giving us an amazing risk/reward ratio .
If you have any questions let me know !

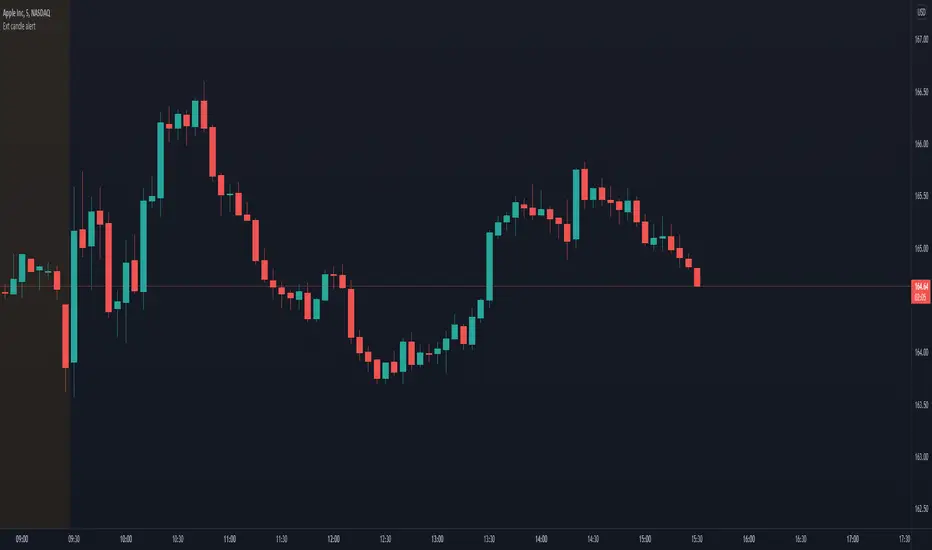
Extended candle alertThis indicator lets you set an alert that triggers when a candle body has got a specific % extension.
Customizable settings
Extension % threshold: the % of the candle extension that has to trigger the alert
Instructions to make it work
Add the indicator to your layout
Set the desidered extension % threshold
Create an alarm (Alt + A)
In the first condition toolbox select "Ext candle alert"
In the second condition toolbox select either long or short condition
Press create (unless you want to change secondary stuff like notification settings)
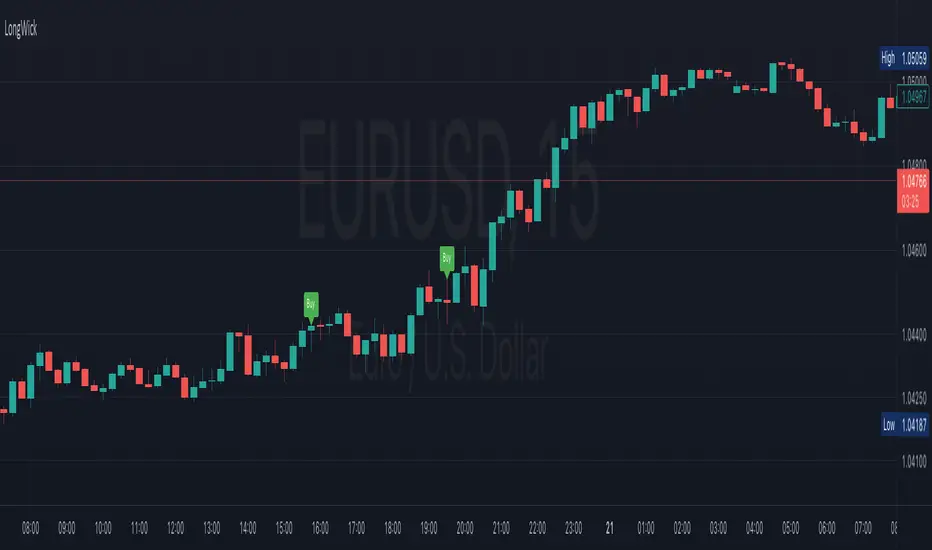
Long WickIt will work on Bank Nifty future only with 2 min time frame. GO Long above candle if the lower wick is more than 50 points and go short below the candle if upper wick is more than 50 points. It will work better with price action.(demand and supply zone)
MoonFlag DailyThis is a useful indicator as it shows potential long and short regions by coloring the AI wavecloud green or red.
There is an option to show a faint white background in regions where the green/red cloud parts are failing as a trade from the start position of each region.
Its a combination of 3 algos I developed, and there is an option to switch to see these individually, although this has lots of info and is a bit confusing.
It does have alerts and there are text boxes in the indicator settings where a comment can be input - this is useful for webhooks bots auto trading.
Most useful in this indicator is that at the end of each green/long or red/short region there is a label that shows the % gain or loss for a trade.
The label at the end of the chart shows the % of winning longs/shorts and the average % gain or loss for all the longs/shorts within the set test period (set in settings)
So, I generally set the chart initially on a 15min timeframe with the indicator timeframe (in settings) set to run on say 30min or 1hour. I then select a long test period (several plus months) and then optimize the wavelcloud length (in settings) to give the best %profit per trade. (Longs always seem to give better results than shorts)
I then, change the chart timeframe to much faster, say 1min or 5min, but leave the indicator timeframe at 1 hour. In this manner - the label only shows a few trades however, the algo is run at every bar close and when this is set to 1min, this means that losses will be minimised at the bot exits quickly. In comparison - if the chart is on a 15min timeframe - it can take this amount before the bot will exit a trade and by then there could be catastrophic losses.
It is quite hard to get a positive result - although with a bit of playing around - just as a background indicator - I find this useful. I generally set-up on say 4charts all with different timeframes and then look for consistency between the long/short signal positions. (Although when I run as a bot I use a fast timeframe)
Please do leave some comments and get in touch.
MoonFlag (Josef Tainsh PhD)

Buy / Sell indicator light version [Crypto_BCT]The indicator is based on the search for the lowest bars in a given period (can be customized).
You can add a search for the highest bars to determine the closed order points.
You can add a filter by the value of the RSI (you can customized it separately for buying and selling).
Alerts for buying and selling are set.
It can be used to work with bots, for example 3COMMAS DCA bot.
--------------------------
Signal Condition Settings:
(Buy) Lowest Bar
The closing of the current bar is lower than the closing of the bars back in this range
(Buy) RSI value <
The RSI index is below this value
(Sell) Highest Bar
The closing of the current bar is higher than the closing of bars in this range
(Sell) RSI value >
The RSI index is higher than this value

BTC 1D Safety tradeImportant: use only the BTC/USD pair on the 1D timeframe
The indicator is designed to determine the zones for entry to buy or sell, as well as for closing deals.
The indicator is based on a moving average with a period of 12.
The parameters are not changeable, since the optimal settings (Safety trade) were used for the BTC/USD pair on the 1D timeframe.
The code is open, please change it according to your parameters.
Upper zones for closing long or opening short.
Lower zones for opening long or closing short.

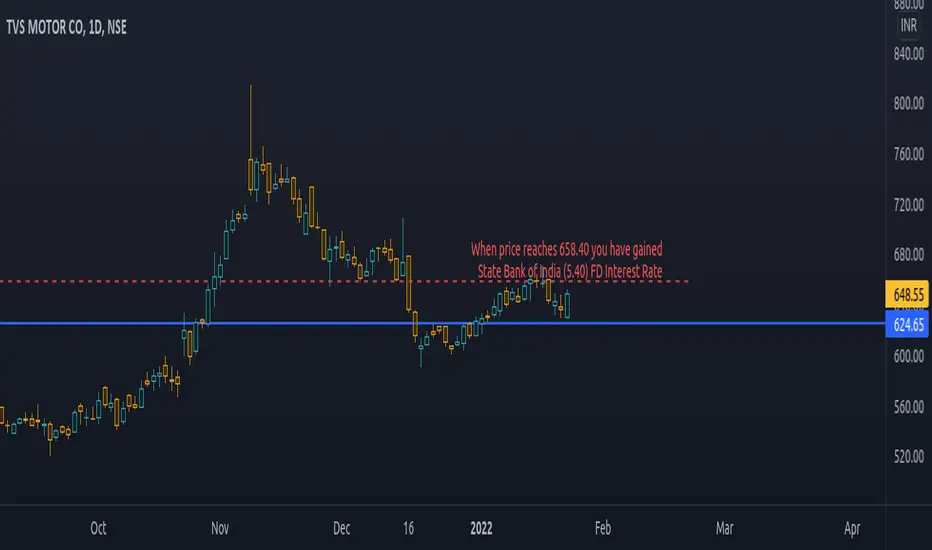
PriceCatch Bank FD Return LevelHi Tradingview community.
This script would be of interest to those trading Indian stocks in NSE/BSE. It is an open-source script with a simple mandate.
ESTIMATE:
At what price will your long trade yield a return equal to the selected bank's fixed deposit interest rate (1 year).
It will help you to estimate your probable target and whether the set target is at least returning selected bank's fixed deposit interest rate.
USAGE:
Pretty simple. Enter the rate at which you have taken the long entry or drag the price line, any which way. Select the bank whose interest rate you want to calculate the return rate with. Once done, the script will draw a line and give you the price where the return would match the selected bank's fixed deposit interest rate. Then you may manually draw a line at that price level and disable the script.
WHY TO DISABLE?
As the script draws the level on the basis of a particular chosen stock, the line would be irrelevant when you change the instrument. Think of the script as helping you to quickly find the return yield for a specific long trade. Once you know it, no need to keep the script active.
IN THE CHART:
The chart shows that on TVS Motor, a trade taken at 624.65 would have to go up to 658.40 to give State Bank of India's FD interest rate of 5.40 p.a.
Feel free to use and contact if you have any queries/feedback.
All the best with your trading.
PriceCatch
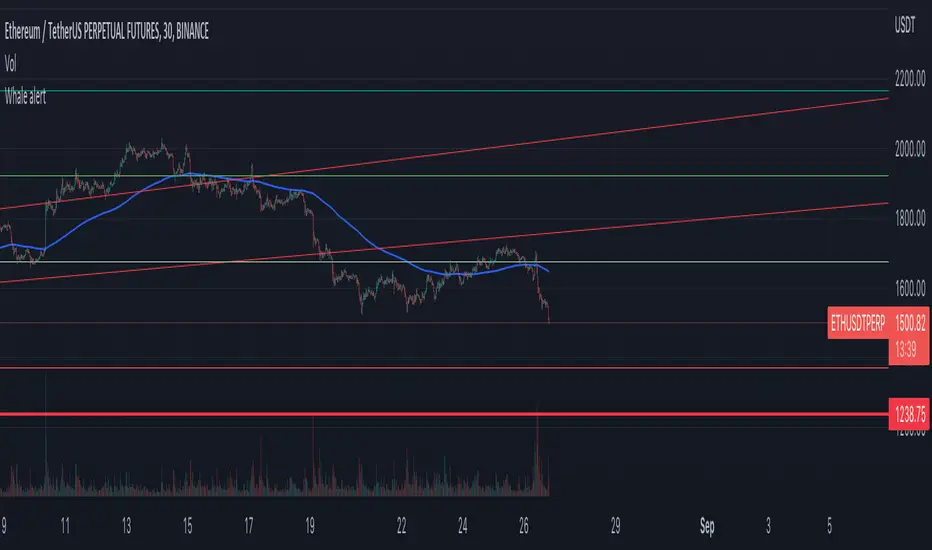
Whale Alert CryptoBase on BTC
Green Tag: Whale buy in/FOMO
Red Tag: Whale build short position (Lighten up)
Purple Tag: just run
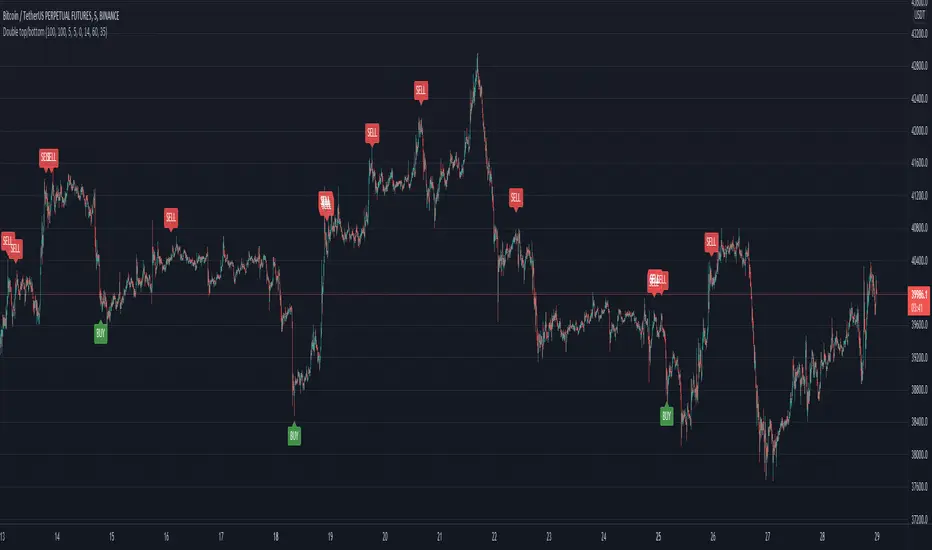
Double top/bottomHello!
This alerts is based on the double bottom pattern - for entering a long position / double top-short
A double bottom pattern is formed when two price bottoms are relatively at the same level and the top acts as resistance. This pattern appears at the end of a downtrend and signals a reversal.
A double top is a bearish reversal pattern that signals the end of an uptrend. It is formed by two price highs forming at the same level and a notch line that acts as local support.
As history and practice show, the double bottom pattern works better. Moreover, in a bull market.
// LOGIC ENTRY:
Period for short and long positions-to search for double bottom as well as double top . the more, the less false.
Change liong and short-channel width for pattern search separately for long and short.
General shift-the overall width of the channel, which changes equally at once for long and short
By default, quiet settings for 1 hour
You can choose the settings you like.
//FILTER SETTING
-RSI
If the checkbox is checked, the filter will be enabled.
The higher the upper bound, the less frequent short entries.
The lower the indicators of the lower border, the less frequent entries to the long
Logarithmic Trend ChannelThis indicator automatically draws a regression channel plotted on logarithmic scale from the first quotation.
This model is useful for the long term series data (such as 10 or 20 years time span).
The Pearson correlation measures the strength of the linear relationship between two variables. It has a value between to 1, with a value of 0 meaning no correlation, and + 1 meaning a total positive correlation.
Logarithmic price scales are a type of scale used on a chart, plotted such that two equivalent price changes are represented by the same vertical changes on the scale.
They differ from linear price scales because they display percentage points and not dollar price increases for a stock.
Technical issues
*The user have to pan over the chart from the beginning to the end of the study range (such as 10 years of bars) so the pine script could generate those lines on the chart.
*If on the chart the number of bar is less than the lookback period, it won't generate any lines as well.

TEWY - Magic Strength Indicator (SI)Detail about this indicator
1. This indicator is used to identify the trend based on the momentum of the counter selected.
2. This indicator is calculated three different metrics for selected script and it's Parent/Main Index as NSE:NIFTY (default) and Sector Index. Keep in mind below point
a) Parent/Main index is set to default NSE:NIFTY, though there is option to provide your own custom parent index e.g. US30, US 100'
B) Sector Index is identified automatically for set to predefined stocks and rest ate set to default NIFTY 500. Again you have option to change it to your preference
3. I have used the rate of change and RSI of it to calculate momentum for script, it's parent index and sector index.
4. I would typically use this indicator to see momentum on the Monthly and Weekly first and daily timeframe to get proper entry.
5. Also please try to stay in the long position only unless you understand the consequences for shorting a stock . why? because the imminent nature of the market is to go upward only.
6. Please try to keep base inputs as defaults, though it allows you to change input parameters
Let's understand this indicator
• On the tor right corner you would see three different numbers. 1st number is SI of the underlying Ticker. 2nd number is SI for the Sector Index and 3rd is for Parent Index SI.
• If selected ticker is outperforming it's parent index the you see one green "▲" and if ticker is also outperforming it's sector index then you would see two green "▲▲". Same on the downside.
• I would only take long position if selected ticker is at least outperforming Parent index, that means at least one green "▲".
• I would take exit from the position if I see no more green "▲".
Always respect RISKS and follow stop loss. In market stop loss is the only friend of yours.
I have given a sample illustrational image below, which should help you understand this indicator.
Best of luck

Bitcoin Bull Runs Mid Cycle Aligned This script plots 2 lines which are the 2013 and 2016 bull run. The plots are aligned on their mid cycles to the 2021 mid cycle.
Settings:
You can move the plots on the x and y axis in the settings for the Daily, Weekly and Monthly TFs.
The plot is weird on the Monthly TF, best to use the Daily and Weekly.
If it doesn't load at first you have to zoom out fully and go back to 2013 for it to load. Then it will load.

BBW EMA RIBBON+BB%B+EMA BUY/SELL SignalsBINANCE:BTCUSDT
* * * TESTED ON BTCUSDT 4H CHART * * *
The indicator gives signals based on possible ENTRY/EXIT zones (calculated using an ema ribbon of the BBW) and BB%B oversold/overbought conditions, also a 200 EMA filter is used to trade following the major trend.
ENTRY/EXIT zones can be used as a confirmation on other strategies (green zones suggest a possible entry for a long in an uptrend and for a short in a downtrend, red zones suggest a possible exit for long & short)
Only LONG signals are given.
Signals are divided in 3 categories based on their strenght:
- Weak BUY/SELL (green/red circles on chart)
- normal BUY/SELL (green/red triangles with "BUY" or "SELL" text on chart)
- strong BUY/SELL (green/red labels with "STRONG BUY" or "STRONG SELL" text on chart)
You can use signals from the same category as triggers for entering or exiting a trade or you can try using signals from different categories
All indicators settings can be costumized
Possible EXTRY/EXIT zones can be turned ON/OFF
Every signal label can be turned ON/OFF
EMA that changes color based on last candle close can be turned ON/OFF
Alerts can be set for:
- General Signals (every signal will trigger it)
- Weak Signals (only weak signals will trigger it)
- Normal Signals (only normal signals will trigger it)
- Strong Signals (only strong signals will trigger it)
There are 3 BB%B Oversold & 3 BB%B Overbought value presets:
- BASIC (default values)
- LOW (slightly lower values from default)
- HIGH (slightly higher values from default)
Tips:
Use BB%B OS LOW preset to find entries at a better price
Use BB%B OS HIGH preset to find entries faster
Use BB%B OB LOW preset to find exits faster
Use BB%B OB HIGH preset to find exits at a better price
There are 3 Filters already included:
- A checkbox to toggle ON/OFF the use of Heikin Ashi candels to detect trades
- A checkbox to toggle ON/OFF the use of an ema filter for the ribbon that tries to reduce the number of false signals on over-extended price movements
- A checkbox to toggle ON/OFF the use of an ema filter that tries to reduce the number of false signals when price crosses the moving average many times consecutively

BB+RSI+EMA BUY/SELL SignalsBINANCE:BTCUSDT
* * * TESTED ON BTCUSDT 4H CHART * * *
The indicator gives signals based on candles touching BB lines and RSI oversold/overbought conditions, also a 200 EMA filter is used to trade following the major trend.
Only LONG signals are given.
Signals are divided in 3 categories based on their strenght:
- Weak BUY/SELL (green/red circles on chart)
- normal BUY/SELL (green/red triangles with "BUY" or "SELL" text on chart)
- strong BUY/SELL (green/red labels with "STRONG BUY" or "STRONG SELL" text on chart)
You can use signals from the same category as triggers for entering or exiting a trade or you can try using signals from different categories
All indicators settings can be costumized
Every signal label can be turned ON/OFF
EMA that changes color based on last candle close can be turned ON/OFF
Alerts can be set for:
- General Signals (every signal will trigger it)
- Weak Signals (only weak signals will trigger it)
- Normal Signals (only normal signals will trigger it)
- Strong Signals (only strong signals will trigger it)

NEXT Strategy VisualizerAs suggestive by its name, NEXT Strategy Visualizer enables traders to discover, configure, and plot strategy signals (in the form of arrows) based on any of our NEXT TradingView indicators, as well as other TradingView indicators (built-in and 3rd party). It is intended to be a visual strategy builder, primarily for discretionary trading. Historic and real-time signals are plotted when strategy conditions are met. NEXT add-ons can be used standalone or as part of a broader trading system (e.g. validation or enter / exit signal only). As of this writing, NEXT Strategy Visualizer fully supports our first TradingView add-on, NEXT RSI , a volume-weighed RSI indicator. All future NEXT indicators (and we have many planned) will also be fully compatible and pluggable into Strategy Visualizer. Below is an example of a NEXT RSI (Length 9, P/V Weighing 3) overbought/oversold (contra-trend, momentum) strategy plotted on EURUSD 10-Range chart via NEXT Strategy Visualizer.
Input Parameters
Signal Source: This should be set to whichever NEXT add-on strategy you wish to visualize. In the example above, it is NEXT RSI. Signal Source will also take any other built-in or 3rd party TradingView indicator.
LE Level: When this level is crossed from below, a long entry signal is displayed on the chart. In the EURUSD example above, we used 10. Putting it together: when the NEXT RSI line (as selected in the Signal Source) crosses above 10, an up arrow, representing a long signal, is drawn.
SE Level: when this level is crossed from above, a short entry signal is displayed on the chart. In the EURUSD example above, we used 90. Putting it together: when the NEXT RSI line (as selected in the Signal Source) crosses below 90, a down arrow, representing a short signal, is drawn.
Use LX/SX: Checking this box will enable the next 2 parameters, LX Level and SX Level, intended for long exit and short exit signals.
LX Level: When this level is crossed from above, a long exit signal, in the form of a green "X", is displayed on the chart. For example, if we wanted to exit a long signal when RSI reaches and retraces under 75, we would set this value to 75. This way, an up arrow would be drawn at 10 and an "X" at 75.
SX Level: When this level is crossed from below, a short exit signal, in the form of a red "X", is displayed on the chart. For example, if we wanted to exit a short signal when RSI reaches and retraces over 25, we would set this value to 25. This way, a down arrow would be drawn at 90 and an "X" at 25.
Remember, all Level values are relative to the Signal Source . For example, the NEXT RSI scale runs 0 to 100 so numbers in that range make sense. Setting levels to any other number would cause the Strategy Visualizer to never draw a signal.
Important: In order to effectively use the NEXT Strategy Visualizer you must attach both the indicator you wish to visualize (NEXT RSI in our example) and the NEXT Strategy Visualizer indicator itself.
All strategy ideas and tutorials for individual NEXT indicators will be powered by NEXT Strategy Visualizer and published on our TradingView page under Ideas .

[astropark] Trend Skywalker V2 [alarms]Dear Followers,
today I'm glad to present you Trend Skywalker V2 , the evolution of Trend Skywalker V1 indicator that you can see here below:
This indicator works on every timeframe and market, it's quite responsive to market movements, so it's especially good on volatile markets.
In this new version you have 3 trend clouds available :
a short-term one (yellow)
a mid-term one (green)
a long-term one (blue)
You can also enable an option to show all trend clouds as one, the result will be similar to a special bollinger bands tool.
Of course you can edit trend clouds analysis period and color, also you can turn on or off the cloud that you prefer.
The indicator can run 4 different kinds of strategy : one for each trend cloud individually or a mixed one.
Also the indicator tracks for you a peak profit from entry: this tracker is a suggestion for you to take profits while price goes up!
All red-green circles you see in the chart is a reminder that a peak profit label was there in the past: what does this tell you?
if price starts losing the short-term trend and you had a lot of TP suggestions, maybe trend ended and you should start consider closing your trade before you give back all your profit.
This indicator will let you set alerts on each buy/sell/close/tp label.
For backtesting, you can use the indicator here below:
This is a premium indicator , so send me a private message in order to get access to this script.

Moses Long-term Index ETF Investing StrategyMoses is a script designed for long-term Index ETF investors.
Moses Goals.
1. Alerts you when a major crash is starting or is underway (Bear Market Signal)
2. Warn you of price events in the market that may lead to increased volatility and downward price pressure (Shock Event Warning)
3. Clearly inform you when the market is in a bull phase (growing) or bear phase (decreasing) (Bull/Bear Signal)
4. Inform you if the market is showing early signs of recovery from a crash
5. Alert you to catastrophic events, which are extreme one bar price drops (typically occurring before or during a major stock market crash)
Moses Logic.
Moses is the product of years of testing, but the application of the logic is simple.
1. Moses is designed specifically to work on a weekly chart (5 days per bar). Do not use the scripts on daily, monthly, or intraday charts
2. Moses Uses 4 Moving Average Indicators
3. Moses uses the position of price and the moving averages to determine the state of the market (Bull/Bear/Recovery)
4. Moses uses price action to determine shock events and catastrophic event warnings
5. The script is hardcoded to start trading in 1997. Why? So that the script's primary goal of avoiding crashes is tested on 3 major crashes, the Dotcom 2000, the Financial Crisis 2008, and the Corona Crash in 2020.
How Moses Works
Being able to exit the market before or during a large market crash enables you to preserve a portion of your equity from decline. Buying back into the market on a Bull Market or Early Recovery Signal enables you to enter the market at a lower price. This goal is achieved during major crashes.
As with all scripts, there are false signals which may incur a losing trade; you can see in the strategy tester results the % of Winning/Losing Trades.
Strategy Setup In Tradingview
Initial Capital $10,000
Order Size 100% of equity (this is because it is a long-term strategy with only one trade in play – you are either long or not invested, using a smaller position size means you cannot meaningfully compare a Moses strategy to a Buy & Hold Strategy)
Commission is $5 per trade (this is negligible because the strategy only trades at most once per year)
Slippage – 10 ticks
This Script Displays the 5 Main MOSES Signals Directly On Your Chart To Help Your Investing Decision Making
1. Bull Market Signal - Green
2. Bear Market Signal - Red
3. Stock Market Recovery Signal - Amber/Yellow
4. Shock Event Warning - Shock Label on Price
5. Catastrophic Event Warning - Red Catastrophe Label
Includes 5 Moses Scripts
• Moses Signals 2.0 (plots all alerts directly on the price chart)
• Moses Buy on Bull - Sell on Bear (Plots a buy on the first Bull Market Signal - Closes All Positions on a Bear Market Signal)
• Moses Buy on Bull - Sell on Catastrophe (Plots a buy on the first Bull Market Signal - Closes All Positions on a Catastrophic event)
• Moses Buy on Recovery - Sell on Catastrophe (Plots a buy on the first Recovery Signal - Closes All Positions on a Catastrophic Event)
• Buy & Hold Script (Used to compare the effectiveness of the strategies versus a Buy and Hold Strategy)
As the script has 3 Moses Strategies, the idea is that you choose the strategy that best fits the ETF you are trading.
Moses is a long-term investing strategy that has historically outperformed the US and European Major Indices for the last 24 years. There is no guarantee of future performance.
Moses has outperformed the market (buy and hold strategy) from 1997 on the:
Nasdaq 100, S&P500, Russell 3000, Nasdaq Composite, EuroStoxx 50, Italian Milano Borsa, German DAX, Paris CAC40
Moses does not outperform the market on:
Nifty 50, BSE Sensex, ASX 200, Chinese Market
Backtested Performance
Test Timeframe Jan 13 1997 - Sept 21 2021
Duration Years 24.75
Initial Investment $10,000
North America Strategy-------------------------------$ Return------------CAGR-------Total %
Nasdaq 100 Buy & Hold----------------------------$176,380-----------12.30%------1664%
Buy Bull - Sell Bear------------------$288,554-----------14.55%------2786%
Buy Bull - Sell Catastrophe---------$202,491-----------12.92%------1925%
Buy Recovery - Sell Catastrophe---$229,866-----------13.50%------2199%
North America Strategy-------------------------------$ Return-----------CAGR------Total %
S&P 500 Buy & Hold----------------------------$58,122-----------7.37%------481%
Buy Bull - Sell Bear------------------$48,544-----------6.59%------385%
Buy Bull - Sell Catastrophe $59,573-----------7.48%------496%
Buy Recovery - Sell Catastrophe $64,579-----------7.83%------546%
North America Strategy-------------------------------$ Return-----------CAGR------Total %
Russell 3000 Buy & Hold----------------------------$61,363-----------7.61%------514%
Buy Bull - Sell Bear------------------$52,957-----------6.97%------430%
Buy Bull - Sell Catastrophe---------$64,027-----------7.79%------540%
Buy Recovery - Sell Catastrophe---$71,565-----------8.28%------616%
North America Strategy-------------------------------$ Return-----------CAGR------Total %
Nasdaq Composite Buy & Hold----------------------------$112,839-----------10.29%------1028%
Buy Bull - Sell Bear------------------$123,308-----------10.68%------1133%
Buy Bull - Sell Catastrophe---------$107,699-----------10.08%------977%
Buy Recovery - Sell Catastrophe---$112,453-----------10.27%------1025%
*CAGR - Compound Annual Growth Rate
From a Declaration of Principles jointly adopted by a Committee of the American Bar Association and a Committee of Publishers
This work is provided to you for informational purposes only and should not be construed as an offer to buy or sell a particular security or a solicitation of offers to buy or sell a particular security. The author may make available certain information related to the potential price movement of particular securities. By reading this report or using the training materials, you acknowledge and agree that any reliance upon the content or data available is at your own sole risk. You are strongly advised to use your own judgment, your own research, and question everything. The information is generic in nature and not targeted to individuals or individual circumstances. The author is an independent investor and is not licensed to give formal Stock advice to the individual, run funds of any type, or accept fees for individual stock advice. The Author accepts no responsibility for loss of money for following any of the lessons or systems created. Trading of securities may not be suitable for all users of this information; if in doubt, seek a professional advisor. All use of this work is at your sole risk.

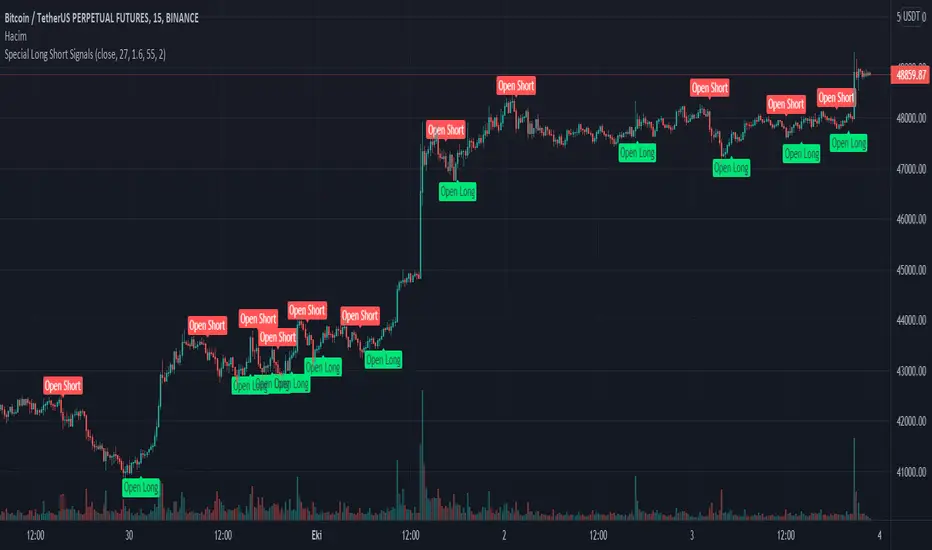
Special Long Short ConditionsIt generates buy and sell signals using a special algorithm when various moving averages approach and diverge from the price. It aims to stay in the trend as long as possible. Please control the risks of your investments well. It is not investment advice.
It calculates using fast, slow period and distance and near distance units. You can adapt it by changing the parameters, but too much optimization is not recommended.
Cesitli hareketli ortalamalarin fiyata yakinlasmasi ve uzaklasmasi durumunda ozel bir algoritma kullanarak al ve sat sinyalleri uretir. Trendde mumkun olabildigince kalabilmeyi amaclar. Lutfen yatirimlarizda risklerini iyi kontrol edin. Yatirim tavsiyesi degildir.
Hizli,yavas periyot ve uzak, yakin uzaklik birimlerini kullanarak hesaplama yapar. Parametreleri degistirerek kendinize uyarlayabilirsiniz fakat cok fazla optimizasyon tavsiye edilemez.
Pivot TrackerThis script finds swing lows and swing highs based on input criteria for lookback and lookforward periods, and plots letters accordingly.
Helps identify trend or lacktherof
HH = higher high
LH = lower high
HL = higher low
LL = lower low
