Daily Close Breakout 20/10 + 200 (Signals)Daily Close Breakout 20/10 + 200 (Signals)
A simple “check once per day” breakout signal tool designed for the Daily (1D) chart.
Quickstart:
* Signals are confirmed at the daily candle close.
* If a triangle prints today, the earliest you act is the next day’s open (not the same candle).
* Green triangle = consider entering long.
* Red triangle = consider exiting.
* Long-only (no shorts).
How to use:
* Use on the Daily (1D) timeframe.
* Check the chart once per day after the daily candle closes.
* Do not act intraday on signals.
Rules (default settings 20 / 10 / 200):
* BUY: A green up triangle prints when the daily close is above the prior 20-day high and above the 200-day Simple Moving Average.
* SELL: A red down triangle prints when the daily close is below the prior 10-day low.
Lines and colors:
* Prior 20-day high (entry level): red
* Prior 10-day low (exit level): yellow
* 200-day Simple Moving Average: aqua
Notes:
* Best used on the Daily (1D) timeframe. Other timeframes may behave differently.
* This script plots signals and reference levels only. For performance metrics, use a matching strategy/backtest script.
* Educational use only. Not financial advice.
롱

Entry Scanner Conservative Option AKeeping it simple,
Trend,
RSI,
Stoch RSI,
MACD, checked.
Do not have entry where there is noise on selection, look for cluster of same entry signals.
If you can show enough discipline, you will be profitable.
CT

Scalp Boost LONG✦ Overview
Scalp Boost LONG is a visual tool designed to highlight potential short-term upward impulses.
A signal is generated only when multiple market conditions align at the candle close, combining momentum dynamics, local probability shifts, and abnormal volume behavior.
The indicator does not repaint.
✦ Concept
The tool focuses on selective situations where the market shows signs of micro-breakout potential.
If all internal conditions are confirmed — a LONG event is displayed.
If not — the chart remains clean.
This builds a low-noise signal model, prioritizing quality over frequency.
✦ Signal Logic
The LONG signal requires confirmation of all core conditions:
• Local impulse dynamics
Identifies short-term acceleration suggesting a breakout from a compressed price structure.
• Probability beyond a statistical zone
Uses relative breakout probability instead of fixed levels, checking whether price exceeds expected local ranges.
• Abnormal volume activity
Highlights candles with monetary flow above a custom threshold, signaling increased market interest.
• Anti-overheat filter
Conditions avoiding exhausted or low-momentum phases where continuation is less likely.
Only when all filters are aligned a LONG marker appears.
✦ Visual Structure
The chart display is intentionally minimal:
• ROC Curve
Subdued line, showing short-term momentum without distraction.
• LONG Marker
Green triangle below the candle on confirmed events.
• Candle Highlight
Soft background highlight on the signal bar.
• Volume Marker
Small red dot at the bottom of candles with abnormal monetary flow.
All visual elements appear only on candle close.
✦ Alerts
A clean event structure is available for notifications:
LONG Signal
This allows receiving alerts during chart analysis or in automated workflows while keeping full control over decision-making.
✦ Notes & Guidelines
This tool:
is not a trading system,
does not provide targets or stops,
may trigger against the dominant trend,
should be combined with the user’s own methodology.
Signals are rare by design.
Do not interpret each event as a trend continuation — it highlights conditions, not outcomes.
✦ Suggested Use
-(Non-mandatory ideas for advanced users)
-identifying potential micro-breakouts,
-timing entries around volume spikes,
-adding context to scalping models,
-filtering impulsive moves from noise.
-suitable for a 5-minute timeframe
The indicator can be helpful as a confirmation layer, not a standalone decision tool.

Liquidity Hunt Detector PDH/PDL [SmartFoxy]Liquidity Hunt Detector PDH/PDL
The Liquidity Hunt Detector (LHD) is designed to identify and anticipate liquidity grabs around the:
• Previous Day High (PDH);
• Previous Day Low (PDL).
It builds dynamic trigger levels that highlight where price may deliver its first impulse before reaching PDH/PDL.
The Liquidity Hunt Detector (LHD) identifies high-probability reversals and continuations around the Previous Day High (PDH) and Previous Day Low (PDL).
It dynamically tracks the market’s move from the session open, builds trigger levels toward PDH/PDL, and highlights where liquidity is most likely to be taken.
When price taps a Trigger Up/Down level, the indicator generates Long/Short signals with optional confirmation from the integrated MA Ribbon , ensuring only high-quality, trend-aligned setups are shown.
When price interacts with these trigger levels, the indicator generates signals that help traders evaluate the market structure and prepare for potential entries.
Designed for Forex, Crypto, Indices, Stocks , the LHD provides a clean and intuitive structure for navigating intraday liquidity grabs, session impulses, and directional bias shifts.
The indicator is built from three fully independent modules, each of which can be used separately:
Liquidity Hunt Detector (LHD)
Moving Average Ribbon (MA Ribbon)
Previous Day High/Low (PDH/PDL) levels
Liquidity Hunt Detector (LHD) Logic
1.1 Display LHD – Enables or disables the entire Liquidity Hunt Detector module.
1.2 Max Days – Number of previous days used to generate PDH/PDL levels.
1.3 GMT – Corrects all time-based calculations based on your broker/session timezone.
1.4 Calculation Method (Point A Logic)
1) Static Method
Point A = the session’s opening price.
Trigger lines are calculated strictly as a percentage of the move A → PDH or A → PDL.
Intraday fluctuations do not affect the calculation.
2) Dynamic Method
Point A updates using the current intraday high/low:
• If price forms a new low, Point A updates for the PDH-side calculations;
• If price forms a new high, Point A updates for the PDL-side calculations.
This produces trigger lines that reflect the true live market structure rather than a fixed opening reference.
1.5 Main OTT Time (Operational Trading Time)
This is the core time window during which the indicator:
• updates Point A;
• calculates trigger levels;
• validates PDH/PDL;
• draws AB / AC movement structure;
• generates entry signals.
Outside this window, no new signals or recalculations occur.
⚠ If your broker’s first candle opens at a non-standard time (e.g., 00:08), adjust the OTT start time to avoid visual artifacts.
1.6 Show Line A – Displays the opening price level (Point A) until the end of the OTT window.
Style, width, and color are customizable.
1.7 Show Line AB — Price Movement Toward PDH.
Static Method – Single line: A → PDH
Dynamic Method – Two segments:
• A → Daily Low;
• Daily Low → PDH.
If PDH is swept, the “B” label switches to Sweep PDH.
1.8 Show Line AC – Price Movement Toward PDL.
Static Method – Single line: A → PDL
Dynamic Method – Two segments:
• A → Daily High;
• Daily High → PDL.
If PDL is swept, the “C” label switches to Sweep PDL.
1.9 Show Trigger Up Line (LONG Trigger) – Defines the level where the Long signal can activate.
By default, at 50% of the A → PDH movement.
When price touches this line, the script may:
• show a LONG label;
• trigger an alert.
All visual parameters are customizable.
1.10 Show Trigger Up Line (LONG Trigger)
Same logic as Trigger Up, but based on A → PDL.
1.11 Show Main Zone (OTT Zone) – Visual background highlighting of the active OTT window.
Helps instantly see:
• whether signals are allowed;
• how much time remains in the trading window?
Color and opacity are adjustable.
1.12 Upper Zone (toward PDH) – Tracks the protected area towards PDH.
Updates dynamically with new highs.
1.13 Lower Zone (toward PDL) – Tracks the zone toward PDL.
Updates dynamically with new lows.
1.14 Show Labels – Displays reference labels (A, B, C, Trigger Up, Trigger Down).
Label size is customizable.
1.15 Add Price – Adds the exact price value to each label.
1.16 Change Color after Sweep PDH or PDL – After PDH or PDL is broken, the indicator automatically recolors lines and labels to visually confirm the sweep.
1.17 Show SHORT Label – Displays the SHORT entry label when all conditions for a bearish signal are met.
Style parameters are set in the previous blocks.
1.18 Alert on Bearish Trigger Down – Triggers an alert when the price activates the bearish trigger.
1.19 Show LONG Label – Displays the LONG entry label when bullish conditions are met.
Style parameters are set in the previous blocks.
1.20 Alert on Bullish Trigger Up – Triggers an alert when the price activates the bullish trigger.
1.21 Alerts Active Time – Defines a custom time interval during which trigger signals are allowed.
Even if price touches a trigger level,
❗ signals will NOT be generated outside this allowed time.
Useful for:
• avoiding Asian session signals;
• reducing noise in low-liquidity periods.
1.22 Labels and Alerts Display Mode
Two settings modes:
• On Trigger (Instant Mode) – Signals appear immediately when price touches the trigger.
• On Candle Close (Conservative Mode) – Signals form only after the candle closes beyond the trigger level.
A more conservative option.
1.23 Delay LHD Signal Until MA Ribbon Confirms Direction – If enabled, LHD signals will NOT fire until the MA Ribbon produces a matching directional signal.
Logic:
• Price hits the trigger → LHD conditions become “armed”;
• The indicator waits;
• When MA Ribbon confirms trend direction (Long/Short);
• The final LHD label + alert is generated.
This ensures LHD trades are filtered and aligned with MA-based trend confirmation.
⚠ Works only when the MA Ribbon module is active.

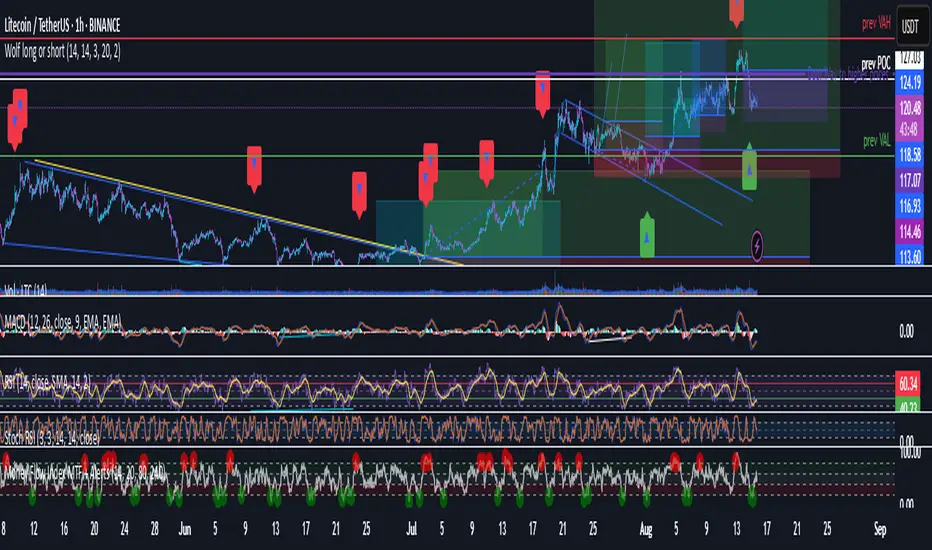
Wolf long or short this indicator is based on RSI, Stoch, BB , this indicator is giving a better understanding of short or long combined with 3 indicator
Greer EPS Yield📘 Script Title
Greer EPS Yield – Valuation Insight Based on Earnings Productivity
🧾 Description
Greer EPS Yield is a valuation-focused indicator from the Greer Financial Toolkit, designed to evaluate how efficiently a company generates earnings relative to its current stock price. This script calculates the Earnings Per Share Yield (EPS%), using the formula:
EPS Yield (%) = Earnings Per Share ÷ Stock Price × 100
This yield metric provides a quick snapshot of valuation through the lens of profitability per share. It dynamically highlights when the EPS yield is:
🟢 Above its historical average (potentially undervalued)
🔴 Below its historical average (potentially overvalued)
🔍 Use Case
Quickly assess valuation attractiveness based on earnings yield.
Identify potential buy opportunities when EPS% is above its long-term average.
Combine with other indicators in the Greer Financial Toolkit for a fundamentals-driven investment strategy:
📘 Greer Value – Tracks year-over-year growth consistency across six key metrics
📊 Greer Value Yields Dashboard – Visualizes valuation-based yield metrics
🟢 Greer BuyZone – Highlights long-term technical buy zones
🛠️ Inputs & Data
Uses fiscal year EPS data from TradingView’s built-in financial database.
Tracks a static average EPS Yield to compare current valuation to historical norms.
Clean, intuitive visual with automatic color coding.
⚠️ Disclaimer
This tool is for educational and informational purposes only and should not be considered financial advice. Always conduct your own research before making investment decisions.

TitanGrid L/S SuperEngineTitanGrid L/S SuperEngine
Experimental Trend-Aligned Grid Signal Engine for Long & Short Execution
🔹 Overview
TitanGrid is an advanced, real-time signal engine built around a tactical grid structure.
It manages Long and Short trades using trend-aligned entries, layered scaling, and partial exits.
Unlike traditional strategy() -based scripts, TitanGrid runs as an indicator() , but includes its own full internal simulation engine.
This allows it to track capital, equity, PnL, risk exposure, and trade performance bar-by-bar — effectively simulating a custom backtest, while remaining compatible with real-time alert-based execution systems.
The concept was born from the fusion of two prior systems:
Assassin’s Grid (grid-based execution and structure) + Super 8 (trend-filtering, smart capital logic), both developed under the AssassinsGrid framework.
🔹 Disclaimer
This is an experimental tool intended for research, testing, and educational use.
It does not provide guaranteed outcomes and should not be interpreted as financial advice.
Use with demo or simulated accounts before considering live deployment.
🔹 Execution Logic
Trend direction is filtered through a custom SuperTrend engine. Once confirmed:
• Long entries trigger on pullbacks, exiting progressively as price moves up
• Short entries trigger on rallies, exiting as price declines
Grid levels are spaced by configurable percentage width, and entries scale dynamically.
🔹 Stop Loss Mechanism
TitanGrid uses a dual-layer stop system:
• A static stop per entry, placed at a fixed percentage distance matching the grid width
• A trend reversal exit that closes the entire position if price crosses the SuperTrend in the opposite direction
Stops are triggered once per cycle, ensuring predictable and capital-aware behavior.
🔹 Key Features
• Dual-side grid logic (Long-only, Short-only, or Both)
• SuperTrend filtering to enforce directional bias
• Adjustable grid spacing, scaling, and sizing
• Static and dynamic stop-loss logic
• Partial exits and reset conditions
• Webhook-ready alerts (browser-based automation compatible)
• Internal simulation of equity, PnL, fees, and liquidation levels
• Real-time dashboard for full transparency
🔹 Best Use Cases
TitanGrid performs best in structured or mean-reverting environments.
It is especially well-suited to assets with the behavioral profile of ETH — reactive, trend-intraday, and prone to clean pullback formations.
While adaptable to multiple timeframes, it shows strongest performance on the 15-minute chart , offering a balance of signal frequency and directional clarity.
🔹 License
Published under the Mozilla Public License 2.0 .
You are free to study, adapt, and extend this script.
🔹 Panel Reference
The real-time dashboard displays performance metrics, capital state, and position behavior:
• Asset Type – Automatically detects the instrument class (e.g., Crypto, Stock, Forex) from symbol metadata
• Equity – Total simulated capital: realized PnL + floating PnL + remaining cash
• Available Cash – Capital not currently allocated to any position
• Used Margin – Capital locked in open trades, based on position size and leverage
• Net Profit – Realized gain/loss after commissions and fees
• Raw Net Profit – Gross result before trading costs
• Floating PnL – Unrealized profit or loss from active positions
• ROI – Return on initial capital, including realized and floating PnL. Leverage directly impacts this metric, amplifying both gains and losses relative to account size.
• Long/Short Size & Avg Price – Open position sizes and volume-weighted average entry prices
• Leverage & Liquidation – Simulated effective leverage and projected liquidation level
• Hold – Best-performing hold side (Long or Short) over the session
• Hold Efficiency – Performance efficiency during holding phases, relative to capital used
• Profit Factor – Ratio of gross profits to gross losses (realized)
• Payoff Ratio – Average profit per win / average loss per loss
• Win Rate – Percent of profitable closes (including partial exits)
• Expectancy – Net average result per closed trade
• Max Drawdown – Largest recorded drop in equity during the session
• Commission Paid – Simulated trading costs: maker, taker, funding
• Long / Short Trades – Count of entry signals per side
• Time Trading – Number of bars spent in active positions
• Volume / Month – Extrapolated 30-day trading volume estimate
• Min Capital – Lowest equity level recorded during the session
🔹 Reference Ranges by Strategy Type
Use the following metrics as reference depending on the trading style:
Grid / Mean Reversion
• Profit Factor: 1.2 – 2.0
• Payoff Ratio: 0.5 – 1.2
• Win Rate: 50% – 70% (based on partial exits)
• Expectancy: 0.05% – 0.25%
• Drawdown: Moderate to high
• Commission Impact: High
Trend-Following
• Profit Factor: 1.5 – 3.0
• Payoff Ratio: 1.5 – 3.5
• Win Rate: 30% – 50%
• Expectancy: 0.3% – 1.0%
• Drawdown: Low to moderate
Scalping / High-Frequency
• Profit Factor: 1.1 – 1.6
• Payoff Ratio: 0.3 – 0.8
• Win Rate: 80% – 95%
• Expectancy: 0.01% – 0.05%
• Volume / Month: Very high
Breakout Strategies
• Profit Factor: 1.4 – 2.2
• Payoff Ratio: 1.2 – 2.0
• Win Rate: 35% – 60%
• Expectancy: 0.2% – 0.6%
• Drawdown: Can be sharp after failed breakouts
🔹 Note on Performance Simulation
TitanGrid includes internal accounting of fees, slippage, and funding costs.
While its logic is designed for precision and capital efficiency, performance is naturally affected by exchange commissions.
In frictionless environments (e.g., zero-fee simulation), its high-frequency logic could — in theory — extract substantial micro-edges from the market.
However, real-world conditions introduce limits, and all results should be interpreted accordingly.

Momentum Fusion v1Momentum Fusion v1
Overview
Momentum Fusion v1 (MFusion) is a multi-oscillator indicator that combines several components to analyze market momentum and trend strength. It incorporates modified versions of classic indicators such as PVI (Positive Volume Index), NVI (Negative Volume Index), MFI (Money Flow Index), RSI, Stochastic, and Bollinger Bands Oscillator. The indicator displays a histogram that changes color based on momentum strength and includes "FUSION🔥" signal labels when extreme values are reached.
Indicator Settings
Parameters:
EMA Length – Smoothing period for the moving average (default: 255).
Smoothing Period – Internal calculation smoothing parameter (default: 15).
BB Multiplier – Standard deviation multiplier for Bollinger Bands (default: 2.0).
Show verde / marron / media lines – Toggles the display of auxiliary lines.
Show FUSION🔥 label – Enables/disables signal labels.
Indicator Components
1. PVI (Positive Volume Index)
Formula:
pvi := volume > volume ? nz(pvi ) + (close - close ) / close * sval : nz(pvi )
Description:
PVI increases when volume rises compared to the previous bar and accounts for price percentage change. The stronger the price movement with increasing volume, the higher the PVI value.
2. NVI (Negative Volume Index)
Formula:
nvi := volume < volume ? nz(nvi ) + (close - close ) / close * sval : nz(nvi )
Description:
NVI tracks price movements during declining volume. If the price rises on low volume, it may indicate a "stealth" trend.
3. Money Flow Index (MFI)
Formula:
100 - 100 / (1 + up / dn)
Description:
An oscillator measuring money flow strength. Values above 80 suggest overbought conditions, while values below 20 indicate oversold conditions.
4. Stochastic Oscillator
Formula:
k = 100 * (close - lowest(low, length)) / (highest(high, length) - lowest(low, length))
Description:
A classic stochastic oscillator showing price position relative to the selected period's range.
5. Bollinger Bands Oscillator
Formula:
(tprice - BB midline) / (upper BB - lower BB) * 100
Description:
Indicates the price position relative to Bollinger Bands in percentage terms.
Key Lines & Histogram
1. Verde (Green Line)
Calculation:
verde = marron + oscp (normalized PVI)
Interpretation:
Higher values indicate stronger bullish momentum. A FUSION🔥 signal appears when the value reaches 750+.
2. Marron (Brown Line)
Calculation:
marron = (RSI + MFI + Bollinger Osc + Stochastic / 3) / 2
Interpretation:
A composite oscillator combining multiple indicators. Higher values suggest overbought conditions.
3. Media (Red Line)
Calculation:
media = EMA of marron with smoothing period
Interpretation:
Acts as a signal line for trend confirmation.
4. Histogram
Calculation:
histo = verde - marron
Colors:
Bright green (>100) – Strong bullish momentum.
Light green (>0) – Moderate bullish momentum.
Orange (<0) – Bearish momentum.
Red (<-100) – Strong bearish momentum.
Signals & Alerts
1. FUSION🔥 (Strong Momentum)
Condition:
verde >= 750
Visualization:
A "FUSION🔥" label appears below the chart.
Alert:
Can be set to trigger notifications when the condition is met.
2. Background Aura
Condition:
verde > 850
Visualization:
The chart background turns teal, indicating extreme momentum.
Usage Recommendations
FUSION🔥 Signal – Can be used as a long entry point when confirmed by other indicators.
Histogram:
1. Green bars – Potential long entry.
2. Red/orange bars – Potential short entry.
3. Media & Marron Crossover – Can serve as an additional trend filter.
4. Suitable for a 5-15 minute time frame
Conclusion
Momentum Fusion v1 is a powerful tool for momentum analysis, combining multiple indicators into a unified system. It is suitable for:
Trend traders (catching strong movements).
Scalpers (identifying short-term impulses).
Swing traders (filtering entry points).
The indicator features customizable settings and visual signals, making it adaptable to various trading styles.

Improved RSI Trend Sniper | JeffreyTimmermansImproved RSI Trend Sniper
This indicator, the "Improved RSI Trend Sniper" is a sophisticated tool designed to enhance market trend analysis by integrating customizable RSI thresholds with advanced moving average options and refined visual enhancements.
Key Features
Advanced Moving Average Options:
The indicator now supports multiple moving average types: SMA, EMA, SMMA, WMA, VWMA, LSMA, HMA, and ALMA, offering greater flexibility in trend analysis.
Users can customize the moving average length for precise momentum detection.
Enhanced Momentum Detection:
Upgraded to allow dynamic calculation of momentum based on user-selected moving averages.
Conditions for bullish or bearish momentum now consider changes in the chosen moving average rather than a fixed EMA, improving accuracy.
Visual Upgrades:
A gradient-based trend fill with multiple opacity layers provides a visually appealing representation of bullish and bearish trends.
New dashboard integration displays key market information, including the ticker, timeframe, and current trend (bullish or bearish).
Improved Signal Customization:
Customizable colors and labels for bullish and bearish signals ensure easy identification on the chart.
Enhanced settings for showing or hiding labels and trend fills
Refined Alerts System:
Alerts are now generated for bullish and bearish conditions with customized messages for better responsiveness.
Alerts can be triggered once per bar close, making them more reliable.
What's New:
RSI and MA Customization: Users can define thresholds and moving average settings, providing more control over trend analysis.
Dashboard Integration: Displays real-time updates directly on the chart for improved situational awareness.
Visual Enhancements: Introduced gradient fills for trend regions, making trends more distinct.
Expanded Moving Average Options: Allows for tailored strategies using various MA calculation methods.
Alert Messaging: Streamlined notifications for actionable insights.
How It Works
Momentum Analysis:
Bullish momentum is detected when the RSI crosses above the bullish threshold and the moving average is increasing.
Bearish momentum is flagged when the RSI falls below the bearish threshold, and the moving average is decreasing.
Trend Visualization:
Bullish trends are highlighted with gradient shades of green, while bearish trends use shades of red.
Labels appear on the chart to mark key turning points.
Tailored for Different Trading Styles
The Improved RSI Trend Sniper is versatile and adaptable, catering to traders with various time horizons:
Long-Term Adjustments: For traders focusing on long-term trends, increasing the RSI length and moving average period allows the indicator to smooth out minor price fluctuations and highlight sustained momentum. Selecting slower-moving averages like the SMA or LSMA further filters out short-term noise, ensuring signals align with broader market trends.
Medium-Term Adjustments: Swing traders can use a balanced RSI length (e.g., 14–20) and a medium moving average period (e.g., 20–50) to capture actionable signals within the mid-range market cycles. The inclusion of options like EMA or SMMA ensures quicker reactions to price changes while maintaining moderate sensitivity to reversals.
Short-Term Adjustments: For day traders or scalpers, using a shorter RSI period (e.g., 7–10) alongside faster moving averages such as the HMA or ALMA can provide quicker signals for high-frequency trading. These adjustments enhance the ability to react swiftly to immediate market shifts, ideal for fast-paced trading environments.
By customizing the indicator’s settings to align with your trading timeframe, the Improved RSI Trend Sniper ensures accurate and relevant insights, empowering traders to optimize their strategies across any market condition.
Dashboard Details
Provides an at-a-glance view of market data for the current ticker and timeframe.
The Improved RSI Trend Sniper takes the original tool to the next level, offering a more comprehensive, customizable, and visually intuitive approach to market trend analysis. Perfect for traders looking to refine their strategies with actionable insights.
-Jeffrey

Ultra Trade JournalThe Ultra Trade Journal is a powerful TradingView indicator designed to help traders meticulously document and analyze their trades. Whether you're a novice or an experienced trader, this tool offers a clear and organized way to visualize your trading strategy, monitor performance, and make informed decisions based on detailed trade metrics.
Detailed Description
The Ultra Trade Journal indicator allows users to input and visualize critical trade information directly on their TradingView charts.
.........
User Inputs
Traders can specify entry and exit prices , stop loss levels, and up to four take profit targets.
.....
Dynamic Plotting
Once the input values are set, the indicator automatically plots horizontal lines for entry, exit, stop loss, and each take profit level on the chart. These lines are visually distinct, using different colors and styles (solid, dashed, dotted) to represent each element clearly.
.....
Live Position Tracking
If enabled, the indicator can adjust the exit price in real-time based on the current market price, allowing traders to monitor live positions effectively.
.....
Tick Calculations
The script calculates the number of ticks between the entry price and each exit point (stop loss and take profits). This helps in understanding the movement required for each target and assessing the potential risk and reward.
.....
Risk-Reward Ratios
For each take profit level, the indicator computes the risk-reward (RR) ratio by comparing the ticks at each target against the stop loss ticks. This provides a quick view of the potential profitability versus the risk taken.
.....
Comprehensive Table Display
A customizable table is displayed on the chart, summarizing all key trade details. This includes the entry and exit prices, stop loss and take profit levels, tick counts, and their respective RR ratios.
Users can adjust the table's Position and text color to suit their preferences.
.....
Visual Enhancements
The indicator uses adjustable background shading between entry and stop loss/take profit lines to visually represent potential trade outcomes. This shading adjusts based on whether the trade is long or short, providing an intuitive understanding of trade performance.
.........
Overall, the Ultra Trade Journal combines visual clarity with detailed analytics, enabling traders to keep a well-organized record of their trades and enhance their trading strategies through insightful data.

Rainbow IndicatorName of the indicator: Rainbow indicator
A brief description of the indicator:
Using this indicator, you can see the "margin of safety" for opening a position in shares of fundamentally strong companies with an acceptable P/E level, as well as the price range for closing a position.
The background to the creation of the indicator:
I got the idea to create this indicator thanks to the concept of the "margin of safety", which was invented by the father of value investing - Benjamin Graham. According to his idea, it is reasonable to buy shares of a company only when the price offered by the market is lower than the "intrinsic value" calculated on the basis of financial statements. The value of this difference is the "margin of safety”. At the same time, the indicator does not copy Graham's idea but develops it relying on my own methodology.
So, according to Graham, the "margin of safety" is a good discount to the intrinsic value of the company. That is, if a company's stock is trading at prices that are well below the company's intrinsic value (on a per-share basis), it's a good opportunity to consider buying it. In this case, you will have a certain margin of safety in case the company is in financial distress and its stock price goes down. Accordingly, the greater the discount, the better.
When it comes to the intrinsic value of a company, there are many approaches to determining it - from calculating the Price-to-book value financial ratio to the discounted cash flow method. As for my approach, I am not trying to find the cherished intrinsic value, but I am trying to understand how fundamentally strong the company is in front of me, and in how many years the investment in it will pay off. To determine fundamental strength, I use the appropriate Fundamental Strength Indicator . To estimate the payback period, I use the P/E ratio (*). If I am satisfied with both of these indicators, I move on to the Rainbow Indicator.
(*) If you want to learn more about the P/E ratio, I suggest reading my two articles on TradingView:
Price / Earnings: Interpretation #1
Price/Earnings: amazing interpretation #2
Indicator calculation methodology:
The Rainbow indicator starts with a simple moving average of one year (this is the thick red line in the center). Hereinafter a year will mean the last 252 trading days.
Applying a moving average of this length - is a good way to smooth out sharp price fluctuations which can happen during a year as much as possible, keeping the trend direction as much as possible. Thus, the moving average becomes for me the center of fluctuations of the imaginary pendulum of the market price.
Then the deviations are calculated from the center of fluctuations. To do this, a certain amount of earnings per share is subtracted from and added to the moving average. This is the diluted EPS of the last year.
Deviations with a "-" sign form the Lower Rainbow of four colors:
- The blue spectrum of the lower rainbow begins with a deflection of -4 EPS and ends with a deflection of -8 EPS.
- Green spectrum of the lower rainbow begins with a deflection of -8 EPS and ends with a deflection of -16 EPS.
- The orange spectrum of the lower rainbow begins with a deflection of -16 EPS and ends with a deflection of -32 EPS.
- Red spectrum of the lower rainbow begins with a deflection of -32 EPS and goes to infinity.
The Lower Rainbow is used to determine the price ranges that can be considered for buying stocks. It is in the spectra of the Lower Rainbow that the very "margin of safety" according to my methodology is located. The Lower Rainbow has the boundaries between the spectra as a solid line . And only the red spectrum of the Lower Rainbow has only one boundary.
Deviations with a "+" sign form the Upper Rainbow of four similar colors:
- The red spectrum of the upper rainbow begins with a deflection of 0 EPS and ends with a deflection of +4 EPS.
- The orange spectrum of the upper rainbow begins with a deflection of +4 EPS and ends with a deflection of +8 EPS.
- Green spectrum top rainbow begins with a deflection of +8 EPS and ends with a deflection of +16 EPS.
- The blue spectrum of the upper rainbow begins with a deflection of +16 EPS and goes to infinity.
The Upper Rainbow is used to determine the price ranges that can be considered for selling stocks already purchased. The top rainbow has boundaries between the spectra in the form of crosses . And only the blue spectrum of the upper rainbow has only one boundary.
The presence of the Empty Area (the size of 4 EPS) above the Lower Rainbow creates some asymmetry between the two rainbows - the Lower Rainbow looks wider than the Upper Rainbow. This asymmetry is deliberate because the market tends to fall much faster and deeper than it grows . Therefore, a wider Lower Rainbow is conducive to buying stocks at a good discount during a period of massive "sell-offs.
The situation, when the Lower Rainbow is below the center of fluctuations (the thick red line) and the Upper Rainbow, is above the center of fluctuations is called an Obverse . It is only possible to buy a stock in an Obverse situation .
The situation when the Lower Rainbow is above the center of fluctuations and the Upper Rainbow is below the center of fluctuations is called Reverse . In this situation, the stock cannot be considered for purchase , according to my approach.
Selling a previously purchased stock is possible in both situations: Reverse and Obverse. After loading the indicator, you can see a hint next to the closing price - Reverse or Obverse now.
Due to the fact that the size of the deviation from the center of fluctuation depends on the size of the diluted EPS, several important conclusions can be made:
- The Obverse situation is characteristic of companies that show a profit over the last year.
- The Reverse situation is typical for companies that show a loss over the last year.
- An increase in the width of both rainbows in the Obverse situation tells us about an increase in profits for the company.
- A decrease in the width of both rainbows in the Obverse situation tells us about a decrease in the company's profits.
- An increase in the width of both rainbows in the Reverse situation tells us about an increase in the company's losses.
- A decrease in the width of both rainbows in the Reverse situation tells us about a decrease in the company's losses.
- The higher the profit level of the company, the greater your "margin of safety" should be. This will provide the necessary margin of safety in case you go into a cycle of declining financial results. The appropriate width of the Lower Rainbow will just create this "margin".
- Increased profits in the company (after buying its stock) will allow you to stay in position longer by widening the Upper Rainbow.
- A decrease in profits in the company (after buying its stock) will allow you to close your position more quickly by narrowing the Upper Rainbow.
Conditions for opening and closing positions:
So, the Lower Rainbow has four differently colored spectra: blue, green, orange, and red. Each one highlights the desired range of prices acceptable for buying in an Obverse situation. The blue spectrum is upper with respect to the green spectrum, and the green spectrum is lower with respect to the blue spectrum, etc.
- If the current price is in the Blue Spectrum of the Lower Rainbow, that is a reason to consider that company for buying the first portion (*) of the stock.
- If the current price has fallen below (into the Green Spectrum of the Lower Rainbow), that is a reason to consider this company to buy a second portion of the stock.
- If the current price has fallen below (into the Orange Spectrum of the Lower Rainbow), it is a reason to consider this company to buy a third portion of the stock.
- If the current price has fallen below (into the Red Spectrum of the Lower Rainbow), that is a reason to consider that company to buy a fourth portion of the stock.
(*) The logic of the Rainbow Indicator implies that no more than 4 portions of one company's stock can be purchased. One portion refers to the number of shares you can consider buying at the current price (depending on your account size and personal diversification ratio - see information below).
The Upper Rainbow also has four differently colored spectra: blue, green, orange, and red. Each of them highlights the appropriate range of prices acceptable for closing an open position.
- If the current price is in the red spectrum of the Upper Rainbow, I close one portion of an open position bought in the red spectrum of the Lower Rainbow.
- If the current price is in the orange spectrum of the Upper Rainbow, I close one portion of an open position bought in the orange spectrum of the Lower Rainbow.
- If the current price is in the green spectrum of the Upper Rainbow, I close one portion of an open position bought in the green spectrum of the Lower Rainbow.
- If the current price is in the blue spectrum of the Upper Rainbow, I close one portion of an open position bought in the blue spectrum of the Lower Rainbow.
This position-closing logic applies to both the Obverse and Reverse situations. In both cases, the position is closed in portions in four steps. However, there are 3 exceptions to this rule when it is possible to close an entire position in whole rather than in parts:
- If there is a Reverse situation and the current price is above the thick red line.
- If I decide to invest in another company and I do not have enough available cash to purchase the necessary number of portions.
- If I find out about events that pose a real threat to the further existence of the company (for example, a bankruptcy filing), I can close the position earlier, without waiting for the price to hit the corresponding Upper Rainbow spectrum.
So, the basic scenario of opening and closing a position assumes the gradual purchase of shares in 4 stages and their gradual sale in 4 stages. However, there is a situation where one of the stages is skipped in the case of buying shares and in the case of selling them. For example, because the Fundamental Strength Indicator and the P/E ratio became acceptable for me only at a certain stage (spectrum) or the moment was missed for a transaction due to technical reasons. In such cases, I buy or sell more than one portion of a stock in the spectrum I am in. The number of additional portions will depend on the number of missed spectra. For example, if I have no position in the stock of the company in question, all conditions for buying the stock have been met, and the current price is in the orange spectrum of the Lower Rainbow, I can buy three portions of the stock at once (for the blue, green, and orange spectrum). I will sell these three portions in the corresponding Upper Rainbow spectra (orange, green, and blue). However, if for some reason the orange spectrum of the Upper Rainbow was missed, and the current price is in the green spectrum - I will sell two portions of the three (in the green spectrum). I will sell the last, third portion only when the price reaches the blue spectrum of the Upper Rainbow.
The Rainbow Indicator also helps calculate the number of shares that can be considered for purchase at the current price position in the Lower Rainbow spectra. To do this, you need to go to the indicator settings.
+ Cash in - Cash out +/- Closed profit/loss + Dividends - Fees - Taxes
Here I indicate the amount of funds deposited to my account, withdrawn from it, profit/loss on closed positions, dividends credited to the account, and taxes deducted from the account.
Diversification coefficient
The diversification coefficient determines how diversified I want my portfolio to be. For example, a diversification coefficient of 20 means that I plan to buy 20 share portions of different companies, but no more than 4 portions per company (based on the number of Lower Rainbow spectra).
The cost of purchased shares of this company (fees excluded)
Here I specify the amount of already purchased shares of the company in question in the currency of my portfolio. For example, if at this point in time, I have purchased 1000 shares at $300 per share, and my portfolio is expressed in $, I enter - $300,000.
The cost of all purchased shares in the portfolio (fees excluded)
Here I enter the amount of all purchased shares for all companies in the currency of my portfolio (without commissions spent on the purchase). This is necessary to determine the amount of available funds available to purchase shares.
After entering all the necessary data, I go to the checkbox, by checking it I confirm that the company in question has been studied with the Fundamental Strength Indicator and the P/E ratio, and their values are satisfactory to me. No calculation is performed without the checkbox checked. This is done intentionally because the application of the Rainbow Indicator for stock acquisition purposes is possible only after studying the Fundamental Strength of the company and an acceptable P/E value.
Next, I click "Ok" and get the calculation in the form of a table on the left.
Free cash in the portfolio
This is the amount of free cash available to purchase stocks. Please note that the price of the stock and the funds in your portfolio must be denominated in the same currency. On TradingView, you can choose which currency to display the stock price in.
Cash amount for one portion
The amount of cash needed to buy one portion of a stock. Depends on the diversification ratio entered.
Potential portions amount
Number of portions, available for purchase at the current price. Can be a fractional number.
Cash amount to buy
The amount of cash needed to buy portions available for purchase at the current price.
Shares amount to buy
Number of shares in portions available for purchase at the current price.
The table also contains additional information in the form of the current value of the company's market capitalization and P/E ratio.
Mandatory requirements for using the indicator:
- works only on a daily timeframe;
- the indicator is only applicable to shares of public companies;
- quarterly income statements for the last year are required;
- an acceptable for you P/E ratio is required to consider the company's stock for purchase;
- the Rainbow Indicator only applies in tandem with the Fundamental Strength Indicator. To consider a company's stock for purchase, you need confirmation that the company is fundamentally strong.
What is the value of the Rainbow Indicator?
- clearly demonstrates a company's profit and loss dynamics;
- shows the price ranges that can be used to open and close a position;
- takes into account the principle of gradual increase and decrease of a position;
- allows calculating the number of shares to be purchased;
- shows the current value of the P/E ratio;
- shows the current capitalization of the company.
Example:
As an example, consider the situation with NVIDIA Corporation stock (ticker - NVDA).
September 02, 2022:
Fundamental Strength Indicator - 11.46 (fundamentally strong company).
P/E - 39.58 (acceptable to me).
Current Price - $136.47 (is in the Orange Spectrum of the Lower Rainbow).
Situation - Obverse.
The basic conditions for buying this company's stock are met. The Rainbow Indicator settings are filled out as follows:
The table to the left of the Rainbow Indicator shows how many shares are possible to buy in the Orange Spectrum of Lower Rainbow at the current price = 10 shares. This corresponds to 2.73 portions.
To give you an example, I buy 10 shares of NVDA at $136.47 per share.
October 14, 2022:
NVDA's stock price has moved into the red spectrum of the Lower Rainbow.
The Fundamental Strength Indicator is 10.81 (fundamentally strong company).
P/E is 35.80 (an acceptable level for me).
Current Price - $112.27 (is in the Red Spectrum of the Lower Rainbow).
Situation - Obverse.
The basic conditions for buying this company's stock are still met. The Rainbow Indicator settings are populated as follows:
The table to the left of the Rainbow Indicator shows how many shares are possible to buy in the Lower Rainbow Red Spectrum at the current price (5 shares). This corresponds to 1.12 portions.
To give you an example, I buy 5 shares of NVDA at $112.27 per share. A total of 3.85 portions were purchased, which is the maximum possible number of portions at the current price level. The remainder in the form of 0.15 portions can be purchased only at a price level below $75 per share.
January 23, 2023:
The price of NVDA stock passes through the red spectrum of the Upper Rainbow and stops in the orange spectrum. As an example, I sell 5 shares bought in the red spectrum of the Lower Rainbow, for example at $180 per share (+60%). And also a third of the shares bought in the orange spectrum, 3 shares out of 10, for example at $190 a share (+39%). That leaves me with 7 shares.
January 27, 2023:
NVDA's stock price has continued to rise and has moved into the green spectrum of the Upper Rainbow. This is a reason to close some of the remaining 7 shares. I divide the 7 shares by 2 and round up to a whole number - that's 4 shares. For my example, I sell 4 shares at $199 a share (+46%). Now I am left with 3 shares of stock.
February 02, 2023:
The price of NVDA stock moves into the blue spectrum of the Upper Rainbow, and I close the remaining 3 shares, for example, at $216 per share (+58%). The entire position in NVDA stock is closed.
As you can see, the Fundamental Strength Indicator and the P/E ratio were not used in the process of closing the position. Decisions were made only on the basis of the Rainbow Indicator.
As another example, let's look at the situation with the shares of Papa Johns International, Inc. (ticker PZZA).
November 01, 2017:
Fundamental Strength Indicator - 13.22 points (fundamentally strong company).
P/E - 21.64 (acceptable to me).
Current Price - $62.26 (is in the blue spectrum of the Lower Rainbow).
Situation - Obverse.
The basic conditions for buying shares of this company are met. The settings of the Rainbow Indicator are filled as follows:
The table to the left of the Rainbow Indicator shows how many shares are possible to buy in the Lower Rainbow Blue Spectrum at the current price - 8 shares. This corresponds to 1 portion.
To give you an example, I buy 8 shares of PZZA at a price of $62.26.
August 8, 2018:
PZZA's share price has moved into the green spectrum of the Lower Rainbow.
The Fundamental Strength Indicator is a 9.83 (fundamentally strong company).
P/E is 16.07 (an acceptable level for me).
Current Price - $38.94 (is in the green spectrum of the Lower Rainbow).
Situation - Obverse.
The basic conditions for buying shares of this company are still met. The Rainbow Indicator settings are populated as follows:
The table to the left of the Rainbow Indicator shows how many shares are possible to buy in the Lower Rainbow Green Spectrum at the current price - 12 shares. This corresponds to 0.93 portions.
To give you an example, I buy 12 shares of PZZA at a price of $38.94. A total of 1.93 portions were purchased.
October 31, 2018:
PZZA's stock price moves into the Upper Rainbow red spectrum and is $54.54 per share. Since I did not have any portions purchased in the Lower Rainbow red spectrum, there is no closing part of the position.
February 01, 2019:
After a significant decline, PZZA's stock price moves into the orange spectrum of the Lower Rainbow at $38.51 per share. However, I am not taking any action because the company's Fundamental Strength on this day is 5.02 (a fundamentally mediocre company).
March 27, 2019:
PZZA's stock price passes the green and blue spectrum of the Upper Rainbow. This allowed to close the previously purchased 12 shares, for example, at $50 a share (+28%) and 8 shares at $50.38 a share (-19%).
Closing the entire position at once was facilitated by a significant narrowing in both rainbows. As we now know, this indicates a decline in earnings at the company.
Risk disclaimer:
When working with the Rainbow Indicator, keep in mind that the release of the Income statement (from which diluted EPS is derived) occurs some time after the end of the fiscal quarter. This means that the new relevant data for the calculation will only appear after the publication of the new statement. In this regard, there may be a significant change in the Rainbow Indicator after the publication of the new statement. The magnitude of this change will depend on both the content of the new statement and the number of days between the end of the financial quarter and the publication date of the statement. Prior to the publication date of the new statement, the latest actual data will be used for the calculations. Also, once again, please note that the Rainbow Indicator can only be used in tandem with the Fundamental Strength Indicator and the P/E ratio. Without these additional filters, the Rainbow Indicator loses its intended meaning.
The Rainbow Indicator allows you to determine the price ranges for opening and closing a position gradually, based on available data and the methodology I created. You can also use it to calculate the number of shares you can consider buying taking into account the position you already have. However, this Indicator and/or its description and examples cannot be used as the sole reason for buying or selling stocks or for any other action or inaction related to stocks.

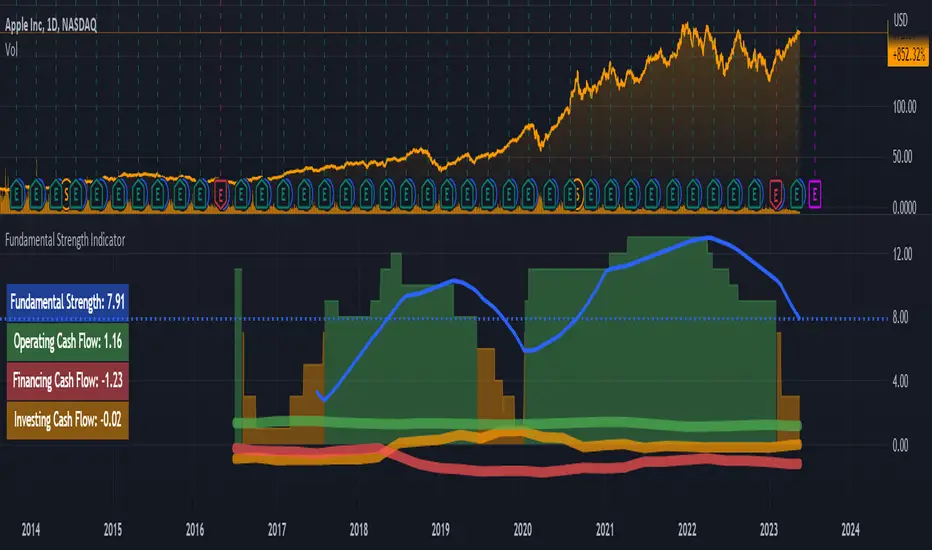
Fundamental Strength IndicatorName of the indicator: Fundamental Strength Indicator
A brief description of the indicator:
Using this indicator, you can evaluate a company in terms of the strength of its financial performance and see how that score has changed over time.
The background to the creation of the indicator:
The main idea that inspired me to create this indicator is: " Even if you buy just 1 share of a company, treat it like buying the whole business ". However, when I need to evaluate the business of thousands of public companies traded on exchanges, there is an objective difficulty: it is very time-consuming. To solve this problem, I had to create a scoring system of the fundamental analysis of the company, embodied in this indicator.
What the indicator looks like:
- First, it is a Histogram with bars of three colors: green, orange, and red. The width of the histogram depends on the depth of data from the company statements. The more historical data, the wider the histogram over time.
The green color of the bars means that the company has been showing excellent financial results by the sum of the factors in that time period. According to my terminology, the company has a " strong foundation " during this period. Green corresponds to values between 8 and 15 (where 15 is the maximum possible positive value on the sum of the factors).
The orange color of the bars means that according to the sum of factors during this period the company demonstrated mediocre financial results, i.e. it has a " mediocre foundation ". Orange color corresponds to values from 1 to 7.
The red color of the bars means that according to the sum of factors in this period of time, the company demonstrated weak financial results, i.e. it has a " weak foundation ". The red color corresponds to values from -15 to 0 (where -15 is the maximum possible negative value on the sum of factors).
- Second, this is the Blue Line , which is the moving average of the Histogram bars over the last year (*). Averaging over the year is necessary in order to obtain a weighted estimate that is not subject to medium-term fluctuations. It is by the last value of the blue line that the actual Fundamental Strength of the company is determined.
(*) The last year means the last 252 trading days, including the current trading day.
- Third, these are operating, investing, and financing Cash Flows expressed in Diluted net income. These flows look like thick green, orange, and red lines, respectively.
- Fourth, this is the Table on the left, which shows the latest actual value of the Fundamental Strength and Cash Flows.
Indicator settings:
In the indicator settings, I can disable the visibility of the Histogram, Blue Line, Cash Flows (each separately), and Table. It helps to study each of the parameters separately. It is also possible to change the color, transparency, and thickness of lines.
Mandatory requirements for using the indicator:
- works only on a daily timeframe;
- only applies to shares of public companies;
- company financial statements for the last 4 quarters and more are required;
- it is necessary to have the data from the Balance sheet, Income statement, and Cash flow statement, required for the calculation.
If at least one component required for calculating the Fundamental Strength is missing, the message " no data to calculate the Fundamental Strength correctly " is displayed. In the same case, but for the operating cash flow, the message " no data to calculate the Operating Cash Flow correctly " is shown, and similarly for other flows.
What is the value of the Fundamental Strength Indicator:
- allows for a quantitative assessment of a company's financial performance in points (from -15 to 15 points);
- allows you to visually track how the company's financial performance has changed (positively/negatively) over time;
- allows to visually trace the movement of main cash flows over time;
- speeds up the process of selecting companies for your shortlist (if you are focused on financial results when selecting companies);
- allows you to protect yourself from investing in companies with weak and mediocre fundamentals.
Indicator calculation methodology:
Guided by the "Treat stock investments as buying the whole business" approach, you can imagine what kind of business an investor is interested in owning and simultaneously determine the input parameters for calculating the indicator.
(!) Here it is important to emphasize that the idea of a benchmark business for investment is a subjective notion, so be sure to check whether it coincides with your own opinion.
For me, a benchmark business is:
- A business that operates efficiently without diminishing the return on shareholders' investment. To assess the efficiency and profitability of a business, I use the following financial ratios (*): Diluted EPS and Return on Equity (ROE). The first two parameters for calculating the indicator are there.
- A business that scales sales and optimizes its costs. From this point of view, the following financial ratios are suitable: Gross margin, Operating expense ratio, and Total revenue. Plus three other metrics.
- A business that turns goods/services into cash quickly and does not fall behind on payments to suppliers. The following financial ratios will fit here: Days payable, Days sales outstanding, and Inventory to revenue ratio. These are three more metrics.
- A business that does not resort to significant accounts payable and shows financial strength. Here I use the following financial ratios: Current ratio, Interest coverage, and Debt to revenue ratio. These are the last three parameters.
(*) If you want to learn more about these financial ratios, I suggest reading my two articles on TradingView:
Financial ratios: digesting them together
What can financial ratios tell us?
Next, each of the parameters is assigned a certain number of points based on its last value or the position of that value relative to the annual maximum and minimum.
For example, if the Current ratio:
- greater than or equal to 2 (+1 point);
- less than or equal to 1 (-1 point);
- more than 1 but less than 2 (0 points).
Or for example, if Diluted EPS:
- near or above the annual high (+2 points);
- near the annual minimum and below (-2 points);
- between the annual maximum and minimum (0 points).
And so on with each of the parameters.
As a result, the maximum number of points a company can score is 15 points. The minimum number of points a company can score is -15 points. These levels are marked with horizontal dotted lines: the green line is for the maximum value, and the red line is for the minimum.
I track the number of points for each day of a company's life on a three-color Histogram. The resulting average value for the last year is on the Blue Line. For me, it is the last value of the Blue Line that determines - this is the actual Fundamental Strength of the company.
The business valuation model I created is more suitable for companies that produce goods or services, and where tangible assets play a significant role in the business. For example, when analyzing companies in the financial sector, you may see the message "no data to calculate the Fundamental Strength correctly". Many of them may simply be missing data that is used as input for the calculation: Inventory to revenue ratio, Days sales outstanding, etc.
Examples:
Below I will evaluate various companies using the Fundamental Strength Indicator.
Tesla, Inc.
The indicator shows that since 2020, Tesla Inc. has been steadily increasing its Fundamental Strength (from 3.27 in Q1 2020 to 12.79 in Q1 2023). This is noticeable both by the color change of the Histogram from orange to green and by the rising Blue Line. If you look in detail at what has been happening with the financials during this time, it's clear what meaningful work the company has done. Revenues have almost quadrupled. Earnings per share have increased 134 times. At the same time, total debt to revenue fell almost 10 times.
Keurig Dr Pepper Inc.
The company, formed in 2018 by the merger of Keurig Green Mountain and Dr Pepper Snapple Group, has failed to deliver outstanding financial results, causing its Fundamental Strength to fall from 4.63 in Q1 2018 to -0.53 in Q1 2023. During this period, the drop in diluted earnings per share was accompanied by higher debt and deteriorating liquidity.
Costco Wholesale Corporation
Wholesaler Costco has been surprisingly stable in its financial performance and with steady growth in both earnings and revenue. This is the reason why the Histogram bars are exceptionally green throughout the calculation of the indicator. The Fundamental Strength has not changed in three years and is high at 11 points.
As an additional filter, for example, when comparing two companies where all other conditions are equal - I use the dynamics of Cash Flows expressed in Diluted net income (*). These are the thick green, orange, and red lines over the Histogram.
Why do I use income as a unit of measure of Cash Flows? Because it is a good way to make the scale of indicator values the same for companies from different countries, with different currencies. It also allows you to use a single value scale for both Cash Flows and Fundamental Strength.
(*) If you want to learn more about Cash Flows, I suggest reading my two articles on TradingView:
Cash flow statement or Three great rivers
Cash flow vibrations
So, an additional filter shows the dynamics of Cash Flows over time.
To interpret the dynamics of Cash Flows, I pay attention to the following patterns:
- How the cash flows are positioned in relation to each other;
- In which zone each of the cash flows is located - in the positive or negative;
- What is the trend of each of the cash flows;
- How volatile each of the cash flows is.
As an example, let's look at several companies in order to interpret the dynamics of their Cash Flows.
John B. Sanfilippo & Son, Inc.
This is the most ideal situation for me: operating cash flow (green line) is above the other cash flows, investment cash flow (orange line) is near zero and practically unchanged, and financial cash flow (red line) is consistently below zero. This picture shows that the company lives off its operating cash flow, does not increase its debt, does not spend a substantial amount of money on expensive purchases, and retains (does not sell off) assets.
Parker Hannifin Corporation
With stable operating cash flow (green line), the company implements investment programs by raising additional funding. This is noticeable due to an increase in financial cash flow (red line) and a simultaneous decrease in investment cash flow (orange line) with a significant deepening into negative areas. Apparently, there is not enough operating cash flow to realize the planned investments. One has to wonder how sustainable a company can be if it invests in its development using borrowed funds without a subsequent increase in operating cash flow.
Schlumberger N. V.
The chaotic intertwining of cash flows outside of the Fundamental Strength range (-15 to 15) is indicative of the company's rich life, but to me, it is an indicator of high riskiness of its actions. And as we can see, Fundamental Strength has only begun to strengthen in the last year, when the external appearance of cash flow has normalized.
Risk disclaimer:
When working with the Fundamental Strength Indicator and the additional filter in the form of Cash Flows, you should understand that the publication of the Balance sheet, Income statement, and Cash flow statement takes place sometime after the end of the financial quarter. This means that new relevant data for the calculation will only appear after the publication of the new statements. In this regard, there may be a significant change in the values of the Indicator after the publication of new statements. The magnitude of this change will depend both on the content of the new statements and on the number of days between the end of the financial quarter and the publication date of the statements. Until the date of publication of the new statements, the latest relevant data will be used for calculations.
I would like to draw your attention to the fact that the calculation of Fundamental Strength and Cash Flows requires the availability of data for all parameters of the valuation model . It uses data that is exclusively available on TradingView (there is no reconciliation with other sources). If at least one parameter is missing, I switch to another company's analysis to continue using the indicator.
Thus, the Fundamental Strength Indicator and an additional filter in the form of Cash Flows make it possible to evaluate the financial results of the company based on the available data and the methodology I created. A simple visualization in the form of a three-color Histogram, a Blue line, and three thick Cash Flow lines significantly reduces the time for selecting fundamentally strong companies that fit the criteria of the selected model. However, this Indicator and/or its description and/or examples cannot be used as the sole reason for buying or selling stocks or for any other action or inaction related to stocks.
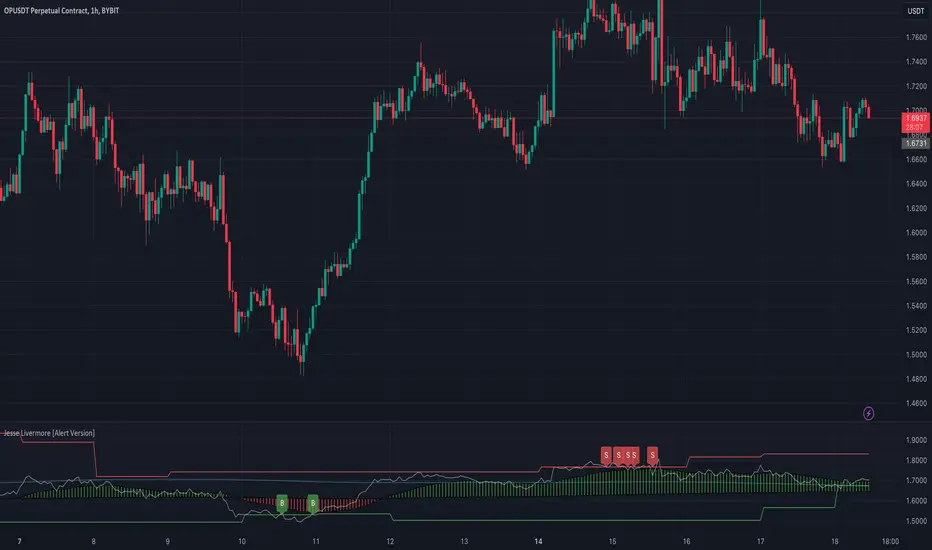
Jesse Livermore Strategy [Buy & Sell]Jesse Livermore was a famous trader who made a fortune in the early 20th century through his unique approach to trading.
While he did not leave behind a single, specific trading strategy that is attributed to him, I have tried to reproduce one.
His trading strategy was based on understanding market trends and sentiment, and he used several technical indicators to identify potential entry and exit points.
Some of the indicators he used include:
Price Action:
Jesse Livermore relied heavily on price action to make trading decisions.
He believed that the price itself was the best indicator of market sentiment, and that by analyzing the price movement, he could identify trends and market behavior.
Volume:
Livermore also used volume to confirm price movements.
He believed that a rise in volume along with a price increase indicated a strong bullish trend, while a decrease in volume with a price increase indicated a weak trend.
Pivot Points:
Another key component of Jesse Livermore's trading strategy was pivot points.
He used pivot points to identify potential support and resistance levels in the market, which he then used to identify potential entry and exit points.
Jesse Livermore outlined a simple trading system: wait for pivotal points before entering a trade.
When the points come into play, trade them using a buffer, trading in the direction of the overall market.
Let the price dictate your actions and stay with profitable trades until there is good reason to exit the trade.
The one I have tried to reproduce it's based on Pivot High and Low looking back 5 Days, and the average price oscillator.
When the price is bellow the support defined line it's time to Buy ( Long Position ), when the Price line is over the Resistance Line it's time to Sell ( Short Position )
This indicator has to be checked, and tried into a Real-Time context, so using the Replay functionality of TradingView is the best way to see and understand how Signals comes
(NB: look back into the chart without Replay should give you wrong Buy/Sell information)
The Indicator can be used on every TimeFrames, but the better ones are 5min - 15min.
I will add the possibility to choose the TimeFrames value for Pivot High and Low.
I will create a version with Alerts for Buy and Sell and the possibility to integrate it with "3commas Bot" where the best deal can be to set a TP to 1% for each Long or Short Entry.
Let's try it and comment for doubts or questions.
ViPlay Signal demo versionViPlay Signal is a trading indicator designed for the TradingView platform that generates buy and sell signals based on a combination of technical indicators. The indicator uses two different Moving Averages, the Market Range Oscillator (MRO), and the Williams Percent Range (WPR) to provide traders with a comprehensive set of tools for identifying potential entry and exit points, confirming trends, and managing risk.
The Moving Averages used in the indicator are the 50-period and 200-period Simple Moving Averages (SMA) of the closing price, which are widely used in technical analysis to identify trends and support/resistance levels. The Market Range Oscillator (MRO) is a proprietary indicator that measures the range of the market, which can help identify extreme market conditions. The MRO is used to determine buy and sell signals, with two different calculations performed to identify each type of signal.
The Williams Percent Range (WPR) is a momentum indicator that helps traders identify overbought and oversold conditions in the market. By using the WPR in combination with the Moving Averages and the MRO, the ViPlay Signal indicator can provide more accurate and reliable signals to traders.
The indicator allows users to select a strategy from a dropdown menu that includes BTC 1m, 3m, 15m, 4H, and LTC 3m, ideal 5m, and 15m super. The values of some of the parameters change based on the selected strategy, allowing traders to customize the indicator to their specific needs.
The ViPlay Signal indicator plots buy and sell signals on the chart as labels with arrows pointing up or down to indicate the direction of the trade. A green arrow represents a buy signal, and a red arrow represents a sell signal. The chart is clean and easy to read, with complete symbol/timeframe and script name information provided.
In summary, the ViPlay Signal indicator is a powerful and customizable tool for traders looking to improve their trading performance. The indicator provides a comprehensive set of technical analysis tools, including Moving Averages, the MRO, and the WPR, to help traders identify potential trading opportunities and manage risk.

Most Power V5 Most Power V5
The MOST indicator is an indicator used as a Moving Stoploss. The MOST indicator also generates a buy signal in case the prices rise, unlike the traditional indicators that allow you to make stop losses.In the MOST POWER V5 indicator, stoploss generates its signals using moving averages such as 'SMA', 'EMA', 'WMA', 'VWMA', 'HMA', 'SMMA', 'DEMA' rather than just the current price. In this way, it aims to prevent false signals that may be produced by excessive price movements during the day.
MOST POWER Indicator follows the average by preserving the stop loss distance in the movement of the moving average in the same direction.
The second variable that creates the MOST POWER curve is the stop loss distance that gives power to MOST with the moving average used and the shift rate that provides the stop signal. In this version, this distance is prepared with 2 separate inputs for both buy and sell.You can set these values as "percentage for long trend" and "percentage for short trend" in the indicator input properties.
You can also enter your Take Profit-1, Take Profit-2-, Take Profit-3- and Stop Loss levels in the indicator input properties, especially if you are interested in algo trading or to take advantage of the wonderful alarm setup features of tradingview and get the chance to get maximum profit. (If you enter Take Profit-1, Take Profit-2-, Take Profit-3- and Stop Loss levels as 0. Only buy and sell labels will appear on the indicator.)
Also, activate the amplitude filter option from the indicator input settings to get less signal and filter our inputs.
In addition, the entry price, take profit1, take profit2, take profit3 values for the last transaction opened to make things easier are located in the upper right corner of your graph as a table.
Important note: No indicator guarantees investment. That's why the tests you will do before real trades are very important in this indicator. I wish you all successful trades.
i will show how works with examples
Example 1
If you enter Take Profit-1, Take Profit-2-, Take Profit-3- and Stop Loss levels greater than 0
Example 2
If you enter Take Profit-1, Take Profit-2-, Take Profit-3- and Stop Loss levels as 0 (u will see only buy - sell labels)
Example 3
if select Amplitude Filter is on . you will see less signal
how works Amplitude Filter whats logic ?
if Amplitude Filter is active the signal from mostpower will be combined with Amplitude Filter.
for example, if the amplitude value is 2, the highest price and the lowest price of the last 2 bars are calculated. then this amplitude value is calculated for sma with its source high and low. Based on these values, the trend is determined in the amplitude of the price movement.
Important note: No indicator guarantees investment. That's why the tests you will do before real trades are very important in this indicator. I wish you all successful trades.

Band of Filtered RS by Mustafa ÖZVERBand of Filtered RS by Mustafa ÖZVER
This code shows a range (max-min values) price may get if we get strong movements. These values is based on RSI (Relative Strange Index). And also these are calculated using RSI, if we get trades to make rsi is equal to 25 (or rsi down limit) or 75 (rsi up limit) or any value you set, how much will price value get? This code calculate these and shows these to you on graph.
This price are between these band limits because we expect cross reaction to hard movements on price.
For scalping, we can use these values as
long signal when price under down limit,
short signal when price over up limit,
But only these values can not guarantee good results for trading. BE CAREFUL

Pierre_crypt0 Medium/Long Term Trend EMAEMA / MA used by pierre_crypt0 to identify the medium / long-term trend
- Green = 100 EMA
- Blue = 200 MA
- Pink = 300 MA
- Black = 200 EMA
These three are used to refer to the short-term trend. The leading indicator he uses alongside horizontal levels to decide on his exposure/positioning.
Everyone keeps asking on Twitter, just compiled them into an indicator.

Price change scalping short and long strategy indicatorPrice change scalping Short and Long indicator uses a rate of change momentum oscillator to calculate the percent change in price between a period of time. Rate of change calculation takes the current price and compares it to a price of "n" periods while the period of time can be defined by a user. The calculated rate of change value is then compared to the upper threshold and the lower threshold values to determine if a position should be opened. If the threshold is crossed and filtering conditions are met a strategy position will be triggered. Entry, take profit, and stop loss prices are calculated and displayed on the chart as well as positions directions. Once the entry price is crossed, a long or short position is created and once the take profit price is crossed, the stop loss price will begin to trail behind the price action using the close of the previous bar. Once the trailing stop price is crossed, the position is closed. If the entry price is not crossed and the price action crosses the stop level, the trade setup is cancelled. The indicator is enhanced by DCA algorithm which allows to average entry price with safety orders. The script also allows to use Martingale coefficient to increase averaging power
Advantages of this script:
The indicator has custom alert settings for each strategy action
The indicator can be used with 3Commas, Cryptohopper, Alertatron or Zignaly bots
High frequency and low duration of trades
Can be used with short-term timeframes ranging from 5 to 60 minutes
Indicator is sustainable to market slumps due to DCA implementation
Can be used for short and long positions (can be adjusted to long only, short only or both)
Can be applied to any market and quote currency
Easy to configure user interface settings
Built in detailed statistic menu
How to use?
1. Apply the indicator to a trading pair your are interested in using 5 to 60 minutes timeframe chart
2. Configure the indicator: change layer values, order size multiple and take profit/stop loss values according to current market cycle stage
3. Set up a TradingView custom alert using the indicator settings to trigger on a condition you are interested in
4. indicator will send alerts when to enter and when to exit positions which can be applied to your portfolio using external trading platforms
5. Update settings once market conditions are changed using backtests on a monthly period
Crypto Longs & Shorts (Multi Exchange) - InFinitoThis indicator uses data provided by different crypto derivative exchanges to estimate and display the potential Longs and Shorts opened and closed during a determined period. The indicator supports multiple exchanges and coins.
Knowing the the behavior of traders as in how they're positioning can be useful for different things like:
Get a sense of market sentiment
Better anticipating which way liquidity/stop hunts might potentially go.
All data is calculated based off OI data provided by exchanges except for Bitfinex which provides both Longs and Shorts opened and closed
Preset exchanges included are:
Bitfinex
Binance: USDT, USDPERP & BUSD pairs
Bitmex: USDT & USD pairs
Kraken
The indicator is preset to work with BTC but it can be easily changed to any coin by typing it's name (Capitalized) in the Coin Name box

BBSS - Bollinger Bands Scalping SignalsModified Bollinger Bands Indicator
Added:
- color change divergence (green) and narrowing (red) of the upper and lower bands
- color change of the moving average - upward trend (green) and downward trend (red)
- the appearance of a potential signal for long and short positions when the candle closes behind the upper or lower bands.
How to use the indicator:
Long conditions:
- the price breaks through the upper band
- Bollinger bands are expanding and should be green
- the mid-line is green
- the trigger candle should be green
Short conditions:
- the price breaks through the lower band
- Bollinger bands are expanding and should be red
- the mid-line is red
- the trigger candle should be red

RPS OscillatorGood day to everyone!
How RPS Oscillator is different and useful while taking positions?
RPS Oscillator is a volume weighted oscillator which provides major buy/sell signals (Look for Green Up and Red Down Signals).
Users can enable to show leading (minor) buy/sell signals (Look for small Green/Red Circles). By default, it's disabled to avoid too many calls.
How to take trades using RPS Oscillator?
RPS Oscillator has a moving average with three colors.
Aqua - Uptrend
Yellow - Probable Trend Reversal or Major Volatile Move Coming
Red - Downtrend
How to find the strength of the trend using RPS Oscillator?
The uptrend is strong when you see the moving average in aqua color moving upwards.
The downtrend is strong when you see the moving average in red color moving downwards.
Avoid take any positions when the moving average is going sideways.
How to use the divergence in the RPS Oscillator?
The Bullish divergence gives the alert for the trend reversal to the upside.
The Bearish divergence gives the alert for the trend reversal to the downside.
The Hidden Bullish divergence gives the alert for the trend correction to the upside.
The Hidden Bearish divergence gives the alert for the trend correction to the downside.
How to get notified through RPS Oscillator without keeping eyes on the charts?
You can configure alerts for major happenings in the oscillator.
Major Long/Buy Signal
Major Short/Sell Signal
Bullish Divergence
Bearish Divergence
Hidden Bullish Divergence
Hidden Bearish Divergence
~RPS~
MPF EMA Cross Strategy (8~13~21) by Market Pip FactoryThis script is for a complete strategy to win maximum profit on trades whilst keeping losses at a minimum, using sound risk management at no greater than 1.5%
The 3x EMA Strategy uses the following parameters for trade activation and closure.
1/ Daily Time Frame for trend confirmation
2/ 4 Hourly Time Frame for trend confirmation
3/ 1 Hourly Time Frame for trend confirmation AND trade execution
4/ 3x EMAs (Exponential Moving Averages)
* EMA#1 = 8 EMA (Red Color)
* EMA#2 = 13 EMA (Blue Color)
* EMA#3 = 21 EMA (Orange Color)
5/ Fanning of all 3x EMAs and CrossOver/CrossUnder for Trend Confirmation
6/ Price Action touching an 8 EMA for trade activation
7/ Price Action touching a 21 EMA for trade cancellation BEFORE activation
* For LONG trades: 8 EMA would be ABOVE 21 EMA
* For SHORT trades: 8 EMA would be BELOW 21 EMA
* For trade Cancellation, price action would touch the 21 EMA before trade is activated
* For trade Entry, price action would touch 8 EMA
Once trigger parameter is identified, entry is found by:
a) Price action touches 8 EMA (Candle must Close for confirmed Trade preparation)
b) Trade preparation can be cancelled before trade is activated if price action touches 21 EMA
c) Trailing Stop Loss can be used (optional) by counting back 5 candles from current candle
CLOSURE of a Trade is identified by:
e) 8 EMA crossing the 21 EMA, then close trade, no matter LONG or SHORT
f) Trail Stop Loss
IMPORTANT:
g) No more than ONE activated trade per EMA crossover
h) No more than ONE active trade per pair
NOTE: This strategy is to be used in conjunction with Cipher Twister (my other indicator) to reduce trades on
sideways price action and market trends for super high win ratio.
NOTE: Enabling of LONGs and SHORTs Via Cipher Twister is done by using the previous
green or red dot made. Additionally, when the trend changes, so do the dot's validity based
on being above or below the 0 centerline.
----------------------------
Strategy and Bot Logic
----------------------------
.....::: FOR SHORT TRADES ONLY :::.....
The Robot must use the following logic to enable and activate the SHORT trades:
Parameters:
$(crossunder)=8EMA,21EMA=Bearish $(crossover)=8EMA,21EMA=Bullish $entry=SELL STOP ORDER (Short)
$EMA#1 = 8 EMA (Red Color) $EMA#2 = 13 EMA (Blue Color) $EMA#3 = 21 EMA (Orange Color)
Strategy Logic:
1/ Check Daily Time Frame for trend confirmation if:
(look back up to 50 candles - find last cross of EMAs)
$(chart)=daily and trend=$(crossunder) then goto 2/ *Means: crossunder = ema21 > ema8
$(chart)=daily and trend=$(crossover) then stop (No trades) *Means: crossover = ema8 > ema21
NOTE: This function is switchable. 0=off and 1=on(active). Default = 1 (on)
2/ Check 4 Hourly Time Frame for trend confirmation if:
(look back up to 50 candles - find last cross of EMAs)
$(chart)=4H and trend=$(crossunder) then goto 3/ *Means: crossunder = ema21 > ema8
$(chart)=4H and trend=$(crossover) then stop (No trades) *Means: crossover = ema8 > ema21
NOTE: This function is switchable. 0=off and 1=on(active). Default = 1 (on)
3/ 1 Hourly Time Frame for trend confirmation AND trade execution if:
(look back up to 50 candles - find last cross of EMAs)
$(chart)=1H and trend=$(crossunder) then goto 4/ *Means: crossunder = ema21 > ema8
$(chart)=1H and trend=$(crossover) then stop (No trades) *Means: crossover = ema8 > ema21
4/ Trade preparation:
* if Next (subsequent) candle touches 8EMA, then set STOP LOSS and ENTRY
* $stoploss=3 pips ABOVE current candle HIGH
* $entry=3 pips BELOW current candle LOW
5/ Trade waiting (ONLY BEFORE entry is hit and trade activated):
* if price action touches 21 EMA then cancel trade and goto 1/
Note: Once trade is active this function does not apply !
6/ Trade Activation:
* if price activates/hits ENTRY price, then bot activates trade SHORTs market
7/ Optional Trailing stop:
* if active, then trailing stop 3 pips ABOVE previous HIGH of previous 5th candle
or * Move Stop Loss to Break Even after $X number of pips
NOTE: This means count back and apply accordingly to the 5th previous candle from current candle.
NOTE: This function is switchable. 0=off and 1=on(active). Default = 0 (off)
8/ Trade Close ~ Take Profit:
* Only TP when
$(chart)=1H and trend=$(crossover) then close trade ~ Or obviously if Stop Loss is hit if 7/ is activated.
----------END FOR SHORT TRADES LOGIC----------
.....::: FOR LONG TRADES ONLY :::.....
The Robot must use the following logic to enable and activate the LONG trades:
Parameters:
$(crossunder)=8EMA,21EMA=Bearish $(crossover)=8EMA,21EMA=Bullish $entry=BUY STOP ORDER (Long)
$EMA#1 = 8 EMA (Red Color) $EMA#2 = 13 EMA (Blue Color) $EMA#3 = 21 EMA (Orange Color)
Strategy Logic:
1/ Check Daily Time Frame for trend confirmation if:
(look back up to 50 candles - find last cross of EMAs)
$(chart)=daily and trend=$(crossover) then goto 2/ *Means: crossover = ema8 > ema21
$(chart)=daily and trend=$(crossunder) then stop (No trades) *Means: crossunder = ema21 > ema8
NOTE: This function is switchable. 0=off and 1=on(active). Default = 1 (on)
2/ Check 4 Hourly Time Frame for trend confirmation if:
(look back up to 50 candles - find last cross of EMAs)
$(chart)=4H and trend=$(crossover) then goto 3/ *Means: crossover = ema8 > ema21
$(chart)=4H and trend=$(crossunder) then stop (No trades) *Means: crossunder = ema21 > ema8
NOTE: This function is switchable. 0=off and 1=on(active). Default = 1 (on)
3/ 1 Hourly Time Frame for trend confirmation AND trade execution if:
(look back up to 50 candles - find last cross of EMAs)
$(chart)=1H and trend=$(crossover) then goto 4/ *Means: crossover = ema8 > ema21
$(chart)=1H and trend=$(crossunder) then stop (No trades) *Means: crossunder = ema21 > ema8
4/ Trade preparation:
* if Next (subsequent) candle touches 8EMA, then set STOP LOSS and ENTRY
* $stoploss=3 pips BELOW current candle LOW
* $entry=3 pips ABOVE current candle HIGH
5/ Trade waiting (ONLY BEFORE entry is hit and trade activated):
* if price action touches 21 EMA then cancel trade and goto 1/
Note: Once trade is active this function does not apply !
6/ Trade Activation:
* if price activates/hits ENTRY price, then bot activates trade LONGs market
7/ Optional Trailing stop:
* if active, then trailing stop 3 pips BELOW previous LOW of previous 5th candle
or * Move Stop Loss to Break Even after $X number of pips
NOTE: This means count back and apply accordingly to the 5th previous candle from current candle.
NOTE: This function is switchable. 0=off and 1=on(active). Default = 0 (off)
8/ Trade Close ~ Take Profit:
* Only TP when
$(chart)=1H and trend=$(crossunder) then close trade ~ Or obviously if Stop Loss is hit if 7/ is activated.
----------END FOR LONG TRADES LOGIC----------
IMPORTANT:
* If an existing trade is already open for that same pair, & price action touches 8EMA, do NOT open a new trade..
* bot must continuously check if a trade is currently open on the pair that triggers
* New trades are to be only opened if there is no active trade opened on current pair.
* Only 1 trade per pair rule !
* 5 simultaneous open trades (not same pairs) default = 5 but value can be changed accordingly.
* Maximum risk management must not exceed 1.5% on lot size
*** Some features are not yet available autoated, they will be added in due course in subsequent version updates ***

unrealized pnl for btcusdt (or any linear perp)haven't seen this published, so i made it to watch my position while looking at my TV chart
right now, code works for just linear contracts (base currency margined, not quote currency) and i will have to add the code for inverse perps soon in the next update
very simple tool... not much to explain
just enter
long or short
average entry
position size (designed for btc since i'm a maxi, but entering the amount of any base currency should work)
take profit
then you'll get candles for your position and a line for your TP (and its amount)
next version will add a feature to plot inverse perps
(sorry TV if this doesn't abide by the House Rules exactly)
