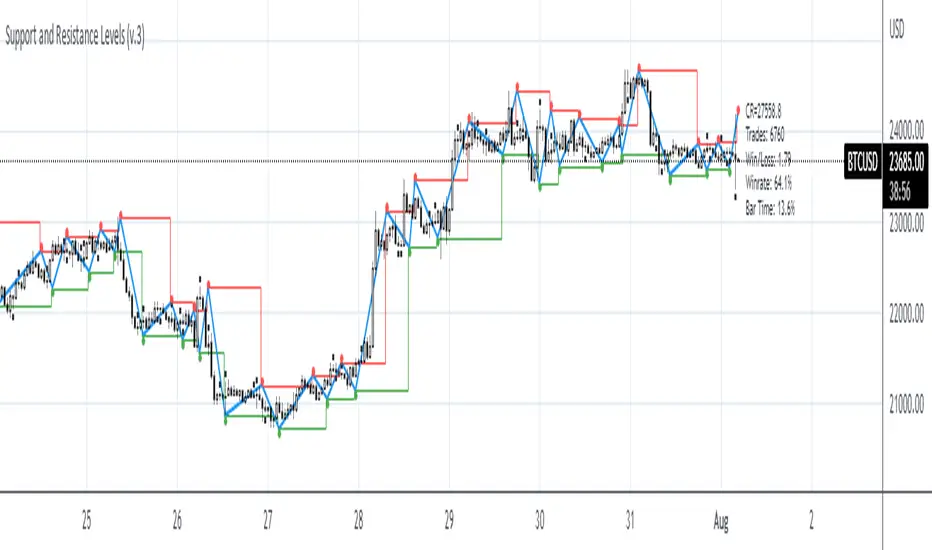
Support and Resistance Levels (v.3)Support and Resistance Levels augmanted and reprocessed
Description:
This is an augmented version of my earlier script that can be found here:
This time it features zigzag and channel lines, signal generation and filtering and performance testing. Signal generation and filtering procedures are used only for performance testing, not for the actual labelling. The labelling is governed by zigzag logic.
Levels
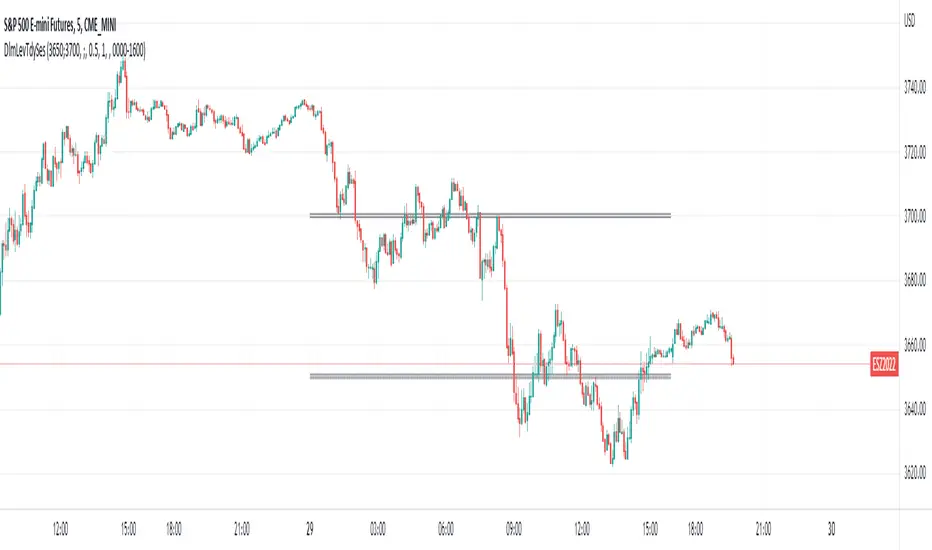
Delimited Levels Today SessionThis script takes a delimited string of level values (up to 12) and plots them on the chart as per parameters.
Alerts can be set up for crossing, etc, using the Alerts panel as per usual.
Very handy if you have a spreadsheet or list of values to plot.
For example, say your spreadsheet has a list of these 12 levels to plot:
3800
3811
3822
3837
3851
3862
3877
3887
3902
3913
3928
The values could be copied to notepad / text editor, and the line breaks replaced with a delimiter, such as the ';' character (note: no trailing delimiter), to produce a delimited string:
3800;3811;3822;3837;3851;3862;3877;3887;3902;3913;3928
And then simply copy / paste this delimited string into the "Levels Delimited String" parameter.
Note: This script builds upon earlier script:
Enhancements include:
- Plot only for latest day (weekends factored in)
- Plot only for specified session
- Plot as bands or as lines
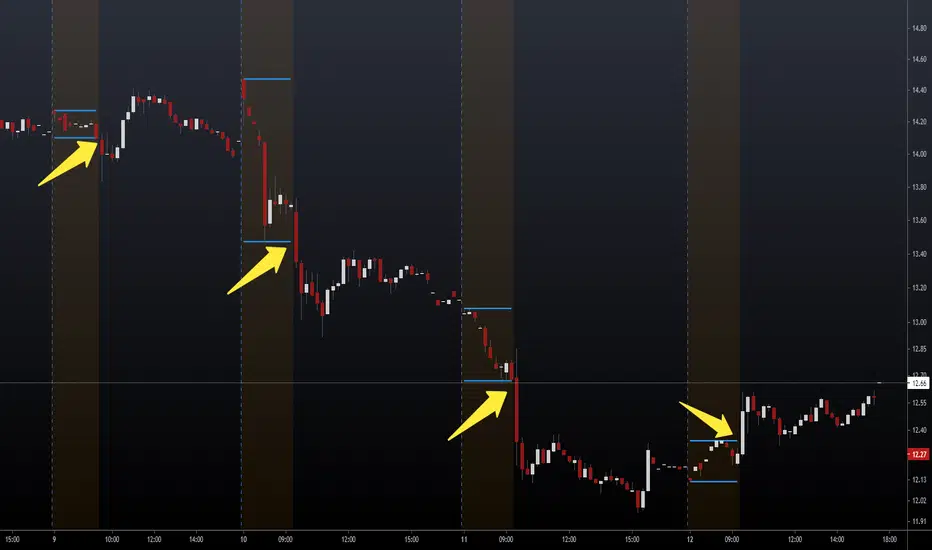
NSDT Pre-Market Breakout LevelsA simple way to identify potential breakouts at the New York market open. This indicator plots the high and low of the New York Pre-Market, providing a great visual of a potential breakout levels.
Previous Period Levels - X Alerts====== ABOUT THIS INDICATOR
- A simple but highly customisable display of previous higher time-frame
OHLC values, drawn using line.new and label.new. Nothing fancy but...
- Customised resolution input which excludes time frames lower than 1 hour
while extending the common higher reference inputs to include:
• 6, and 12 Hour
• 5 Day
• 3, and 6 Month
• 1 Year
- Alert conditions using an adjustable SMA to help reduce false positive
spam.
- Full visual customisation options for (almost) every aspect, so it can be
tuned to suit most individual preferences.
- In line with the miriad visual customisation options is the ability to
change the display format of the Labels, to show more or less information,
or disable them altogether.
====== REASON FOR STUDY
- To practice advanced user input option handling to allow for a full visual
customisation experience without stepping outside of, or interfering with,
the intended function of the indicator.
- Provide reasonably clear code commenting and structure in order to be
useful as a potential learning aid for others, and future reference for
myself.
====== DISCLAIMER
Any trade decisions you make are entirely your own responsibility.
I've made an effort to squash all the bugs, but you never know!
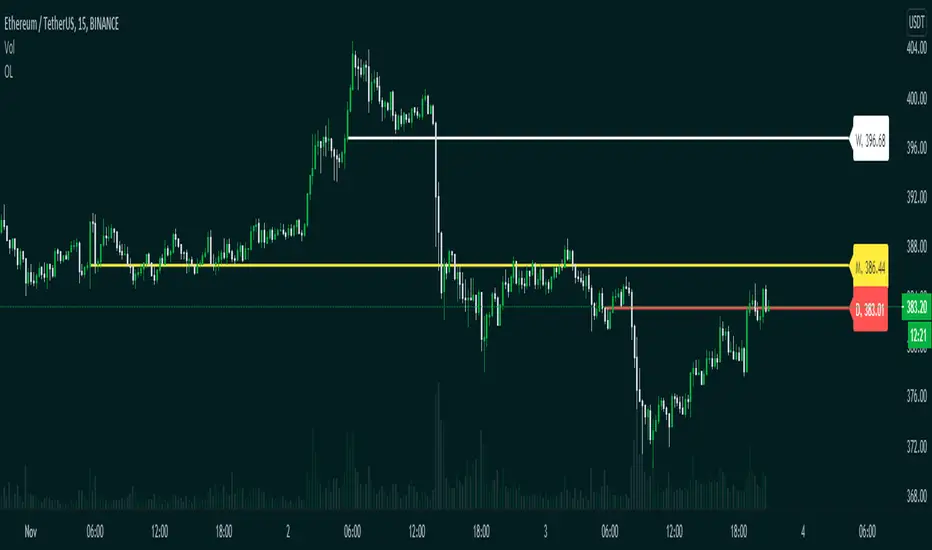
NSDT Daily Key LevelsSimple script to show key levels of current day and previous day. Labels can be turned on and off as needed. Line colors, thickness and style can be changed. Modified the "M/W/D Level" script from paaax. Credit for original code goes to him. Link to script and profile posted in code of this script.

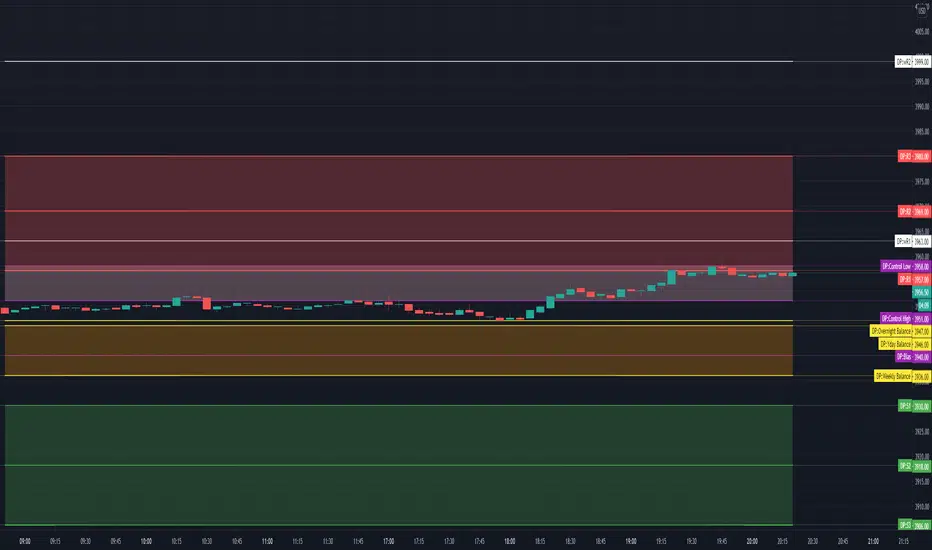
TV Day Plan Template 1This is a template for daytraders, swing traders, supply and demand traders, and even swing traders. As traders we are always scanning charts for levels and zones. This template makes it easy and convenient to find, change, and chart levels. As a daytrader, I will use this daily. I always have daily and weekly targets in mind. This will ensure I don't lose track of the bigger picture while trading the smaller moves. Levels in this chart are not auto calculated. They are manually input. This script is a quick and convenient way to chart multiple levels without having to go through each drawing, change the settings, and then redraw the level. Currently this will only save levels for one ticker. A workaround is to use multiple instances and then hide the ones not in use. Another way is to use the second part to this script, Day Plan Levels Template 2. If only using one instance, you can save the levels as default. This will save them. However, if saving levels as default while using multiple instances of this indicator, the other levels will erase. The way that I use this that I have daily levels for #ES in one instance and then daily levels for #NQ in another instance.
This script is very customizable
Options include
On/Off Toggles
Light/Heavy Versions - Light versions does not plot. Heavy version will plot and show levels in info bar and price axis
Balance Levels
Control Levels
3 Support and 3 Resistance levels for daily and weekly
2 Support and 2 Resistance Clouds
Balance and Control Clouds
"0" value disables and hides levels
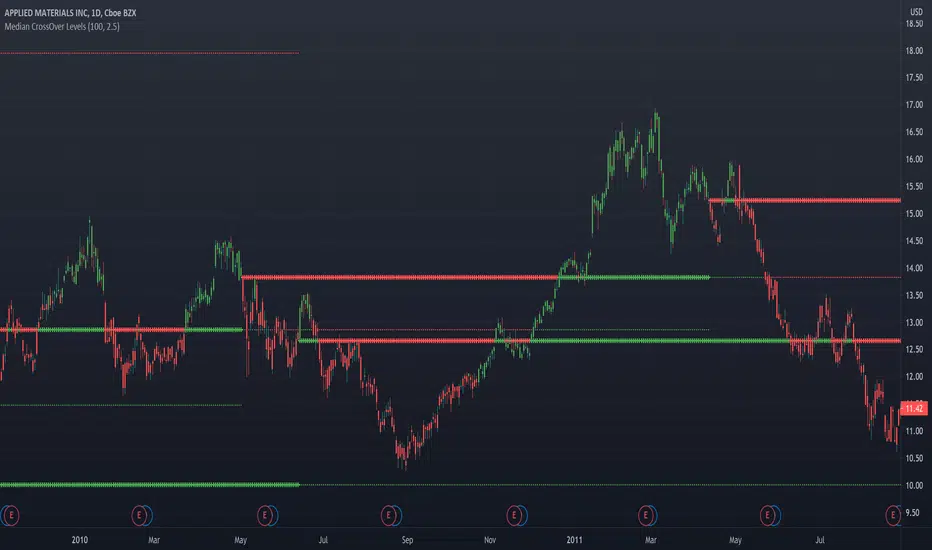
Median CrossOver LevelsPlots levels representing the prices that the stock closed above its n-period moving median(default=100).
2 thickest lines represents the two most recent crossover levels.
Candles are colored green if the price is currently above its moving median and red if below.
Previous OHLCThe scripts places horizontal levels on your charts indicating the previous Daily, Weekly or Monthly OHLC values over the current timeframe.
Slightly modified version of Nanda86's "Previous OHLC" script. I corrected a couple of bugs and added more control over colors and labels in general. I also removed the hourly OHLCs.

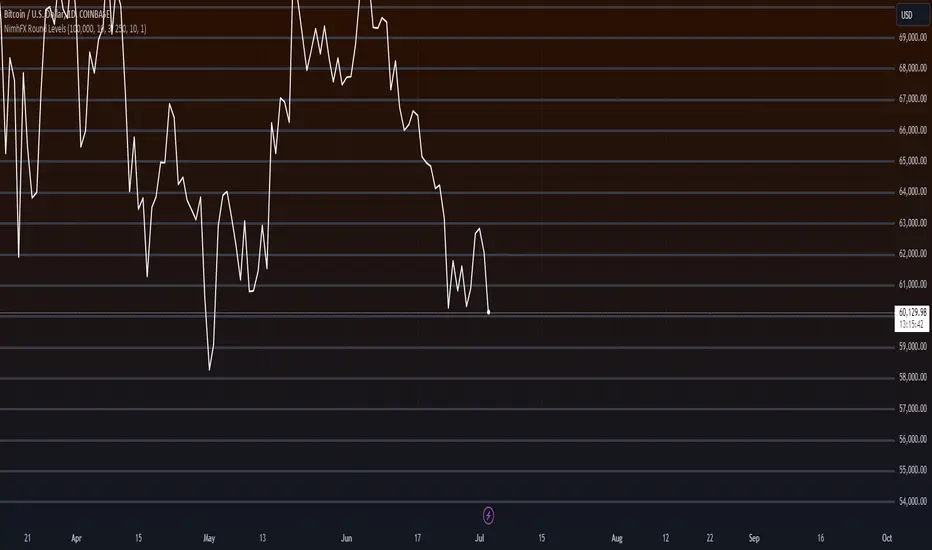
NimhFX Grid LevelsA simple levels indicator for plotting pre-defined price grid.
The default setting is as follows:
Group 1 shows 1000 Point (100 Pip divisions)
Group 2 shows 250 Point (25 Pip divisions)
Groups are duplications of each other to allow multiple divisions to be visible at once, e.g. 100 Pip grid and a 25 pip grid with differing visuals as the default setting.
Number of Lines above/below will alter the amount of lines drawn, change as required, note: Tradingview seems to try to capture all drawings when double-clicking the right price index which can cause this to compress the data.
depending on preferred timeframe you may want to alter this for example to a 10 pip grid (100 point)
Levels (Nephew_Sam_)Initial Commit.
1. Plots Asian Range based on time provided
- option to extend line to end of day
- option to fill range with background
2. Plots significant highs/low using fractals
3. Plot Daily/Weekly/Monthly OHLC

RK's 13 - Moving Average with Fibonacci Lines█ OVERVIEW
After some chart measures, I noticed that if we took the difference between fast and slow Moving Average lines and apply the Fibonacci ratios, we get a very reliable support and resistance level for each bar.
So, I made this script to help me (and anyone who wants to use it) know where we should close or put stops in our orders.
█ HOW TO USE IT:
Choose your preferred Moving Average type and Lengths;
Select the Fibonacci Ratios and test Reverse Lines option to get better levels.
Other useful input options:
Show Labels: Display every Fibonacci Ratio you are using;
Labels Offset Position: Place where the Fibonacci Ratio will appear and get the price in that position;
Project Moving Average Lines in the Future: Draws project Line in the chart.
Tips:
• If you put your mouse in the ratio label, it will show the price in that position
• This script works better when the lines are well apart.

Quamt - ShowerheadSupport and Resistance levels based off of Volume based off of multiple timeframes and if you want then you may choose another ticker altogether.
When price closes at which ever level, it'll probably go up if support and down if resistance. If it closes below/above each level then continuation is more likely.
The colors flip depending on if above or below each level
To deal with scaling issues with certain levels, choose how close each level must be to price with the "Percentage Threshold," input.

[ST] S/R density study v3This algorithm draws supports/resistance levels automatically based on historic candle density at each height. The basic idea is the levels where price is rejected quickly is likely to have fewer candles in the past than the levels above and below. This does not take volume into account. The lookback and number of levels has to be kept low to prevent too many calculations. I haven't looked if there's new pinescript features to let me do this more efficiently yet.
It checks for candle density to decrease once or twice and then increase once or twice before it draws a line at that lowest level. There's an option to draw more lines by only checking for a single decrease and increase.
It likely won't catch all the levels but it seems to get a good amount to help me position stops on other side of S/R or exits on the trade side of S/R.
I've been meaning to share more scripts but keep forgetting. Keeping my scripts free but feel free to like or tip haha.

Reditum ScanReditum Scan allows you to synchronize the Market Profile Points of Control (POC) in different time intervals to a single graph.
Components of Reditum Scan:
POC's (30 min, 60 min, 120 min, 240 min, daily)
How does it work?
The algorithm allows you to identify areas of strong support and resistance, based on where most of the trading activity takes place.
What are the strategies for considering placing a trade?
1.Cluster (agglomeration of multiple POC's) to cluster (by identifying two clusters, the price could go smoothly from one Cluster to the other).
2. From cluster (agglomeration of multiple POCs, each with unique color. Now, from this cluster important movements may begin).
3. Towards a cluster (like the “from cluster” pattern, we identify areas of high interest for institutional companies, in this pattern the cluster acts like a magnet, if price is near it may be fully attracted towards the agglomeration).
If you are a member of the mastermind tribe please contact the support team within the tribe to access the indicator (do not leave personal or subscription data in the comments on this page), if not, please visit the link located in our signature.
Thanks for taking a look!
----------------------------------------------------------------------------------------------------------------------------------------------------------------------------------------------------------------------------------
Reditum Scan permite sincronizar los puntos de control (POC) de los perfiles de mercado en varios intervalos de tiempo en una sola gráfica.
Componentes de Reditum Scan:
POC´s (30 min, 60 min, 120 min, 240 min, diario)
¿Cómo funciona?
El algoritmo le permite identificar áreas de fuerte soporte y resistencia, según el lugar donde se lleva a cabo la mayor parte de la actividad comercial.
¿Cuáles son las estrategias para considerar una entrada?
1.Cluster (aglomeración de múltiples POC´s) a cluster (al identificar dos cluster el precio podría ir con fluidez desde uno al otro que lo recibe).
2.Desde cluster (lo identificamos con la aglomeración de múltiples POC identificados con colores que hacen fácil la lectura. Ahora, desde este cluster podrían iniciar movimientos importantes).
3.Hacia cluster (al igual que el patrón “desde cluster” identificamos zonas de alto interés para los institucionales, en este patrón el cluster actúa como un imán para el precio, de modo que cuando el precio está lejos de él, lo podría atraer con fuerza).
Para acceder a la herramienta, si usted es miembro de la tribu mastermind por favor comunicarse con el equipo de soporte dentro de la tribu (no dejar datos personales ni de suscripción en los comentarios de esta página), si no es miembro por favor visite el enlace a continuación en nuestra Firma.
Gracias por echarle un vistazo!.

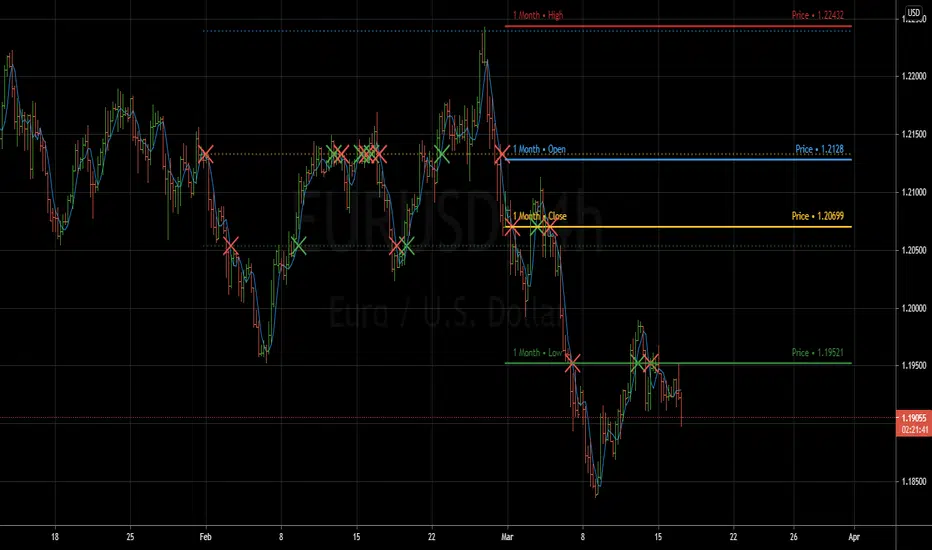
Key Levels TheHuntThis indicator is made to show you some key levels on the chart on the different timeframes. You can hide them or show them in the settings. The levels are the Monthly Weekly and Daily opens, current monthly, weekly and daily high / low, last weeks high / low & last daily high / low as well as Monday high and low. These levels can be used as key pivots or key liquidity areas. You can also adjust the time to also use the correct Mon range for forex pairs.
As you can see on the chart, that is how the levels show up on the chart.

Opening LevelsOpening Levels is an indicator to draw lines on the opening prices of the current day, week, and month.
Inputs:
1. Line Width :- Opening Levels Line width, from 1 to 10
2. Right Offset :- Right offset from current bar, from 0 to 50
3. Line Style :- Select line styles from
4. Show Label :- Show or hide price labels
5. Day Level Color :- Current day opening level color
6. Week Level Color :- Current week opening level color
7. Month Level Color :- Current month opening level color
8. Day Label Text Color :- Current day label text color
9. Week Label Text Color :- Current Week label text color
10. Month Label Text Color :- Current month label text color
Happy trading.
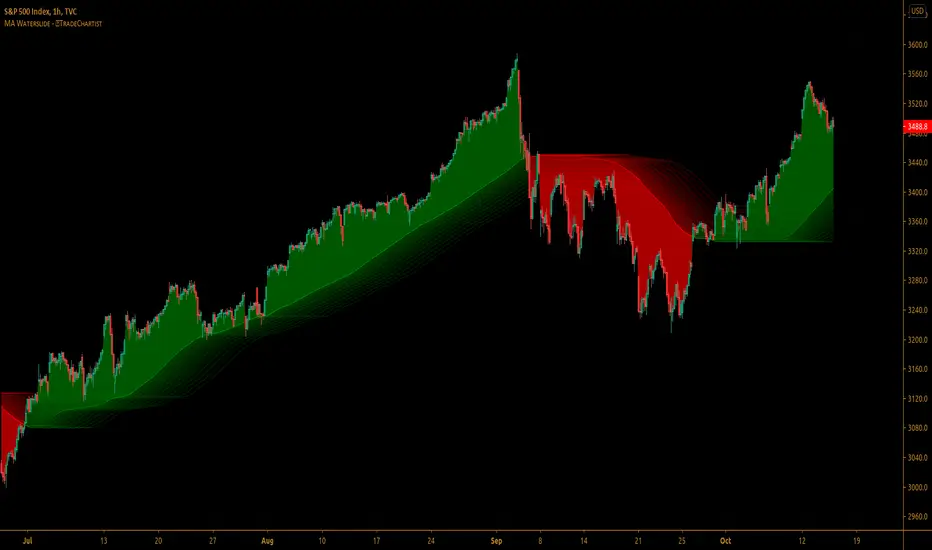
TradeChartist MA Waterslide™TradeChartist MA Waterslide is a beautiful visual indicator that uses an original method to plot a trend based waterslide on price action, based on one of the 15 types of moving averages of the source price. The Waterslide helps identify the trend and also helps spot key Support and Resistance levels visually from the confluence of Waterslide levels.
===================================================================================================================
Key features included in the settings
MA Waterslide - Displays Waterslide based on one of the 15 MA types - disabling this option removes the fill and shows just the Waterslide levels.
Waterslide MA Type - User can choose one of 15 different types of Moving Averages.
Waterslide MA Length - User can input the required MA length for the Waterslide.
Offset - Offset upto the value of 5 can be used to visually see the levels better by projecting them into the future by the Offset value.
Waterslide Width - Width of the Waterslide. Default width is 3 and Minimum is 1. It can be changed to suit the risk based support and resistance spotting.
Display MA - Displays the True MA Plot
===================================================================================================================
Example charts
1. BTC Multi Window showing different Themes and MA types.
2. GBPUSD 15m chart using 200 period Hull MA with Offset 5 and Width 5 along with True MA plot.
3. XAUUSD 1 hr chart using 200 period TEMA with Offset 5 and Width 5 of BaseLine (Kijun Sen) of Ichimoku Cloud as Price Source.
4. SPX 1 hr chart using 100 SMA and Width 5 with just the MA Waterslide Levels.
===================================================================================================================
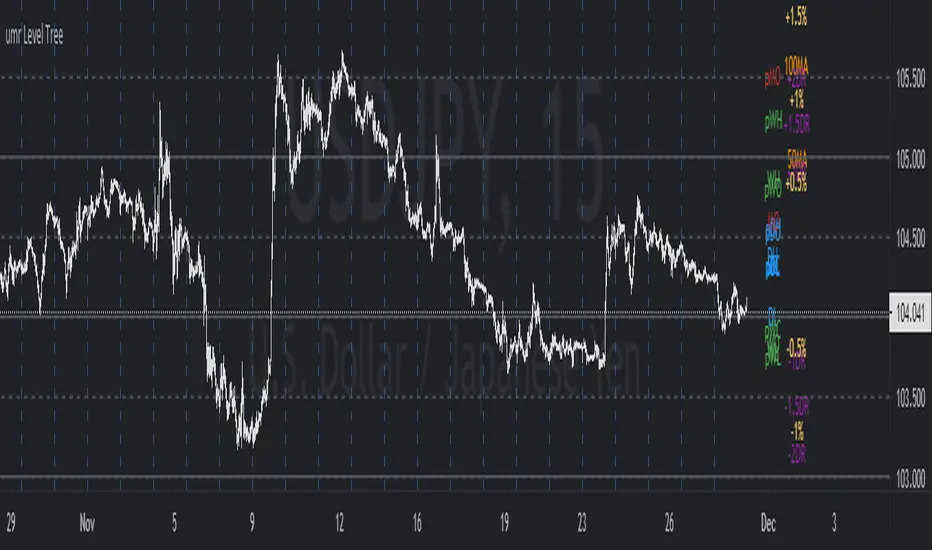
umr Level TreeShows following levels and labels (which can be individually controlled):
OHLC levels of Today, Yesterday, This week, Last week, This Month, Last Month
Daily Simple Moving Averages (50, 100, 200)
Horizontal Grid on 50, 100 pips for FX instruments.
(to do) Add ATR or Std Deviation
(to do) Add Daily Change levels % i.e. 0.5%, 1%, 2%
(to do) Add Daily change in pips levels (for fx) i.e. 50 pips, 100 pips etc
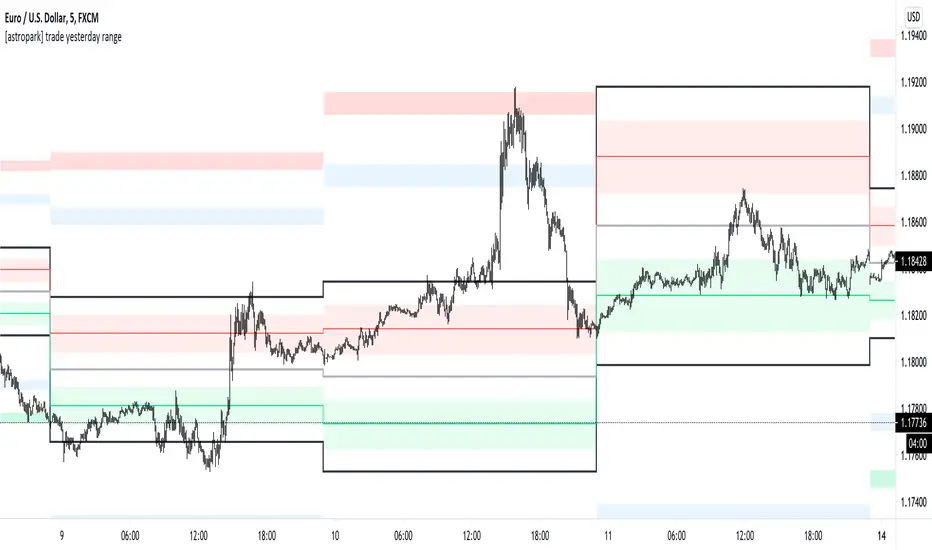
[astropark] trade yesterday rangeDear followers,
today a nice scalping tool for day trading on low time frames (1-3-5 minutes)!
Each day the indicator will print some important levels and ranges related to the trading day before:
yesterday high (black line)
yesterday day range averange (silver line)
yesterday low (black line)
average between yesterday high and yesterday average, together with a resistance range (red)
average between yesterday low and yesterday average, together with a support range (green)
two extension ranges above yesterday high (first is blue, second is red)
two extension ranges below yesterday low (first is blue, second is green)
Trading levels is one of most effective trading tecniques:
once a level is broken upwards, you can long (buy) the bullish retest with stoploss below recent low
once a level is broken downwards, you can short (sell) the bearish retest with stoploss below recent high
consolidation below or at a resistance level is bullish, so long (buy) breakout upwards and long more on a bullish retest of broken level
consolidation above or at a support level is bearish, so short (sell) breakout downwards and short more on a bearish retest of broken level
many times you see a level to be tested 2 or 3 times: short (sell) double and triple top, long (buy) double or triple bottom
Here you can see the levels described above and basic usage in a consolidation trading day:
A trader who wants to be a winner must understand that money and risk management are very important, so manage your position size and always have a stop loss in your trades.
Here you can see many examples on how to use this indicator.
Triple top on yesterday range high: perfect short setup (5 take profits targets in the example)
Resistance levels broken: long setup on bullish retest (2 take profits targets in the example)
Double top and support broken: 2 short setups (2 and 3 take profits targets in the example)
Here some examples how to basically use the indicator in a consolidation trading day: short (sell) resistance levels, long (buy) support levels
This is a premium indicator , so send me a private message in order to get access to this script.
BB Indicator - Marks High and low of premarket,daily,yesterdayThis indicator marks what is known as the BB system - Marks on your chart the premarket high and low, current intraday high and low and yesterday's high and low. For the style of the line you can only change the colour, if you make the line a different style it shouldn't show up because if it did it makes the lines ugly.
Pick and select which levels you would like using the indicator and you can also turn on and off the labels if you don't want them.

Support and Resistance Levels with Breaks [LuxAlgo]This script provides basic pivot point Support and Resistance Levels to the user whilst displaying Break signal tags. It also has the ability to let the user display more significant breaks by filtering using the Volume Oscillator.
Only more significant breaks of these basic levels are displayed to the user when optimized which avoids noise and messy signals.
It will also display breaks with candles it deems to be bullish (e.g. having a longer upper or lower wick).
Notation
The notation of "B" denotes a break of either a Support or Resistance level with a volume greater than the threshold.
The notation of "Bull or Bear Wick" denotes a bullish or bearish candle on the break.
Settings:
Left Bars - the number of bars left hand side of the pivot.
Right Bars - the number of bars right hand side of the pivot.
Volume Threshold - the threshold value (%) for the Volume Oscillator.
Usage & Details:
Knowing when a pivot S/R level is broken with significance can be of great help to a trader. Many times significant levels may not be broken with significant force and the move is therefore weaker and possibly not worth trading.

Love.Gunfire - Giant All For One 巨人VIPGiant is All For One , the Last special version for all markets, optimized by Love.Gunfire from Gann. Each one contains natural numbers. If you want to know the recent support. resistance and trends, read on.
Only disciples who have learned "Giant Weapons" can select VIPs to use and the version will be continuously updated.
There the usage settings:
Enable/Disable signals on chart
Enable/Disable XTV based on trend
Enable/Disable label code to smart trade
How does it work?
Basic usage
After the small/medium giant appears BUY, and above T line, may be you can consider the operation of buying
After the small/medium giant appears SELL, and below T line, may be you can consider the operation of selling
What are the signals?
Advanced usage
The small/medium giant cooperates with the giant weapon operation to confirm the upward trend and consider buying
The small/medium giant cooperates with the giant weapon operation to confirm the downward trend and consider selling
For giants to operate, no matter how to make any transaction, they must have the mind of "continuing to stop making profits is the emperor's way, and strictly guarding against erosion is a virtue."
Want to get this indicator today!
For access, please DM us or visit the link/Telegram below in our Signature.
Contact: Love.Gunfire
US30 CURRENCYCOM:US30
GOLD OANDA:XAUUSD
HKEX:700
FX:EURUSD
BINANCE:BTCUSDT
--------------------------------------------------------------------------------------------
巨人是結合天地為一。特別的版本可以應用全球商品,是由彥暉從江恩中使用八多年來優化而來,每一個都含有自然的數字,如果想知道近來的支持、阻力和趨勢,一定不可錯過。
更新設定方法 :
開啟/關閉 訊號
開啟/關閉 XTV趨勢
開啟/關閉 數字
如何使用?
基本使用方法 :
待小/中巨人出現BUY後配合T線以上 ,可考慮買入的操作動作。
待小/中巨人出現SELL後配合T線以下,可考慮沽空的操作動作。
訊號是什麼?
進階使用方法 :
小/中巨人配合巨人兵器操作,確認向上的趨勢可考慮買入。
小/中巨人配合巨人兵器操作,確認向下的趨勢可考慮沽空。
暫時只開放給「巨人兵器」的弟子和特選VIP使用,版本會持續更新。
巨人操作,無論做任何交易,必須要有「不斷止賺是皇道,嚴守止蝕是美德。」的心思。
立刻行動,良機勿失 !
想獲取權限,請給本族訊息或訪問Telegram,本族簽名中的以下鏈接。
請聯絡 : Love.Gunfire
US30 CURRENCYCOM:US30
GOLD OANDA:XAUUSD
HKEX:700
FX:EURUSD
BINANCE:BTCUSDT

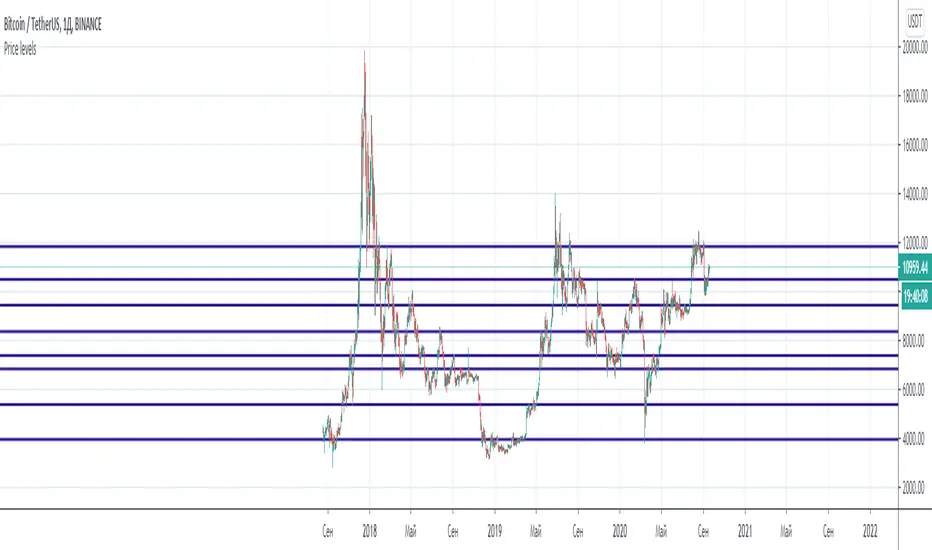
Price levelsThanks to the developers for adding arrays to TradingView. This gives you more freedom in Pine Script coding.
I have created an algorithm that draws support and resistance levels on a chart. The algorithm can be easily customized as you need.
This algorithm can help both intuitive and system traders. Intuitive traders just look at the drawn lines. For system traders, the "levels" array stores all level values. Thus, you can use these values for algorithmic trading.