Candle Combo ScreenerThe Candle Combo Screener allows you to see candlestick combinations for up to 5 different tickers at the same time . If one of the candle combination is detected the corresponding cell will be highlighted to alert you.
Candle Combinations Detected
Bullish Kicker
Bullish & Bearish Oops Reversals
Open Equals High / Low
Inside Day
Select any 5 tickers. Colors and table settings are fully customizable to fit your style.
Bullish Kicker
The opening price of the current candle gaps up above the body of the prior day's candle AND the prior day's candle close was less than the open.
Oops Reversals
Bullish: Price opens below the prior day’s low and closes above.
Bearish: Price opens above the prior day's high and closes below.
Open Equals High / Low
The current candles opening price is equal to either the high or low of the day.
Inside Day
The current candles high and low are contained within the prior day's high and low.
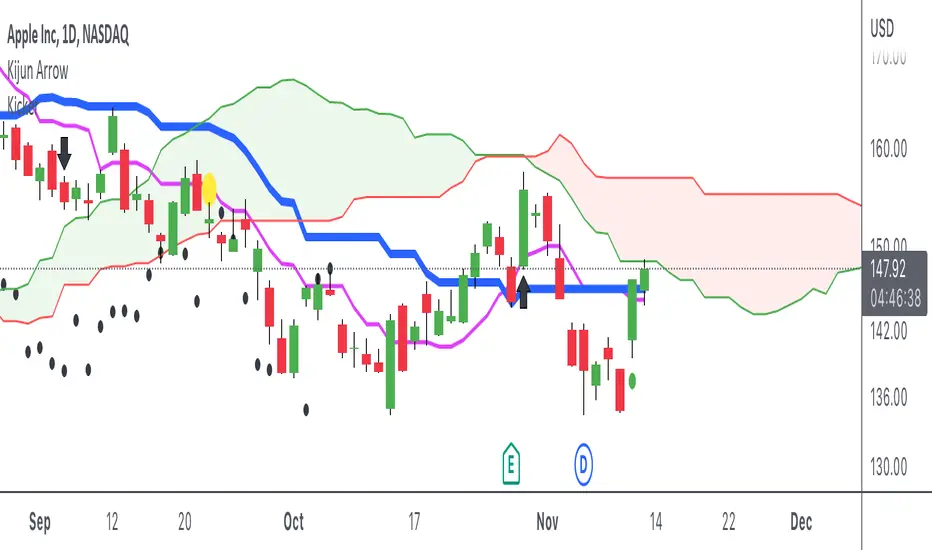
Kicker

Candlestick - Kicker PatternNot many candlestick patterns hurt traders on the other side of the trade more than this signal, when it happens, think of it as kicking in the teeth, the pain is real.
An upwards signal is painted when you have a two-bar formation, the one on the left is a bearish one whereas the successive one is bullish, when you have fat bodies in both candles, meaning the open is close to the high and the close is close to the low for the first candle, while the open is close to the low and the close is close to the high for the adjacent candle, the pain is ever more excruciating, the other important condition is the open of the first candle must be lower than the open of the latter one.
The downwards signal is vice versa of the upwards signal.
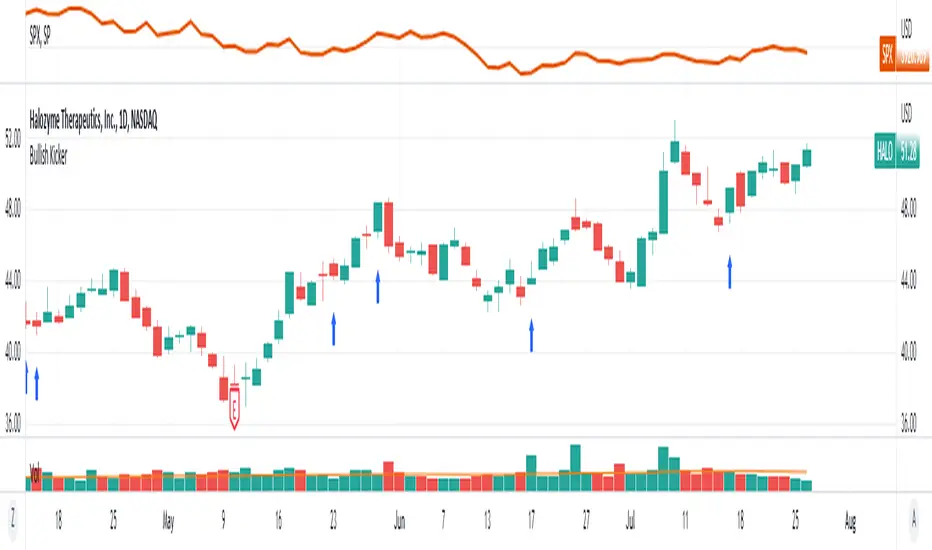
Bullish KickerIdentify bullish kicker candles on the chart. A bullish kicker candle occurs when the opening price is above the body of the previous candle. The previous candle must close lower than the open to qualify.
Indicator Settings
You can chose which shape and color to plot when a kicker candle occurs, as well as placement above, below or in a separate pane.
Bullish Kickers are indicated by blue arrows on the chart
Kicker ScannerThe kicker pattern is deemed to be one of the most reliable reversal patterns and usually signifies a dramatic change in the fundamentals of the company in question.
It is a 2-candle pattern, whereby there is a significant gap between the body of the most recent candle and the previous candle.
A bullish kicker is one in which the most recent candle is bullish, and the previous candle is bearish.
A bearish kicker is one in which the most recent candle is bearish, and the previous candle is bullish.
I notice this works best for stocks, as there are many gaps in a stock chart. Currencies have few gaps, and thus few kickers.
From within the settings, you can set the minimum permitted gap between the two candles, specified in price, accurate to 6 decimal places; 0.000001.
