Kalman Absorption/Distribution Tracker 3-State EKFQuant-Grade Institutional Flow: 3-State EKF Absorption Tracker
SUMMARY
An advanced, open-source implementation of a 3-State Extended Kalman Filter (EKF) designed to track institutional Order Flow. By analyzing 1-second intrabar microstructure data, this script estimates the true Position, Velocity, and Volatility of the Cumulative Volume Delta (CVD), revealing hidden Absorption and Distribution events in real-time.
INTRODUCTION: THE SIGNAL AMIDST THE NOISE
In the world of technical analysis, noise is the enemy. Traditional indicators rely on Moving Averages (SMA, EMA) to smooth out price and volume data. The problem is the "Lag vs. Noise" paradox: to get a smooth signal, you must accept lag; to get a fast signal, you must accept noise.
This indicator solves that paradox by introducing aerospace-grade mathematics to the TradingView community: The 3-State Extended Kalman Filter (EKF).
Unlike moving averages that blindly average past data, a Kalman Filter is a probabilistic state-space model. It constantly predicts where the order flow "should" be, compares it to the actual measurement, and updates its internal model based on the calculated uncertainty of the market.
This script is not just another volume oscillator. It is a full microstructure analysis engine that digests intrabar data (down to 1-second resolution) to track the true intent of "Smart Money" while filtering out the noise of retail chop.
THE INNOVATION: WHY 3 STATES?
Most Kalman Filters found in public libraries are "1-State" (tracking price only) or occasionally "2-State" (tracking price and velocity). This script introduces a highly advanced 3-State EKF.
The filter tracks three distinct variables simultaneously in a feedback loop:
State 1: Position (The True CVD)
This is the noise-filtered estimate of the Cumulative Volume Delta. It represents the actual inventory accumulation of aggressive buyers versus sellers, stripped of random noise.
State 2: Velocity (The Momentum)
This tracks the rate of change of the order flow. Is buying accelerating? Is selling pressure fading even as price drops? This provides a leading signal before the cumulative value even turns.
State 3: Volatility (The Adaptive Regime)
This is the game-changer. The filter estimates the current volatility of the order flow (Log-Volatility). In high-volatility environments (like news events), the filter automatically widens its uncertainty bands (Covariance) and reacts faster. In low-volatility environments (chop), it tightens up and ignores minor fluctuations.
THE LOGIC: DETECTING ABSORPTION AND DISTRIBUTION
The core philosophy of this indicator is based on Wyckoff Logic: Effort vs. Result.
-- Effort: Represented by the CVD (Buying/Selling pressure).
-- Result: Represented by Price Movement.
When these two diverge, we have an actionable signal. The script uses the EKF Velocity state to detect these moments:
Absorption (Bullish)
This occurs when the EKF detects high negative Velocity (aggressive selling), but Price refuses to drop. The "Smart Money" is absorbing the sell orders via limit buys. The indicator highlights this as a Blue Event in the dashboard.
Distribution (Bearish)
This occurs when the EKF detects high positive Velocity (aggressive buying), but Price refuses to rise. Limit sellers are capping the market. The indicator highlights this as an Orange Event.
TECHNICAL DEEP DIVE: UNDER THE HOOD
For the developers and quants, here is how the Pine Script is architected using the "type" and "method" features of Pine Script v5.
1. Data Ingestion (Microstructure)
The script uses "request.security_lower_tf" to pull intrabar data regardless of your chart timeframe. This allows the script to see "inside" the bar. A 5-minute candle might look green, but the microstructure might reveal that 80% of the volume was selling absorption at the wick. This script sees that.
2. Tick Classification
Standard CVD assumes that if Price Close is greater than Price Open, all volume is buying. This is often flawed. This script offers three modes of tick handling, including a "High-Low Distribution" method that statistically apportions volume based on where the tick closed relative to its high and low.
3. The EKF Mathematics
The script implements the standard Extended Kalman Filter equations manually. It calculates the Jacobian matrix to handle the non-linear relationship between volatility and price. The "Process Noise Matrix" (Q) is dynamically scaled by the Volatility State. This means the mathematics of the indicator literally "breathe" with the market conditions—expanding during expansion and contracting during consolidation.
THE DASHBOARD & VISUALS:
The indicator features a professional-grade HUD (Heads Up Display) located on the chart table.
-- EKF State Vector: Displays the real-time Position, Velocity, and Volatility values derived from the matrix.
-- Ease of Movement (Wyckoff): Calculates how much price moves per 1,000 contracts of CVD. For example, if Price moves +5 points per 1k Buy CVD, but only -2 points per 1k Sell CVD, the "Path of Least Resistance" is clearly UP.
-- Session State: Tracks cumulative confirmed Bullish vs. Bearish events for Today, Yesterday, and the Day Before (3-Day Profile).
-- Bias Summary: An algorithmic conclusion telling you if the day is "Confirmed Bullish," "Accumulating," or "Neutral."
HOW TO TRADE THIS INDICATOR
Strategy A: The Reversal (Absorption Play)
Look for price making a Lower Low.
Look for the EKF Velocity (Histogram) to be Deep Red (High Selling Pressure).
Watch the Dashboard "Absorption" count increase.
SIGNAL: When EKF Velocity crosses back toward zero and turns grey/green, the absorption is complete. This indicates sellers are exhausted and limit buyers have control.
Strategy B: The Trend Continuation (Ease of Movement)
Check the Dashboard "Ease of Movement" section.
If "Price per +1K CVD" is significantly higher than "Price per -1K CVD", buyers are efficient.
Wait for a pullback where EKF Velocity hits the "Neutral Zone" (Gray).
SIGNAL: Enter Long when Velocity ticks positive again, aligning with the dominant Ease of Movement stats.
CONFIGURATION GUIDE:
Because this is a quant-grade tool, the settings allow for fine-tuning the physics of the filter.
-- Velocity Decay: Controls how fast momentum resets to zero. Set high (0.98) for trending markets, or lower (0.85) for mean-reverting chop.
-- Volatility Persistence: Controls how "sticky" volatility regimes are.
-- Process Noise: Increase this if the filter feels too laggy; decrease it if the filter feels too jittery (noisy).
-- Measurement Noise: Increase this to trust the Mathematical Model more than the Price Data (smoother output).
WHY OPEN SOURCE?
Complex statistical filtering is often sold behind closed doors in expensive "Black Box" algorithms. By releasing this 3-State EKF open source, the goal is to raise the standard of development on TradingView.
I encourage the community to inspect the code, specifically the "ekf_update_3state" function, to understand how matrix operations can be simulated in Pine Script to create adaptive, self-correcting indicators. And also update me for improvements.
DISCLAIMER:
This tool analyzes microstructure volume data. It requires a subscription plan that supports Intrabar inspection (Premium/Pro recommended for best results). Past performance of the Kalman Filter logic does not guarantee future results. Volume analysis is subjective and should be used as part of a comprehensive strategy.
SUGGESTED SETTINGS
-- Timeframe: Works best on 1m, 3m, or 5m charts (Intrabar data is fetched from 1S).
-- Asset Class: Highly effective on Futures (ES, NQ, BTC) and high-volume Forex/Crypto pairs where volume data is reliable.
-- Background: Dark mode recommended for Dashboard visibility.
WHAT IS A KALMAN FILTER?
Imagine driving a car into a tunnel where your GPS signal is lost.
Prediction: Your car knows its last speed (Velocity) and position. It predicts where you are every second inside the tunnel.
Update: When you exit the tunnel, the GPS connects again. The system compares where it thought you were versus where the satellite says you are.
Correction: It corrects your position and updates its estimate of your speed.
Now apply this to trading:
-- The Tunnel: Market Noise, wicks, and Fake-outs.
-- The Car: The True Market Trend.
-- This Indicator: The navigation system that tells you where the market actually is, ignoring the noise of the tunnel.
Enjoy the indicator and trade safe!
Dr. Jay Desai
(Investment Management & Derivatives Area, Gujarat University)
Kalman-filter

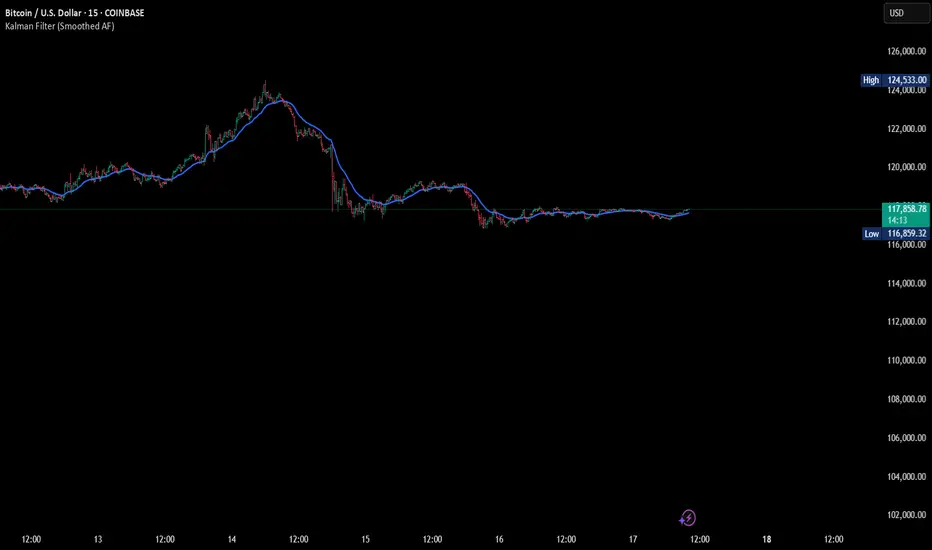
Kalman Filter (Smoothed)The Kalman Filter is a recursive statistical algorithm that smooths noisy price data while adapting dynamically to new information. Unlike simple moving averages or EMAs, it minimizes lag by balancing measurement noise (R) and process noise (Q), giving traders a clean, adaptive estimate of true price action.
🔹 Core Features
Real-time recursive estimation
Adjustable noise parameters (R = sensitivity to price, Q = smoothness vs. responsiveness)
Reduces market noise without heavy lag
Overlay on chart for direct comparison with raw price
🔹 Trading Applications
Smoother trend visualization compared to traditional MAs
Spotting true direction during volatile/sideways markets
Filtering out market “whipsaws” for cleaner signals
Building blocks for advanced quant/trading models
⚠️ Note: The Kalman Filter is a state-space model; it doesn’t predict future price, but smooths past and present data into a more reliable signal.
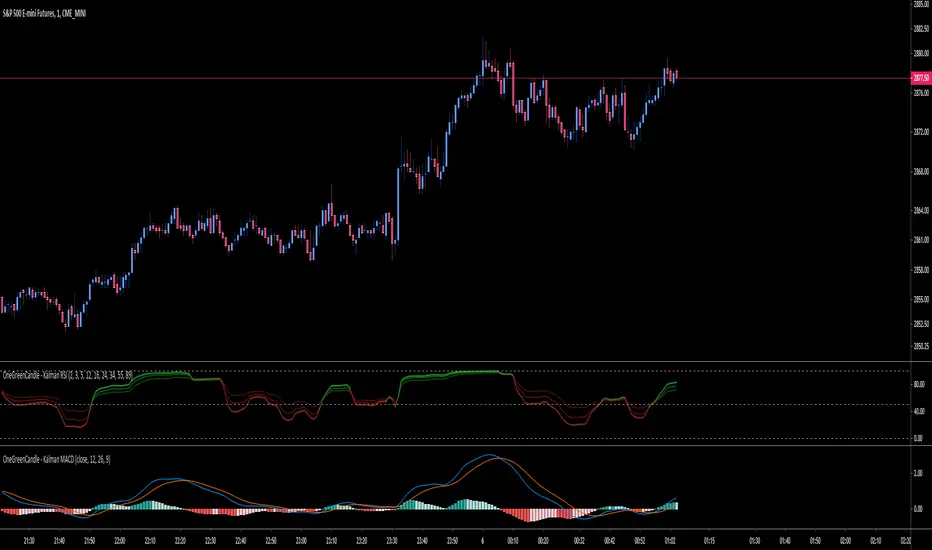
Kalman Volume Filter [ChartPrime]The "Kalman Volume Filter" , aims to provide insights into market volume dynamics by filtering out noise and identifying potential overbought or oversold conditions. Let's break down its components and functionality:
Settings:
Users can adjust various parameters to customize the indicator according to their preferences:
Volume Length: Defines the length of the volume period used in calculations.
Stabilization Coefficient (k): Determines the level of noise reduction in the signals.
Signal Line Length: Sets the length of the signal line used for identifying trends.
Overbought & Oversold Zone Level: Specifies the threshold levels for identifying overbought and oversold conditions.
Source: Allows users to select the price source for volume calculations.
Volume Zone Oscillator (VZO):
Calculates a volume-based oscillator indicating the direction and intensity of volume movements.
Utilizes a volume direction measurement over a specified period to compute the oscillator value.
Normalizes the oscillator value to improve comparability across different securities or timeframes.
// VOLUME ZONE OSCILLATOR
VZO(get_src, length) =>
Volume_Direction = get_src > get_src ? volume : -volume
VZO_volume = ta.hma(Volume_Direction, length)
Total_volume = ta.hma(volume, length)
VZO = VZO_volume / (Total_volume)
VZO := (VZO - 0) / ta.stdev(VZO, 200)
VZO
Kalman Filter:
Applies a Kalman filter to smooth out the VZO values and reduce noise.
Utilizes a stabilization coefficient (k) to control the degree of smoothing.
Generates a filtered output representing the underlying volume trend.
// KALMAN FILTER
series float M_n = 0.0 // - the resulting value of the current calculation
series float A_n = VZO // - the initial value of the current measurement
series float M_n_1 = nz(M_n ) // - the resulting value of the previous calculation
float k = input.float(0.06) // - stabilization coefficient
// Kalman Filter Formula
kalm(k)=>
k * A_n + (1 - k) * M_n_1
Volume Visualization:
Displays the volume histogram, with color intensity indicating the strength of volume movements.
Adjusts bar colors based on volume bursts to highlight significant changes in volume.
Overbought and Oversold Zones:
Marks overbought and oversold levels on the chart to assist in identifying potential reversal points.
Plotting:
Plots the Kalman Volume Filter line and a signal line for visual analysis.
Utilizes different colors and fills to distinguish between rising and falling trends.
Highlights specific events such as local buy or sell signals, as well as overbought or oversold conditions.
This indicator provides traders with a comprehensive view of volume dynamics, trend direction, and potential market turning points, aiding in informed decision-making during trading activities.

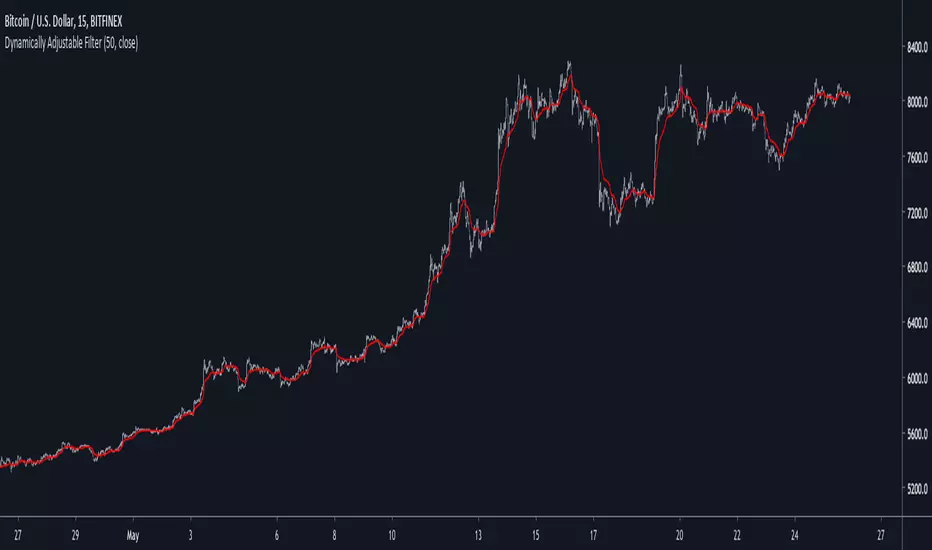
Dynamically Adjustable FilterIntroduction
Inspired from the Kalman filter this indicator aim to provide a good result in term of smoothness and reactivity while letting the user the option to increase/decrease smoothing.
Optimality And Dynamical Adjustment
This indicator is constructed in the same manner as many adaptive moving averages by using exponential averaging with a smoothing variable, this is described by :
x= x_1 + a(y - x_1)
where y is the input price (measurements) and a is the smoothing variable, with Kalman filters a is often replaced by K or Kalman Gain , this Gain is what adjust the estimate to the measurements. In the indicator K is calculated as follow :
K = Absolute Error of the estimate/(Absolute Error of the estimate + Measurements Dispersion * length)
The error of the estimate is just the absolute difference between the measurements and the estimate, the dispersion is the measurements standard deviation and length is a parameter controlling smoothness. K adjust to price volatility and try to provide a good estimate no matter the size of length . In order to increase reactivity the price input (measurements) has been summed with the estimate error.
Now this indicator use a fraction of what a Kalman filter use for its entire calculation, therefore the covariance update has been discarded as well as the extrapolation part.
About parameters length control the filter smoothness, the lag reduction option create more reactive results.
Conclusion
You can create smoothing variables for any adaptive indicator by using the : a/(a+b) form since this operation always return values between 0 and 1 as long as a and b are positive. Hope it help !
Thanks for reading !
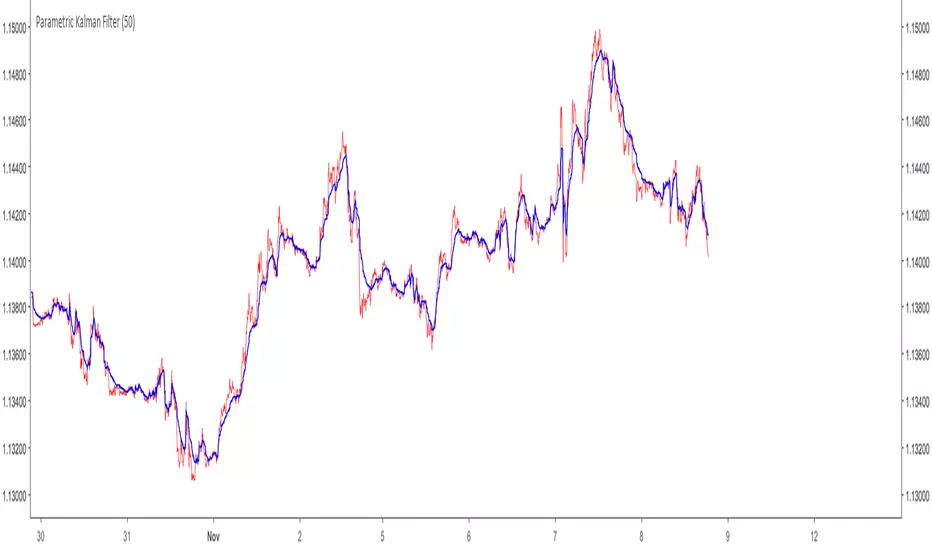
One Dimensional Parametric Kalman FilterA One Dimensional Kalman Filter, the particularity of Kalman Filtering is the constant recalculation of the Error between the measurements and the estimate.This version is modified to allow more/less filtering using an alternative calculation of the error measurement.
Camparison of the Kalman filter Red with a moving average Black of both period 50
Can be used as source for others indicators such as stochastic/rsi/moving averages...etc
For any questions/suggestions feel free to contact me