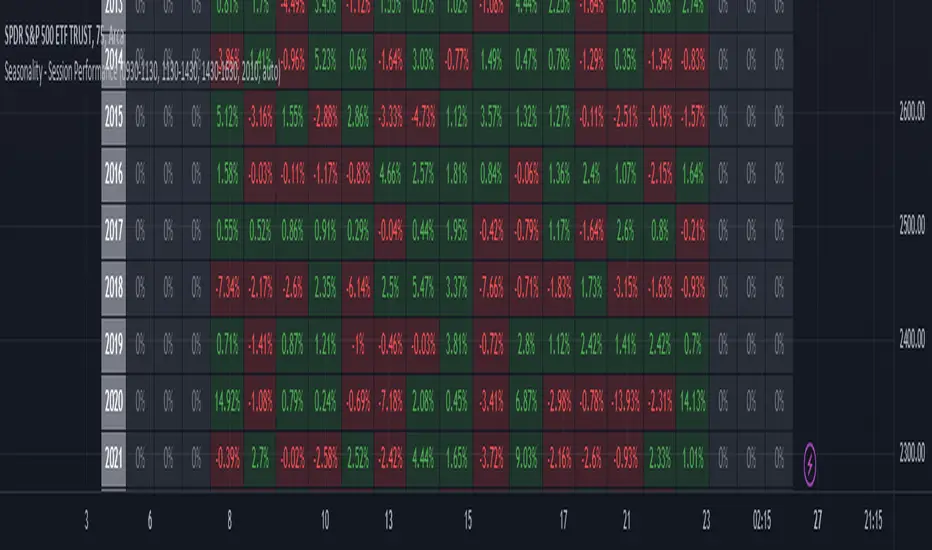
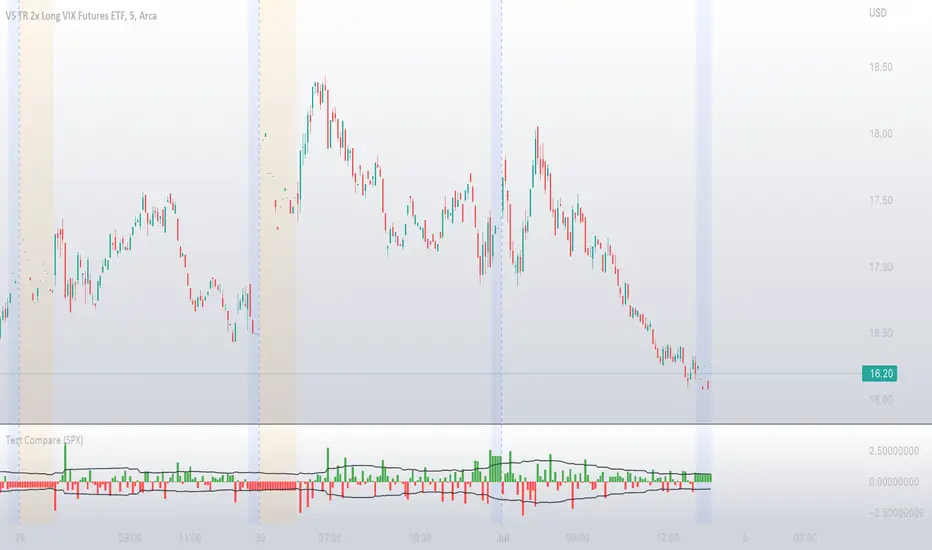
Seasonality - Session Performance - Morning Afternoon EveningUse this indicator on Intraday Timeframe. Higher the timeframe, more the data
This script calculates the performance of an instrument for different sessions.
Session inputs can be updated to study performance of
- Morning vs Afternoon vs Evening
- Pre-Market vs Market vs Post-Market (provided the data feed supports pre and post market)
- Overnight vs Intraday
Three session inputs are provided to tweak the session range
Performance is calculated as session close / session open - 1
Session timeframes can be set for various countries. Make sure the session timeframe aligns with the Candle open/close for the timeframe you choose. Some examples below
US Markets: 0930-1130 1130-1430 1430-1630 Timeframe 1 hour
India Markets: 0915-1030 1030-1415 1415-15:30 Timeframe 75min
J-SPX
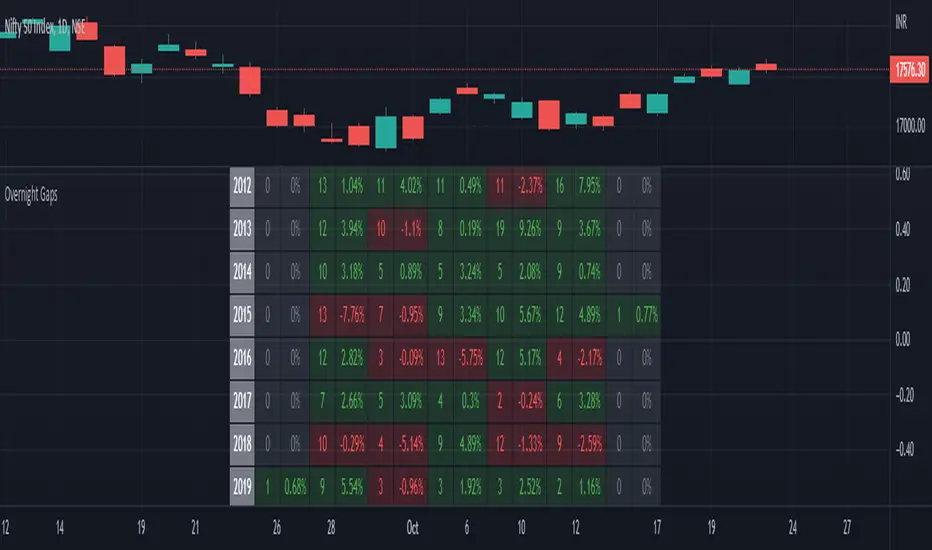
Seasonality Overnight Gaps - Tabular Form Use this indicator on Daily Timeframe
This script calculates the overnight gaps above a specific threshold (that can be set through input parameters) and displays the data in a tabular form with Year in the rows and the day of the week in the columns.
Also a summary row is displayed at the bottom for day of the week.
Detailed Gap info is displayed as tooltip for the cell data
Gap - Open should be outside the previous day's Open and Close
Gap % - open/prev. close - 1 if Gap is there
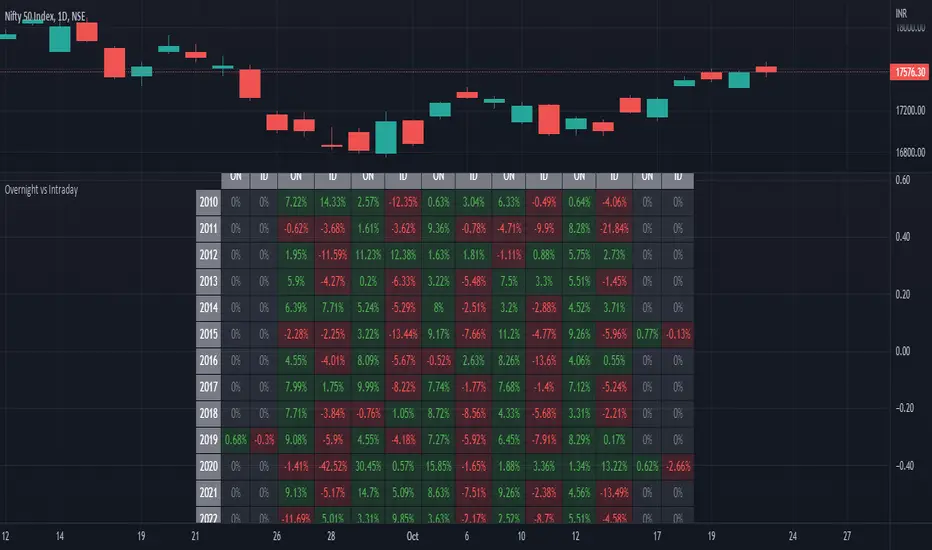
ILM Overnight vs Intraday Performance - Tabular FormUse this indicator on Daily Timeframe
This script compares Overnight vs Intraday Performance based on the Day of the Week (DOW) - Sun - Sat of index/stock/currency/commodity symbols.
ON column indicates Overnight performance = open/close -1
ID column indicates Intraday performance = close-open/1
The calculations are detailed in the tooltips of the individual table cells.
Seasonality DOW - Day Of the Week - Tabular FormUse this indicator on Daily Timeframe
This indicator displays the seasonality data for any instrument (index/stock/ futures /currency) in a tabular data by day of the week - DOW ( Sun - Mon - Tue - Wed - Thu - Fri - Sat ).
User can change the start of the year for analysis from the inputs.
Year is represented in rows and Day of the week (DOW) is represented in cols.
This indicator uses Daily Data feed to calculate the % change
Summary data for DOW displayed as the last row

MINI SPXThis is the XSP version of SPX, basically it's just the price of SPX divided by 10 and shown using labels.
Should only be used on SPX to watch the price of XSP since XSP doesn't have real-time data ATM.
Can be used on any time frames.
This script allows you to view the Daily (O, H, L, C) and Yesterday's (O, H, L, C) with a non intrusive price line.
Allows for extra customization of the price lines and labels.

NYSE Market Sentiment Oscillator - Intraday w/ alertsThe ULTIMATE market sentiment indicator that combines the sentiments from the MARKET INTERNALS : $ADD ( NYSE $ADV minus $DECL ), $VOLD ( NYSE $UVOL minus $DVOL ) and $TICK ( NYSE Cumulative tick ). Sentiment is based on calculating the crossovers of moving average pairs for each of the market internals. As a result, 3 corresponding signal lines are generated + 1 combined Market Sentiment Oscillator (aka MSO) signal line.
**Important** This indicator is only meant to be used for intraday 1min-5 min timeframe only *** It may not function at higher timeframes without updating some moving average periods.
WHAT IS IT SHOWING?
Each signal lines represents the trend of the 3 market internals (TICK, ADD, VOLD). If signal line is above zero, it is in a bullish trend; below zero, bearish. The oscillating frequency of these lines are dependent on the length of moving average pairs of your choosing. A combined MSO signal line shows the combined trends of those 3 market internals, hence it represents real time market sentiment of the NYSE.
FEATURES
There are 2 display modes for this indicator:
1) On a separate pane
- in this mode, the signal lines can be toggled to oscillate along the zero line
2) On the price chart
- in this mode, the signal lines can be toggled to oscillate along the OHLC line of the price chart
- comes with Nadaraya-Watson Envelope and ATR bands
BUY/SELL SIGNALS AND STRATEGIES
By default, this indicator comes with two day trading strategies and offers long and short signals with alerts. These strategies attempts to leverage on the oscillating nature of market price movement on major NYSE indices, such as SPY, SPX, QQQ, NAS, all of which have high correlation with the market internals. However, please note that these signals offers no guarantee to profitability, so use at your own risk.
BACKGROUND COLORS SIGNIFYING TRENDS
There are options to display the background colors in 2 colors and shades.
1) Short-term sentiment
- Bright green = ADD / VOLD / TICK all in up trend
- Dimmed green = ADD / VOLD in up trend, but not TICK
- Bright red = ADD / VOLD / TICK all in down trend
- Dimmed red = ADD / VOLD in down trend, but not TICK
2) Trend Convergence
- Green = ADD / VOLD / TICK all bullish
- Red = ADD / VOLD / TICK all bearish
3) MSO
- Green = MSO bullish ( MSO signal line > 0 )
- Red = MSO bearish ( MSO signal line < 0 )
MARKET INTERNALS REAL-TIME DATA TABLE
A data table can be toggled on / off that shows the real-time sentiment and values of the three market internals. It may be useful in making quick trading decisions. The table cells are colored according to their corresponding trends.

Dealar VIX Implied Range + Retracement LevelsThis Implied range Is derived by the VIX(1 sd annual +/- Implied move.)
This Indicator plots the daily Implied range, A lot of quantitative trading firms/ MM firms hedge their delta & gamma exposure around the Implied range(prop calc). I have added retracement levels as well, so you have more pivot levels.
Enjoy!

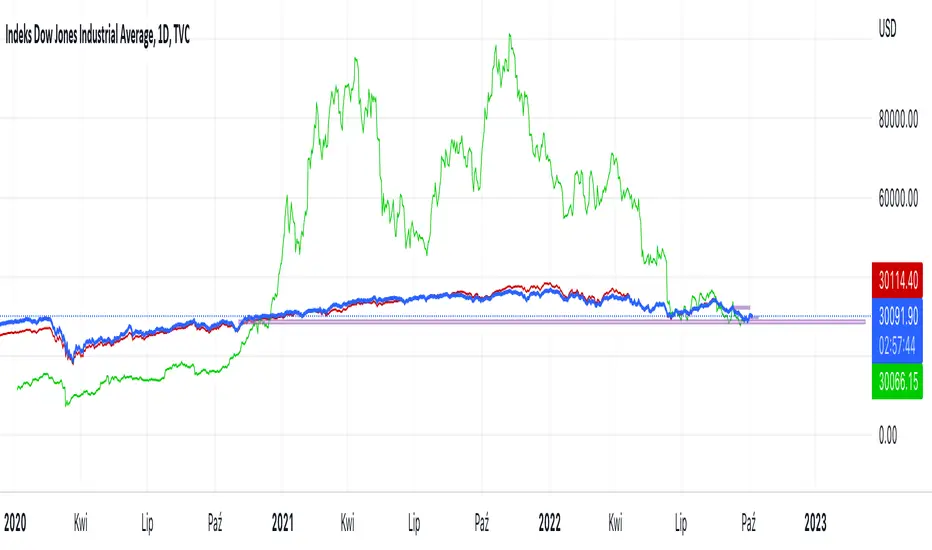
Hussarya compare DJI SPX BTCScript shows relations between DJI downJones SPX and BTC:USD.
DJI chart must be set from candlestick to line
Red line is price (close). x 8
Green line ist te price BTCUSD from Binance price (close) x 1.5
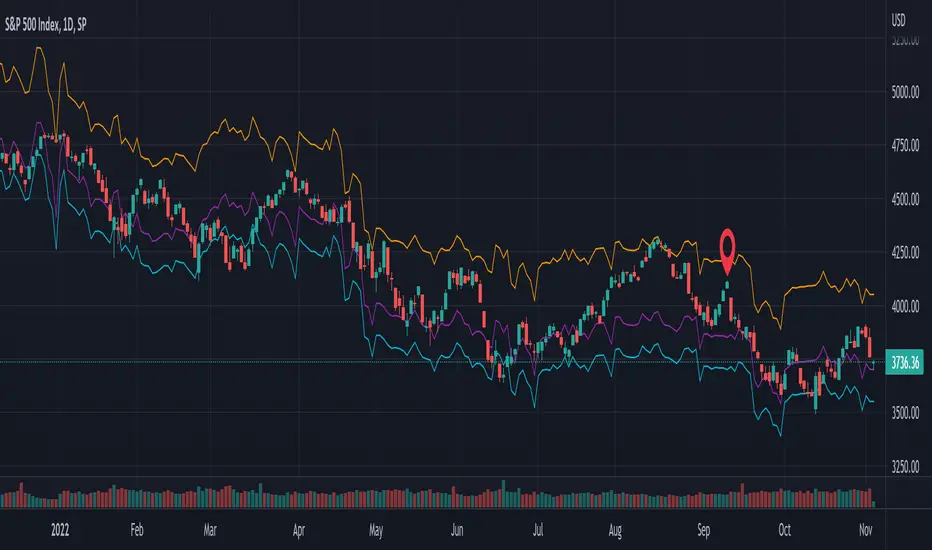
SPX Fair Value BandsThese are based on Darius Dale and Max Anderson's Net Liquidity model.
This is intended for use with the $SPX chart.
Compare ticker against SPX - yoyo This script is built on a request of one of the best trader yoyo. The script compares the performance of a tickers against SPX.
The script gives user option to override default SPX ticker to a ticker of their choice using settings.
The script does a % change comparison against base stock which is SPX by default for same timeframes and you can see relativity of stock to the other.
It also does plot a line that shows any divergence.
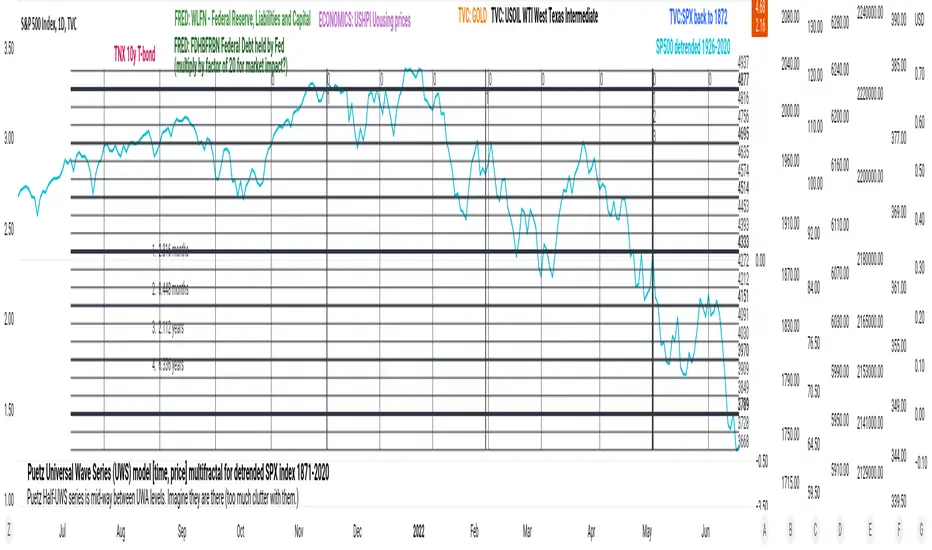
PuetzUWS [time, price] multiFractal mirrors, SPX 1872-2020This script is simply provided because a few rare people may actually be able to use one or two coding ideas. It is not possible to provide useful (description, explanation)s here. Maybe you can find those with a webSearch. If anybody is interested in the basic concept, just copy the code and run with it.
As the original was in violation of PineScript rules, I've removed many links, including :
- documentation of my code
- external sources of code
- blog solutions to Pine script programming
- math, science references, people
Hopefully it will won't be rejected this time, if so, too bad. I only made it through 10% of the conceptual objectives, and I do not believe any of the rest of the concepts are do-able in Pine Script. The current coding is (incomplete, unstable) but does give a faint idea of my "first step" intents. I have stopped all work, as I have to get back to my real projects (nothing to do with markets).
Volatility Calculator for Daily Top and Bottom RangeWith the usage of ATR, applied on the close of the daily candle, I am calculated the volatility channels for the TOP and BOTTOM
Based on this logic, we can estimate, with a huge confidence factor, where the prices are going to be compressed for the trading day.
Having said that, lets take a look at the data gathered among the most important financial markets:
SPX
TOP CROSSES : 2116
BOT CROSSES : 1954
Total Daily Candles : 18908
Occurance ratio = 0.215
NDX
TOP CROSSES : 1212
BOT CROSSES : 1183
Total Daily Candles : 9386
Occurance ratio = 0.255
DIA
TOP CROSSES : 759
BOT CROSSES : 769
Total Daily Candles : 6109
Occurance ratio = 0.25
DXY
TOP CROSSES : 1597
BOT CROSSES : 1598
Total Daily Candles : 13156
Occurance ratio = 0.243
DAX
TOP CROSSES : 1878
BOT CROSSES : 1848
Total Daily Candles : 13155
Occurance ratio = 0.283
BTC USD
TOP CROSSES : 416
BOT CROSSES : 417
Total Daily Candles : 4290
Occurance ratio = 0.194
ETH USD
TOP CROSSES : 247
BOT CROSSES : 268
Total Daily Candles : 2452
Occurance ratio = 0.21
EUR USD
TOP CROSSES : 820
BOT CROSSES : 805
Total Daily Candles : 7489
Occurance ratio = 0.217
GOLD
TOP CROSSES : 1722
BOT CROSSES : 1569
Total Daily Candles : 13747
Occurance ratio = 0.239
USOIL
TOP CROSSES : 1077
BOT CROSSES : 1089
Total Daily Candles : 10231
Occurance ratio = 0.212
US 10Y
TOP CROSSES : 1302
BOT CROSSES : 1365
Total Daily Candles : 9075
Occurance ratio = 0.294
Based on this, we can assume with a very high confidence ( 70-80%) that the market is going to stay, within the range created from the BOT and TOP ATR points.

PClose Levels 2.0This script plots the levels generated via a combination of SPX 2Y Quartiles for everyday, red days, and green days. It is intended for use solely with SPX.
These quartiles are also sorted by VIX averages into bands that expand and contract with VIX.
It gives us an idea of what levels to potentially expect resistance/support fairly well, but is designed to be used in conjunction with other indicators and macroeconomic information.
Green Dashed is your Expected Max Range (EMR+) based on Green Day averages.
Green Dotted is your Expected Range (ER+) based on full dataset averages.
Green solid lines are POS2 and POS1, based on Green Day averages.
White Dotted is your Expected Move (EM), based on full dataset averages.
Red solid lines are NEG1 and NEG2, based on Red Day averages.
Red Dotted is your Expected Range (ER-) based on full dataset averages.
Red Dashed is your Expected Max Range (EMR-) based on Red Day averages.

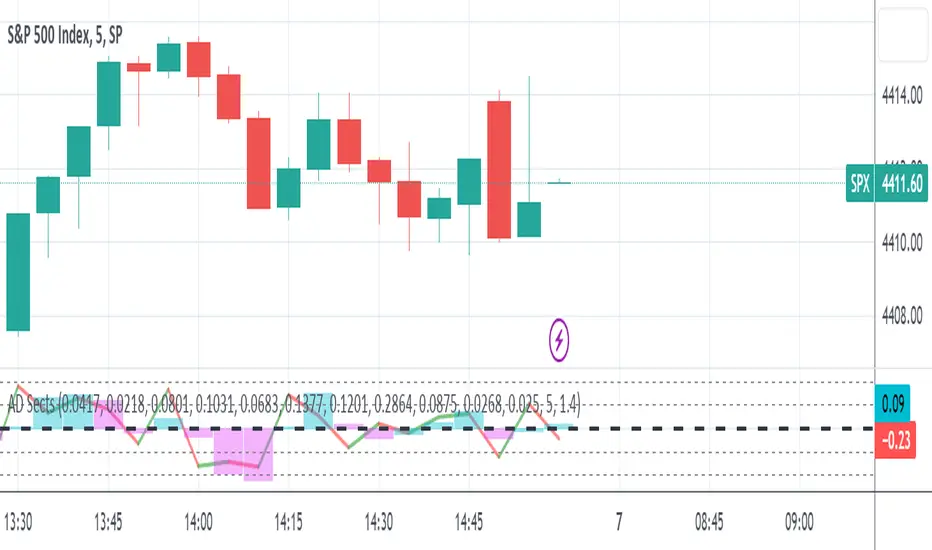
S&P Sector Advance/Decline Weighted -Tom1traderEnjoy, enhance your trading (I hope), copy or adapt to your needs and keep smiling!
Thanks to @MartinShkreli. The sector variables and the "repaint" option (approx lines 20 through 32 of this script) are used directly from your script "Sectors"
RECOMMENDATION: Update the sector weightings -inputs are provided. They change as often as monthly and the
annual changes are certainly significant. When updating weighting percentages use the decimal value. I.E. 29% is .29
Good on any time frame. Especially SPY, SPX and ES scalpers and 0DTE options traders may like this a lot.
This gives good signals on S & P and related (ES, SPY) and indicates / plots differently than the AD line or ratio.
Each sector's entire % weight is added or subtracted depending of whether that sector advanced or declined.
Example: Information Tech weight at 29% so that % of 500 (145) is added if InfoTech is up a penny and subtracted if it is
down a penny. All sectors processed the same way so that for a given bar/candle the value will be between +500 (all
sectors up) and -500 (all sectors down). This weighted AD line of sectors is scaled to +/- 350 and plotted as a red/green line
along with aqua/fuchsia columns of its 5 period ema. The line is actual sector behavior and the columns seem to make a
good signal with column zero crosses standing out.
The columns aqua / fuchsia are a 5 period ema of the Sector AD line and give pretty good signals at
zero cross for SPX. I colored the AD red green line also to emphasize the times it opposes the ema
for example the histo/colums zero cross signal is NOT true when the AD line is showing all or most sectors
going the other way.
For readability, the AD line itself is scaled to 350. This lets the columns of the ema stand out better. The hlines at
350 and at 175 give an idea for the AD green red line how much of the sector's weight is up or down.
350 is all sectors up (advancing) and -350 is all sectors down (declining). The hlines at +/- 175 seem to outline
a more or less "neutral" zone. For example in an uptrend with most of the AD level positive and the columns positive;
a negative spike that does not pass the -175 line and returns positive does not seem to impact the price as much as
a deeper negative spike.
DIX Short Sale VolumeThis indicator combines all the short sale volumes from NASDAQ, NYSE and BATS exchanges and calculates Short Vol % to Total Volume across these 3 exchanges. Use it on Daily Timeframe as shown in the above chart.
For more information on Short Sale Volumes refer to www.finra.org
Usage
When short sale volume data is rising rapidly, it indicates bullishness in the underlying as market makers do not have the shares to sell which results in short sale
When a stock gets dumped by institutions, short sale %age is normally very low and trend is downwards

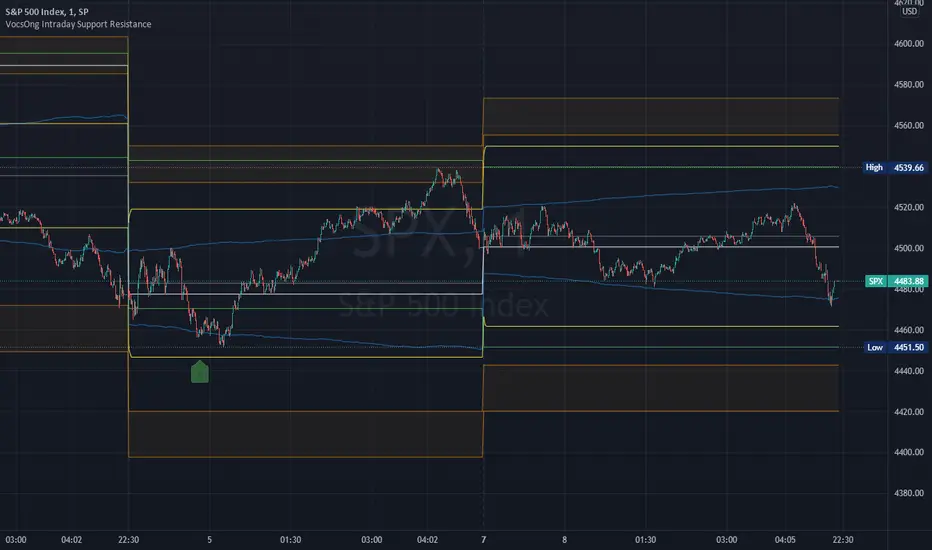
VocsOng Intraday Support ResistanceOverview
This indicator is meant for intraday trading, mainly designed for SPX . The main purpose of this indicator is to mark out the key levels of support and resistance for intraday.
There are 9 main support and resistance that forms this intraday support resistance indicator.
1. Today's Open
Today's open is often a neglected area because by default change percentage is always based on yesterday close. So having a line drawn for today's open is the very starting point.
2. Yesterday Close
3. Yesterday High
4. Yesterday Low
Yesterday Close, High, Low are important intraday trading areas, it is very common that price action resist at this area.
5. Past 4 Days Calculated Estimated High (YesterdayClose + (EstimatedRange/2) :: EstimatedRange = Nearest day x0.4, followed by 0.3, 0.2, 0.1)
6. Past 4 Days Calculated Estimated Low (YesterdayClose - (EstimatedRange/2) :: EstimatedRange = Nearest day x0.4, followed by 0.3, 0.2, 0.1)
This is a calculated estimated high/low range based on past 4 days range. Weighing the nearest day heaviest of 40%, followed by 30%, 20%, 10%.
This calculated high/low area apparently also act as good support and resistance area sometimes.
7. Expected Move High (YesterdayClose + VIX/100 * SquareRoot(1/365))
8. Expected Move Low (YesterdayClose - VIX/100 * SquareRoot(1/365))
This is the formula used to calculate expected move LIVE based on current VIX. This is based from today's open.
9. 1.5% to 2% from SPX Open today
This marks out a zone where SPX is 1.5% to 2% away from today's open. This gives a general guide on a fix percentage change based on today's open.
Statistically, SPX close within 1.5% change from today's open 93.18% of the time in the past 10 years.
How I use them?
First to note, this indicator works best on 1 minute chart. Other timeframe might not be that accurate.
All these are intraday support and resistance. They can be simply use as support and resistance by default.
In addition to that, 7,8,9 are also used as overbought/oversold indicator because they are centered to today's open.
As SPX move towards 7,8,9, it shows how overbought or oversold it is.
I use this indicator with SPX 0 dte options trading.
So as SPX approaches the oversold area, and near any of the support, I will sell a 30 wide put credit spread at 5 delta away or $1 target credit.
This trade entry goes together with a bracket take profit (80%) and stop loss (200%) OCO order.
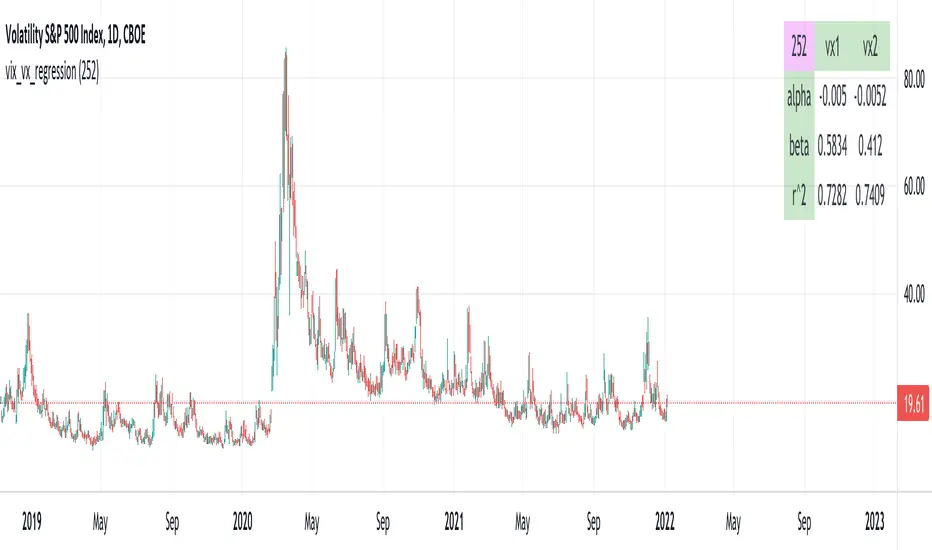
vix_vx_regressionAn example of the linear regression library, showing the regression of VX futures on the VIX. The beta might help you weight VX futures when hedging SPX vega exposure. A VX future has point multiplier of 1000, whereas SPX options have a point multiplier of 100. Suppose the front month VX future has a beta of 0.6 and the front month SPX straddle has a vega of 8.5. Using these approximations, the VX future will underhedge the SPX straddle, since (0.6 * 1000) < (8.5 * 100). The position will have about 2.5 ($250) vega. Use the R^2 (coefficient of determination) to check how well the model fits the relationship between VX and VIX. The further from one this value, the less useful the model.
(Note that the mini, VXM futures also have a 100 point multiplier).
S&P Sector CorrelationScript for Macro:
This indicator shows the 9 day average of the correlation of the 11 S&P500 sectors with the security.
Recommend you use the indicator on SPX or SPY, but you can change the values to be compared.
GLHF
- DPT

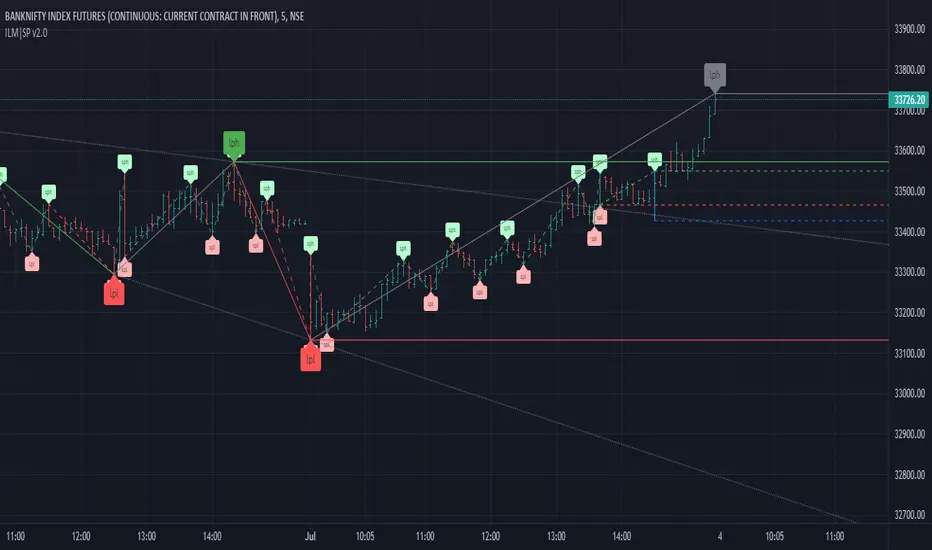
ILM | Structural Pivots v1This script will mark the structural pivots based on some rules.
Solid green/red lines are for major trend to mark LPH (Large Pivot High) and LPL (Large Pivot Low).
Dotted green/red lines are for minor trend SPH (Small Pivot High) and SPL (Small Pivot Low). SPH and SPL are not marked as labels to reduce congestion on the chart.
Gray lines are to identify temporary large pivots before they get promoted to LPH / LPL
Blue lines are to identify temporary small pivots before they get promoted to SPH / SPL
Couple of common trading strategies
- Go Long above LPH
- Go Short below LPL
- Go Long above SPH after LPH
- Go Short below SPL after LPL
Mean Reversion
- Go Long above SPH after LPL
- Go Short below SPL after LPH
This is the initial version and I am making it as public beta to iron out any issues. I might make this script private in future - FYI
vol_premiaThis script shows the volatility risk premium for several instruments. The premium is simply "IV30 - RV20". Although Tradingview doesn't provide options prices, CBOE publishes 30-day implied volatilities for many instruments (most of which are VIX variations). CBOE calculates these in a standard way, weighting at- and out-of-the-money IVs for options that expire in 30 days, on average. For realized volatility, I used the standard deviation of log returns. Since there are twenty trading periods in 30 calendar days, IV30 can be compared to RV20. The "premium" is the difference, which reflects market participants' expectation for how much upcoming volatility will over- or under-shoot recent volatility.
The script loads pretty slow since there are lots of symbols, so feel free to delete the ones you don't care about. Hopefully the code is straightforward enough. I won't list the meaning of every symbols here, since I might change them later, but you can type them into tradingview for data, and read about their volatility index on CBOE's website. Some of the more well-known ones are:
ES: S&P futures, which I prefer to the SPX index). Its implied volatility is VIX.
USO: the oil ETF representing WTI future prices. Its IV is OVX.
GDX: the gold miner's ETF, which is usually more volatile than gold. Its IV is VXGDX.
FXI: a china ETF, whose volatility is VXFXI.
And so on. In addition to the premium, the "percentile" column shows where this premium ranks among the previous 252 trading days. 100 = the highest premium, 0 = the lowest premium.

Relative Strength ComparisonThis script plots the ratio between a ticker and the selected index. Currently, I have US equities indexes listed + BTC. It's a great way to check for relative strength, determine if absolute highs relative to the ratio are being made, etc.
Additionally, optional comparison of the RSI is included. I was just testing something out but figured I'd leave in here because why not. If you use this, enable the 1.0 line.
Script is a bit slow, will try to optimize eventually.

SMART4TRADER-US STOCKSThe indicator is intended to evaluate the stock market , as it takes into account the data on the BUY and SELL of all US shares. In the indicator, you can select various methods for providing data.
Priority = (BUY - SELL) with a intraday cumulative effect.
Ratio = (BUY / SELL) with a intraday cumulative effect.
Delta = (BUY - SELL) on each candle.
Volume = (BUY + SELL) on each candle.
Cumulative = (BUY - SELL) with cumulative for all available history.
------------------------------
Индикатор предназначен для оценки фондового рынка , так как в себе учитывает данные о покупка и продажах всех акций США. В индикаторе можно выбрать различные методы предоставления данных.
PRIORITY = (BUY - SELL) с накопительным эффектом внутри дня.
RATIO= (BUY / SELL) с накопительным эффектом внутри дня.
DELTA= (BUY - SELL) на каждой свече.
VOLUME= (BUY + SELL) на каждой свече.
CUMULATIVE= (BUY - SELL) с накопительным за всю доступную историю на графике.

SMART4TRADER-INDEX PATTERN BREAKOUT MULTIThis indicator is designed to analyze the breakdown of previous values of the candles, not only on the selected tool, but also on others. The indicator is well used on the indices of the stock market. In the default indicator, recommended indexes are configured.
The indicator summarizes the results of the analysis of all tools and shows in the form of columns that are above and \ or below the zero line. Additionally, the indicator has two horizontal lines above zero (green) and two horizontal lines below zero (red). The breakdown of these nearest to zero lines signals the possible beginning of the move towards which the column is directed. If the column reached the left line, this means that a very strong trend is noticeable on all the tools selected in the settings.
Additionally, the indicator has a blue line that shows the average value of the columns both above and below the zero line. And also added Hull Moving Average Period (9).
BUY signal:
HIGH > HIGH(1) и LOW > LOW(1)
SELL signal:
HIGH < HIGH(1) и LOW < LOW(1) и LOW < LOW(2)
--------------------------------------------------------
Этот индикатор предназначен для анализа пробития предыдущих значений свечей, не только на выбранном инструменте, но и на других. Индикатор хорошо использовать на индексах фондового рынка. В индикаторе по умолчанию настроены рекомендуемые индексы для анализа.
Индикатор суммирует результаты анализа всех инструментов и показывает в виде столбиков, которые находиться выше и\или ниже нулевой линии. Дополнительно на индикаторе есть две горизонтальные линии выше нуля (зеленый) и две горизонтальные линии ниже нуля (красный). Пробитие этих ближайших к нулю линий сигнализирует о возможном начале движения в сторону, в которую направлен столбик. Если столбик достиг крайней линии, то это значит, что очень сильный тренд заметен на всех инструментах выбранных в настройках.
Дополнительно в индикаторе есть синяя линия, которая показывает среднее значение столбиков как выше, так и ниже нулевой линии. А также добавлена HULL MOVING AVERAGE период (9).
Сигнал на покупку:
HIGH > HIGH(1) и LOW > LOW(1)
Сигнал на продажу:
HIGH < HIGH(1) и LOW < LOW(1) и LOW < LOW(2)
