DTC AIO [India] v2.0DTC AIO v2.0 – Advanced Technical Analysis Suite
This indicator is a comprehensive dashboard designed specifically for Indian equities, providing traders with a unique blend of trend, volatility, volume, and earnings analytics—all in one panel.
Key Features
Multi-Timeframe Volatility Tables:
Instantly view daily, weekly, and monthly Average Daily Range (ADR) values in a compact, color-coded table.
Relative Volume (RVol) Panel:
Displays real-time relative volume in crores, helping you spot unusual activity at a glance.
Strength Gauge:
A proprietary scoring system that quantifies the frequency and magnitude of price bursts, giving you a unique “Strength” score for each symbol.
Earnings & Sales Table:
Automatically fetches and displays quarterly EPS and sales data, with YoY and QoQ growth, color-coded for clarity.
Theme-Aware Design:
All tables and overlays adapt to dark or light chart themes for maximum readability.
Customizable Watermark:
Add your own signature, timeframe, and price change watermark to the chart, with full control over position and color.
Sector & Industry Info:
Instantly see the symbol’s sector and industry in the main metrics table.
How It Works
Trend & Volatility:
Uses a blend of moving averages (user-selectable type and length) and price/volume patterns to highlight actionable setups.
Strength Gauge:
Calculates a proprietary score based on the frequency and size of price bursts over multiple lookback periods. This algorithm is unique to this script and not available in open-source alternatives.
Relative Volume:
Compares current volume to historical averages, displaying the result in crores for Indian market conventions.
Earnings Table:
Fetches the last four quarters of EPS and sales, automatically calculating and color-coding YoY and QoQ growth.
All tables and overlays are locked to price and update in real time.
How to Use
Add the indicator to your chart.
Customize table positions, watermark, and theme via the settings panel.
Use the dashboard to quickly assess trend, volatility, strength, and earnings for any Indian equity.
Hover over table cells for tooltips and additional information.
Why Closed Source?
This script is closed-source due to the proprietary nature of the “Strength Gauge” algorithm and the integrated dashboard logic, which are not available in open-source scripts. The unique scoring and visualization methods provide a competitive edge for users.
Notes
Designed for Indian equities, but can be used on any symbol.
All calculations are performed in real time and optimized for performance.
For best results, use on daily or higher timeframes.
If you have questions or feedback, please use the TradingView comments section.v
Indianstocks

Relative strength of a stock against the sugar index (Top 18)This indicator can be used for sugar stocks to compare their relative strength with that of their respective industry. It can also be used to gauge the momentum in sugar stocks against the other indexes like Nifty, Bank Nifty, CNXIT, CNXAUTO and check which index is outperforming the other.
Made with reference to the index published by Stef @Scheplick

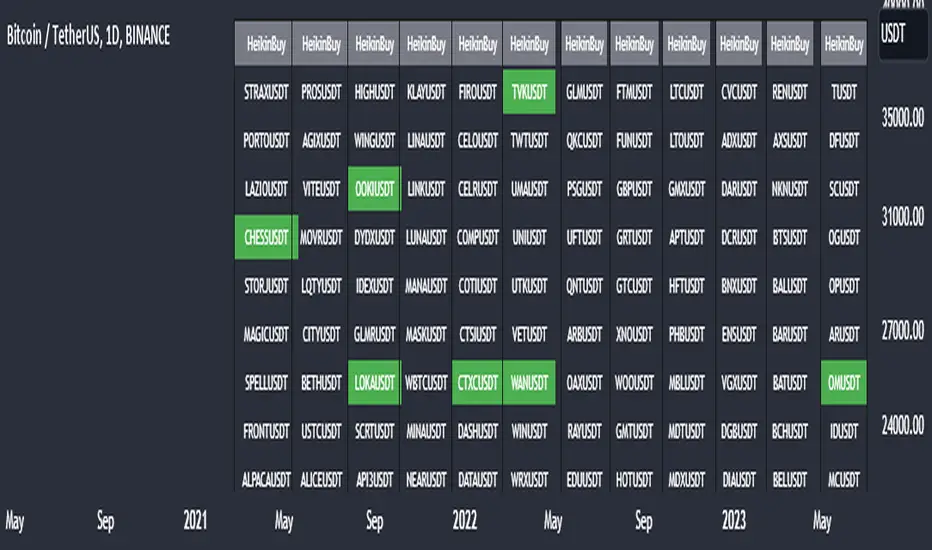
Heikin Ashi Master Buy Signal ScannerHeikin Ashi Master Buy Signal Scanner is an algorithm consisting of smoothed Heiken Ashi candles and moving averages.Moving averages use 5 basic moving averages. I preferably use ema for smoothing.In addition, the main purpose of this indicator is the preferred stock market and its shares, trading pairs, etc. scanning on a single screen and seeing the buy signals on a single screen.The buy signal appears on the screen as green.
With Column Width from the indicator properties, the width of the column of 30 symbols is adjusted, and the position of the column on the screen is adjusted with the Column Number.
With the indicator, a maximum of 30 symbols can be listed at once. However, this number can be increased according to your tradingview membership type. Especially if you are a premium member of tradingview, you can add as many indicators as you want to the chart without any limitation, and you can add as many symbols as your screen width to the chart. Heikin Ashi Master Buy signals you can see on a single screen.
In addition, the indicator gives you the opportunity to set the time zone you want and you can see the signals according to the time zone you want. All you need to do for this is to set the time zone from the indicator properties.
Now, if you wish, you can see examples of scans made on a single screen below.
Buy signals of 346 coins of Binance usdt trading pair on a single screen
Buy signals of 420 stocks of the Indian market on a single screen
Buy signals of 300 stocks of the NASDAQ on a single screen
Buy signals of 300 stocks of the BORSA ISTANBUL-BIST on a single screen
Buy signals on a single screen with 49 trading pairs in Forex
BANK NIFTY Constituents Technical Rating [tanayroy]Banknifty comprises 12 companies listed on the National Stock Exchange of India (NSE). Movement of Banknifty depends on these stocks. The script depicts Technical rating and price change stats of Banknifty constituents.
I have calculated the weight factor using annual floating stock stats available in Tradingview. So, it may differ considerably from the actual weight. It is just for reference.
I have found this useful in my trading.
Please like, share, and comment.

Simple Moving Average 20,50,100This SMA Script is modified and is based on 3 bands which are of 20 days, 50 days, 100 days average line.
This is a very appropriate for Indian Markets.
**How to Use :**
***BUY***
When the chart pattern is as follows :-
- SMA 200 (Black)
- SMA 50 (Red)
- SMA 20 (Green)
- "Last Traded Price"
***SELL***
When the chart pattern is as follows :-
- "Last Traded Price"
- SMA 20 (Green)
- SMA 50 (Red)
- SMA 200 (Black)
And Book Good Profits!!!

JARVISJARVIS is a technical indicator primarily designed for Nifty Bank. But, it also works on other instruments like stocks for example. You may apply it on other instruments if you find it useful.
Once the indicator is plotted, it will have bars with 3 colours
1) Blue - It's watching
2) Green - It's bullish
3) Red - It's bearish
So, it's that easy to interpret.
Following are few examples on NSE:BANKNIFTY
September 20, 2019 - Indicator turned green and remained so till end of the day. If you would have followed this, you would have made more than 2000 points.
September 25, 2019 - Indicator turned red and remained so till end of the day. If you would have followed this, you would have made more than 100 points.
September 26, 2019 and September 27, 2019 - Indicator remained blue and you see that the market was just consolidating.
Above are just a few examples of what this is capable of. Apart from Nifty Bank, it also works well on popular stocks like Reliance, TCS, SBIN etc
Recommended time frame for this is 15 mins, but, you may experiment with other time frames as well. It's all about finding the right time frame for that particular instrument, for example it works best on 2H when applied on Nifty.
Should you have any doubts, feel free to DM me.
