DTC AIO [India] v2.0DTC AIO v2.0 – Advanced Technical Analysis Suite
This indicator is a comprehensive dashboard designed specifically for Indian equities, providing traders with a unique blend of trend, volatility, volume, and earnings analytics—all in one panel.
Key Features
Multi-Timeframe Volatility Tables:
Instantly view daily, weekly, and monthly Average Daily Range (ADR) values in a compact, color-coded table.
Relative Volume (RVol) Panel:
Displays real-time relative volume in crores, helping you spot unusual activity at a glance.
Strength Gauge:
A proprietary scoring system that quantifies the frequency and magnitude of price bursts, giving you a unique “Strength” score for each symbol.
Earnings & Sales Table:
Automatically fetches and displays quarterly EPS and sales data, with YoY and QoQ growth, color-coded for clarity.
Theme-Aware Design:
All tables and overlays adapt to dark or light chart themes for maximum readability.
Customizable Watermark:
Add your own signature, timeframe, and price change watermark to the chart, with full control over position and color.
Sector & Industry Info:
Instantly see the symbol’s sector and industry in the main metrics table.
How It Works
Trend & Volatility:
Uses a blend of moving averages (user-selectable type and length) and price/volume patterns to highlight actionable setups.
Strength Gauge:
Calculates a proprietary score based on the frequency and size of price bursts over multiple lookback periods. This algorithm is unique to this script and not available in open-source alternatives.
Relative Volume:
Compares current volume to historical averages, displaying the result in crores for Indian market conventions.
Earnings Table:
Fetches the last four quarters of EPS and sales, automatically calculating and color-coding YoY and QoQ growth.
All tables and overlays are locked to price and update in real time.
How to Use
Add the indicator to your chart.
Customize table positions, watermark, and theme via the settings panel.
Use the dashboard to quickly assess trend, volatility, strength, and earnings for any Indian equity.
Hover over table cells for tooltips and additional information.
Why Closed Source?
This script is closed-source due to the proprietary nature of the “Strength Gauge” algorithm and the integrated dashboard logic, which are not available in open-source scripts. The unique scoring and visualization methods provide a competitive edge for users.
Notes
Designed for Indian equities, but can be used on any symbol.
All calculations are performed in real time and optimized for performance.
For best results, use on daily or higher timeframes.
If you have questions or feedback, please use the TradingView comments section.v
Indianstocks

Indian NIFTY Correlation Daytrade/Swing StrategyINTRODUCTION :
This is a daytrading/swing strategy designed mainly for indian market where internally has been adapted to NIFTY market and as well using for internal calculations the values of the candles from NIFTY asset.
With it we search to use with the most correlated asset from the indian market.
For this example I choosed BANKNIFTY
STRATEGY:
The strategy initially uses as candle values the data from the NIFTY asset.
With them I am dividing the work into two calculation parts such as :
-For first part logic, I am doing calculations regarding the volatility of NIFTY, where I initially take into consideration INDIAVIX to have an idea of the expected implied volatility of NIFTY asset and then I compare it with different tools such as ATR, BB and Percentile location of the volatility.
Based on all these factors I take into account the location of the volatility which is atm and if there is a possibility of a strong movement(trend) or sidemarket situation.
-Once I am done with the values of the volatility, the next process in the script logic is to start looking into the trend.
For it I am using different tools such as volume checker, support and resistence key points, pivot points, price actions patterns and different moving averages.
-Risk management part : once we are done with calculation for the entry, the next part is to have an idea where to exit. In this case I am making use of a dynamic risk management which is compressed from multiple ideas such as : we can exit if there were a big gap on the next day in our initial direction, we can also exit based of an internal daily ATR calculation value(we use initially 15min timeframe chart) and lastly if we are around some key points like support/resistence or other different chart patterns like double top, double bot and so on.
CASE EXAMPLE:
As I said before we are initially using for calculation the NIFTY chart with 15min timeframe. With it we can apply to any indian etf,stocks,future. All the assets are going to have the same time of entry and the same time of exit(we get this from NIFTY) and we plot it on the chart we are using, so its key point to look for assets which have a min 75-80% correlation with NIFTY. For this example I used BANKNIFTY chart.
So a type of entry would be this way
Lets assume NIFTY50 is on 19.000 level
INDIAVIX level is currently at 11 which can be translated : 11 / sqrt(250)
So 11 means that on a yearly base we expect the asset to move 11% upwards or downwards
and in a year we have aprox 250 days. So we divide the 11 by sqrt of 250 to get an idea of a daily expected move from the implied volatility of india VIX
11/15.87 = +-0.69%
So INDIAVIX tells us that the values for today nifty is 19000+0,69% and 19000-0.69%
After that I am looking into the daily ATR, and I see that the expected is around 0.8% and is ascending over the last 2 weeks.
Lastly I am looking at the percentile which is currently the volatility on both ATR and INDIAVIX, and I get a value of 90th percentile.
With this my biased is that we are going to expect a short trend, but i cant confirm on the volatility alone so next step is start looking into technical analysis.
I look at volume and is increasing, I look at different price actions paterns and pivots and I see a lower low and a lower high (a descending pattern).
I also see the price is below the key MA like SMA50/100/200, VWAP and so on.
With all of this I get more confirmation that the asset is in a short trend.
Internally once a certain specific % of confirmation from all the logics is achieved, it will trigger a long/short entry, so in this case lets assume we have 80% of our indicators pointing to the short, is going to enter a short.
Now for a long scenario the scene would be , indiavix is around 9,5, ATR is descending. We are around 40th percentile of the volatility.
Our asset is above multiple moving averages, vwap , etc
We have an increasing volume towards bullish side.
And so on( overall 75% of our indicators are pointing towards the long side)
Now for the exit, since we are dealing with a daytrade/swing mentality, short on average we keep the trade open for a less period of time than long ( 19 bars of 15min candles, compared to 57 bars of 15min for long) , so most of the times for short we are going to exit next day and if the trend is still in our favour we re enter the trade.
For long we can stay much more time, sometimes even weeks and we exit mainly when the % of confirmation of indicators point out a reversal/short confirmation fo a big pice action pattern.
STRATEGY RESULTS
For strategy analysis I have used BANKNIFTY NSE with deep history to get access to data from 2011 until present( giving more than 2500 trades) .
For inputs I am using 0.02% comission total ( the comission applied from ZERODHA indian exchange is close to 0.0175% total) so I used it a bit higher in order to take into account some slippages.
For capital THE REASON I USED 100% of the capital allocation is to make a proper comparison with the buy an hold from the same period
Lets assume we had an account of 1M ruppes initially in 2011, we start using 100% of it and then the new values automatically compounded with the new profits and losses so directly compare with 1M of rupees in shares on BANKNIFTY ETFs bought in 2011(buy n hold) until present day.
STRATEGY ACCESS
Strategy is free to be tested for everyone, just let me know in private that you wish to get access to it.

Relative strength of a stock against the sugar index (Top 18)This indicator can be used for sugar stocks to compare their relative strength with that of their respective industry. It can also be used to gauge the momentum in sugar stocks against the other indexes like Nifty, Bank Nifty, CNXIT, CNXAUTO and check which index is outperforming the other.
Made with reference to the index published by Stef @Scheplick

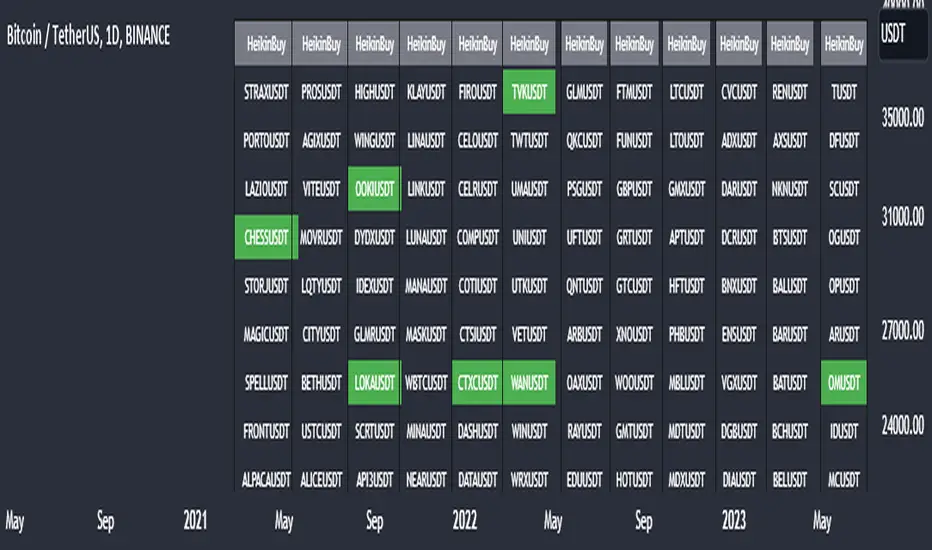
Heikin Ashi Master Buy Signal ScannerHeikin Ashi Master Buy Signal Scanner is an algorithm consisting of smoothed Heiken Ashi candles and moving averages.Moving averages use 5 basic moving averages. I preferably use ema for smoothing.In addition, the main purpose of this indicator is the preferred stock market and its shares, trading pairs, etc. scanning on a single screen and seeing the buy signals on a single screen.The buy signal appears on the screen as green.
With Column Width from the indicator properties, the width of the column of 30 symbols is adjusted, and the position of the column on the screen is adjusted with the Column Number.
With the indicator, a maximum of 30 symbols can be listed at once. However, this number can be increased according to your tradingview membership type. Especially if you are a premium member of tradingview, you can add as many indicators as you want to the chart without any limitation, and you can add as many symbols as your screen width to the chart. Heikin Ashi Master Buy signals you can see on a single screen.
In addition, the indicator gives you the opportunity to set the time zone you want and you can see the signals according to the time zone you want. All you need to do for this is to set the time zone from the indicator properties.
Now, if you wish, you can see examples of scans made on a single screen below.
Buy signals of 346 coins of Binance usdt trading pair on a single screen
Buy signals of 420 stocks of the Indian market on a single screen
Buy signals of 300 stocks of the NASDAQ on a single screen
Buy signals of 300 stocks of the BORSA ISTANBUL-BIST on a single screen
Buy signals on a single screen with 49 trading pairs in Forex
CONSOLIDATION BAND BREAKOUT [5MIN TF]CONSOLIDTION BREAKOUT STRATEGY for 5 minute Time-Frame , that has the time condition adjustable for Indian Markets.
// ══════════════════════════════════════════════════════════════════════════ //
Unlike the Free Scripts - Risk Management , Position Sizing , Partial Exit etc. are also included .
Message to know more about the strategy.
// ══════════════════════════════════════════════════════════════════════════ //
The Timing can be changed to fit other markets, scroll down to "TIME CONDITION" to know more.
The commission is also included in the strategy .
The basic idea is when ,
1) Price crosses above upper Level ,indicated by Red Line, is a Long condition .
2) Price crosses below lower Level ,indicated by Green Line , is a Short condition .
3) Candle close crosses above ema1 , is a part of the Long condition .
4) Candle close crosses below ema1 , is a part of the Short condition .
5) Allowed hours specifies the trade entry timing.
6) ATR STOP is the stop-loss value on chart , can be adjusted in INPUTS.
7) Target 1 is the 1st target value on chart , can be adjusted in INPUTS.
8) RISK is Maximum Risk per trade for the intraday trade can be changed .
9) Total Capital used can be adjusted under INPUTS.
10) ATR TRAIL is used for trailing after entry, as mentioned in the inputs below.
11) Check trades under the list of trades .
12) Trade only in liquid stocks .
13) Risk only 1-5% of total capital.
14) Inputs can be changed for better back-test results, but also manually check the trades before setting alerts
15) SQUARE OFF TIME - As you change the time frame , also change the square-off time to that candle's closing time.
Eg: For 3min Time-frame , Hour = 2Hrs | Minute = 57min
16) Strategy stops for the day if you have a loss .
*The input values and the results are mentioned under "BACKTEST RESULTS" below*
// ══════════════════════════════ //
// ————————> RISK MANAGEMENT <——————— //
// ══════════════════════════════ //
Risk management is done based on max loss per trade and can be adjusted in the INPUTS.
// ═══════════════════════════ //
// ————————> POSITION SIZE <——————— //
// ═══════════════════════════ //
Quantity of each trade is different based on the loss
// ═════════════════════════ //
// ————————> PROPERTIES <——————— //
// ═════════════════════════ //
COMMISSION , SLIPPAGE ,RECALCULATE is already mentioned .
COMMISSION can be charges , based on the broker charges.
// ═══════════════════════════════//
// ————————> TIME CONDITION <————————— //
// ═══════════════════════════════//
The time can be changed in the INPUT.
The Indian Markets open at 9:15am and closes at 3:30pm.
The 'Allowed hours' under Inputs specifies the time at which Entries should happen .
"Close All" function closes all the trades before 3pm , at the open of the next candle.
To change the time to close all trades , check INPUT.
All open trades get closed at 3pm , because some brokers don't allow you to place fresh intraday orders after 3pm .
// ═══════════════════════════════════════════════ //
// ————————> BACKTEST RESULTS ( 123 CLOSED TRADES )<————————— //
// ═══════════════════════════════════════════════ //
INPUTS can be changed for better Back-Test results.
The strategy applied to NSE:TCS (5 min Time-Frame and with a capital of 1,00,000 ) gives us 77% profitability , as shown below
It was tested for a period a 1 year with a Profit Factor of 2.143 ,net Profit of 10,886 Rs .
The Initial Capital and Risk can be increased for better results.
The graph has a Linear Curve with Consistent Profits.
The INPUTS are as follows,
1) LENGTH ——————————————> 79
2) MUT_STDEV ————————————> 2.3
3) ALLOWED HRS ———————————> 9:25 TO 14:30
4) ATR STOP ——————————————> 2.2
5) RISK ——————————————————> 400
6) ATR TRAIL ———————————————> 2.6
7) TARGET 1 ————————————————> 2.1
8) MAX POSITION VALUE ——————————> 1,00,000
8) MAX DRAWDOWN —————————————> 2,000
8) SQUARE-OFF ————————————————> 14:55
NSE:TCS
Apply it to your charts Now !!
Send us a message to know more about this strategy
Thank You ☺ NSE:TCS

BANK NIFTY Constituents Technical Rating [tanayroy]Banknifty comprises 12 companies listed on the National Stock Exchange of India (NSE). Movement of Banknifty depends on these stocks. The script depicts Technical rating and price change stats of Banknifty constituents.
I have calculated the weight factor using annual floating stock stats available in Tradingview. So, it may differ considerably from the actual weight. It is just for reference.
I have found this useful in my trading.
Please like, share, and comment.

Simple Moving Average 20,50,100This SMA Script is modified and is based on 3 bands which are of 20 days, 50 days, 100 days average line.
This is a very appropriate for Indian Markets.
**How to Use :**
***BUY***
When the chart pattern is as follows :-
- SMA 200 (Black)
- SMA 50 (Red)
- SMA 20 (Green)
- "Last Traded Price"
***SELL***
When the chart pattern is as follows :-
- "Last Traded Price"
- SMA 20 (Green)
- SMA 50 (Red)
- SMA 200 (Black)
And Book Good Profits!!!

IPB_AOPM_BOThis is an intraday trading strategy.
Concept :
Underlying concept is that Amateurs open the market and Professionals close the market. Hence this system tries to capture the breakout in the afternoon session. After One PM Breakout (AOPM breakout). This essentially means that one has to go long once the high of the market till 1 pm is broken out and similarly go short once the low of the market till 1 pm is broken down.
Position sizing:
This strategy assumes taking 10 lots of Indian Market Index which approximately requires a margin of around INR 25,00,000. Hence capital is chosen as INR 25,00,000. Currency is assumed to be INR , however the system shows USD as currency as there is no INR option available. Commissions assumed to be at INR 50 per order as against the INR 20 per charged by retail brokers in India in real world market.
Disclaimer:
Past performance is not representative of future performance. Hence the author is not responsible for any trading loss arising out of implementing this strategy. Hence please implement at your own risk. Trading can result in loss of entire capital.

Channel Cross StrategyTrend Following using Channel based Script. Long and Short Entry based on Custom filter to avoid False Signal.
Works best for BankNifty and Nifty and few Indian Stocks.
Untick Exponential gives better Result.

JARVISJARVIS is a technical indicator primarily designed for Nifty Bank. But, it also works on other instruments like stocks for example. You may apply it on other instruments if you find it useful.
Once the indicator is plotted, it will have bars with 3 colours
1) Blue - It's watching
2) Green - It's bullish
3) Red - It's bearish
So, it's that easy to interpret.
Following are few examples on NSE:BANKNIFTY
September 20, 2019 - Indicator turned green and remained so till end of the day. If you would have followed this, you would have made more than 2000 points.
September 25, 2019 - Indicator turned red and remained so till end of the day. If you would have followed this, you would have made more than 100 points.
September 26, 2019 and September 27, 2019 - Indicator remained blue and you see that the market was just consolidating.
Above are just a few examples of what this is capable of. Apart from Nifty Bank, it also works well on popular stocks like Reliance, TCS, SBIN etc
Recommended time frame for this is 15 mins, but, you may experiment with other time frames as well. It's all about finding the right time frame for that particular instrument, for example it works best on 2H when applied on Nifty.
Should you have any doubts, feel free to DM me.
