Directional Sentiment IndicatorThe Directional Sentiment Indicator is a versatile tool designed to capture price movements by combining several key technical elements, providing traders with actionable insights in volatile and trending markets. This script intelligently integrates price action analysis with the Average True Range (ATR) for precise target zones and directional signals.
Key Components & Their Roles:
1. Moving Averages and ATR Zones: The script utilizes custom high, low, open, and close averages over the selected period to gauge directional bias. By combining these averages with ATR, we define potential high and low targets dynamically, making it easier to visualize potential reversals.
2. Buy/Sell Signals Based on Price Proximity to Extremes: Using calculated price distances from highest/lowest points, the indicator identifies long and short signals when prices reach statistically significant deviations. This is designed to capture trend reversals or continuations at critical junctures, reducing noise from insignificant movements.
3. Highlighting Price Crossovers and Zones: The script plots boxes when price crosses above or below critical ATR levels, providing clear visual zones where price may experience increased resistance or support. This functionality helps users identify areas where market direction may shift.
4. Dynamic Plotting of Highs/Lows: With options to plot crossover and undershoot signals, traders can visually assess momentum shifts with green and red arrows for bullish and bearish crossovers respectively. This visual overlay enhances the trader’s ability to make quicker decisions.
This unique combination not only marks direction and key reversal areas but also provides context with ATR-based range boxes, making it an essential tool for traders seeking both clarity and precision in market movements.
I-BTC

Dynamic Linear CandlesDynamic Linear Candles is a unique and versatile indicator that reimagines traditional candlestick patterns by integrating customizable moving averages directly into candle structures. This dynamic approach smooths the appearance of candlesticks to better highlight trends and suppress minor market noise, allowing traders to focus on essential price movements.
Key Features:
1. Dynamic Candle Smoothing: Choose between popular smoothing types (SMA, EMA, WMA, HMA) to apply directly to each candle’s Open, High, Low, and Close values. This adaptive smoothing reveals hidden trends by refining price action into simplified, flowing candles, ideal for spotting subtle changes in market sentiment.
2. Signal Line Overlay: The signal line provides an additional layer of trend confirmation. Select from SMA, EMA, WMA, or HMA smoothing to match your trading style. The line dynamically changes color based on the price’s relative position, helping traders quickly identify bullish or bearish shifts.
3. Enhanced Candle Visualization: Candles adjust in color and opacity based on bullish or bearish trends, providing immediate visual cues about market momentum. The customized color and opacity settings allow for clearer distinction, especially in noisy markets.
Why This Combination?
This script is more than just an aesthetic adjustment; it’s a purposeful combination of moving averages and candle smoothing designed to enhance readability and actionable insights. Traditional candles often suffer from excessive noise in volatile markets, and this mashup addresses that by creating a smooth, flowing chart that adapts to the underlying trend. The Signal Line adds confirmation, acting as a filter for potential entries and exits. Together, these elements serve as a concise toolset for traders aiming to capture trend-based opportunities with clarity and precision.

Pulse DPO: Major Cycle Tops and Bottoms█ OVERVIEW
Pulse DPO is an oscillator designed to highlight Major Cycle Tops and Bottoms .
It works on any market driven by cycles. It operates by removing the short-term noise from the price action and focuses on the market's cyclical nature.
This indicator uses a Normalized version of the Detrended Price Oscillator (DPO) on a 0-100 scale, making it easier to identify major tops and bottoms.
Credit: The DPO was first developed by William Blau in 1991.
█ HOW TO READ IT
Pulse DPO oscillates in the range between 0 and 100. A value in the upper section signals an OverBought (OB) condition, while a value in the lower section signals an OverSold (OS) condition.
Generally, the triggering of OB and OS conditions don't necessarily translate into swing tops and bottoms, but rather suggest caution on approaching a market that might be overextended.
Nevertheless, this indicator has been customized to trigger the signal only during remarkable top and bottom events.
I suggest using it on the Daily Time Frame , but you're free to experiment with this indicator on other time frames.
The indicator has Built-in Alerts to signal the crossing of the Thresholds. Please don't act on an isolated signal, but rather integrate it to work in conjunction with the indicators present in your Trading Plan.
█ OB SIGNAL ON: ENTERING OVERBOUGHT CONDITION
When Pulse DPO crosses Above the Top Threshold it Triggers ON the OB signal. At this point the oscillator line shifts to OB color.
When Pulse DPO enters the OB Zone, please beware! In this Area the Major Players usually become Active Sellers to the Public. While the OB signal is On, it might be wise to Consider Selling a portion or the whole Long Position.
Please note that even though this indicator aims to focus on major tops and bottoms, a strong trending market might trigger the OB signal and stay with it for a long time. That's especially true on young markets and on bubble-mode markets.
█ OB SIGNAL OFF: EXITING OVERBOUGHT CONDITION
When Pulse DPO crosses Below the Top Threshold it Triggers OFF the OB signal. At this point the oscillator line shifts to its normal color.
When Pulse DPO exits the OB Zone, please beware because a Major Top might just have occurred. In this Area the Major Players usually become Aggressive Sellers. They might wind up any remaining Long Positions and Open new Short Positions.
This might be a good area to Open Shorts or to Close/Reverse any remaining Long Position. Whatever you choose to do, it's usually best to act quickly because the market is prone to enter into panic mode.
█ OS SIGNAL ON: ENTERING OVERSOLD CONDITION
When Pulse DPO crosses Below the Bottom Threshold it Triggers ON the OS signal. At this point the oscillator line shifts to OS color.
When Pulse DPO enters the OS Zone, please beware because in this Area the Major Players usually become Active Buyers accumulating Long Positions from the desperate Public.
While the OS signal is On, it might be wise to Consider becoming a Buyer or to implement a Dollar-Cost Averaging (DCA) Strategy to build a Long Position towards the next Cycle. In contrast to the tops, the OS state usually takes longer to resolve a major bottom.
█ OS SIGNAL OFF: EXITING OVERSOLD CONDITION
When Pulse DPO crosses Above the Bottom Threshold it Triggers OFF the OS signal. At this point the oscillator line shifts to its normal color.
When Pulse DPO exits the OS Zone, please beware because a Major Bottom might already be in place. In this Area the Major Players become Aggresive Buyers. They might wind up any remaining Short Positions and Open new Long Positions.
This might be a good area to Open Longs or to Close/Reverse any remaining Short Positions.
█ WHY WOULD YOU BE INTERESTED IN THIS INDICATOR?
This indicator is built over a solid foundation capable of signaling Major Cycle Tops and Bottoms across many markets. Let's see some examples:
Early Bitcoin Years: From 0 to 1242
This chart is in logarithmic mode in order to properly display various exponential cycles. Pulse DPO is properly signaling the major early highs from 9-Jun-2011 at 31.50, to the next one on 9-Apr-2013 at 240 and the epic top from 29-Nov-2013 at 1242.
Due to the massive price movements, the OB condition stays pinned during most of the exponential price action. But as you can see, the OB condition quickly vanishes once the Cycle Top has been reached. As the market matures, the OB condition becomes more exceptional and triggers much closer from the Cycle Top.
With regards to Cycle Bottoms, the early bottom of 2 after having peaked at 31.50 doesn’t get captured by the indicator. That is the only cycle bottom that escapes the Pulse DPO when the bottom threshold is set at a value of 5. In that event, the oscillator low reached 6.95.
Bitcoin Adoption Spreading: From 257 to 73k
This chart is in logarithmic mode in order to properly display various exponential cycles. Pulse DPO is properly signaling all the major highs from 17-Dec-2017 at 19k, to the next one on 14-Apr-2021 at 64k and the most recent top from 9-Nov-2021 at 68k.
During the massive run of 2017, the OB condition still stayed triggered for a few weeks on each swing top. But on the next cycles it started to signal only for a few days before each swing top actually happened. The OB condition during the last cycle top triggered only for 3 days. Therefore the signal grows in focus as the market matures.
At the time of publishing this indicator, Bitcoin printed a new All Time High (ATH) on 13-Mar-2024 at 73k. That run didn’t trigger the OB condition. Therefore, if the indicator is correct the Bitcoin market still has some way to grow during the next months.
With regards to Cycle Bottoms, the bottom of 3k after having peaked at19k got captured within the wide OS zone. The bottom of 15k after having peaked at 68k got captured too within the OS accumulation area.
Gold
Pulse DPO behaves surprisingly well on a long standing market such as Gold. Moving back to the 197x years it’s been signaling most Cycle Tops and Bottoms with precision. During the last cycle, it shows topping at 2k and bottoming at 1.6k.
The current price action is signaling OB condition in the range of 2.5k to 2.7k. Looking at past cycles, it tends to trigger on and off at multiple swing tops until reaching the final cycle top. Therefore this might indicate the first wave within a potential gold run.
Oil
On the Oil market, we can see that most of the cycle tops and bottoms since the 80s got signaled. The only exception being the low from 2020 which didn’t trigger.
EURUSD
On Forex markets the Pulse DPO also behaves as expected. Looking back at EURUSD we can see the marketing triggering OB and OS conditions during major cycle tops and bottoms from recent times until the 80s.
S&P 500
On the S&P 500 the Pulse DPO catched the lows from 2016 and 2020. Looking at present price action, the recent ATH didn’t trigger the OB condition. Therefore, the indicator is allowing room for another leg up during the next months.
Amazon
On the Amazon chart the Pulse DPO is mirroring pretty accurately the major swings. Scrolling back to the early 2000s, this chart resembles early exponential swings in the crypto space.
Tesla
Moving onto a younger tech stock, Pulse DPO captures pretty accurately the major tops and bottoms. The chart is shown in logarithmic scale to better display the magnitude of the moves.
█ SETTINGS
This indicator is ideal for identifying major market turning points while filtering out short-term noise. You are free to adjust the parameters to align with your preferred trading style.
Parameters : This section allows you to customize any of the Parameters that shape the Oscillator.
Oscillator Length: Defines the period for calculating the Oscillator.
Offset: Shifts the oscillator calculation by a certain number of periods, which is typically half the Oscillator Length.
Lookback Period: Specifies how many bars to look back to find tops and bottoms for normalization.
Smoothing Length: Determines the length of the moving average used to smooth the oscillator.
Thresholds : This section allows you to customize the Thresholds that trigger the OB and OS conditions.
Top: Defines the value of the Top Threshold.
Bottom: Defines the value of the Bottom Threshold.

Trend IdentifierThe “Trend Identifier” indicator is designed to help traders quickly identify trending and sideways market conditions, allowing them to adapt their strategies based on the prevailing market sentiment. By combining several technical analysis tools—ATR (Average True Range), ADX (Average Directional Index), EMA (Exponential Moving Average), and RSI (Relative Strength Index)—this script provides insights into the market’s strength, direction, and volatility to improve trade decision-making.
How It Works
1. ATR (Average True Range):
• ATR measures market volatility. In this script, ATR is used in combination with a moving average to identify periods of rising or falling volatility, which helps differentiate between trending and non-trending conditions.
2. ADX (Average Directional Index):
• ADX is a key component in identifying the strength of a trend. The script uses a threshold system to classify market conditions:
• If ADX is low (below a specified threshold plus a buffer) and ATR indicates low volatility, the market is likely in a sideways condition.
• If ADX is high (above a threshold minus a buffer) with increasing ATR, the market is likely in a trending condition.
3. EMA (Exponential Moving Average):
• A 20-period EMA is used instead of a simple moving average to enhance trend detection speed. The close price’s position relative to the EMA helps identify bullish or bearish trends when combined with ADX and ATR data.
4. RSI (Relative Strength Index):
• RSI acts as a confirmation tool for trend strength. A bullish trend is confirmed if RSI is above 50 and the price is above the EMA, whereas a bearish trend is confirmed if RSI is below 50 and the price is below the EMA.
Market Condition Signals
• Sideways Signal:
• When ADX and ATR indicate a low-volatility, sideways market, the indicator changes the background color to gray, signaling potential low-trend movement or consolidation. A “S” symbol appears above the bars, making it easier to spot this condition.
• Bullish Trend:
• When conditions favor a strong upward trend, the background changes to green. A “B” symbol is displayed below the bar, indicating the onset of a bullish market condition.
• Bearish Trend:
• Conversely, if conditions indicate a downward trend, the background color changes to red. A “S” symbol is displayed below the bar, showing a bearish trend condition.
Using the Indicator
This indicator helps traders understand the current market structure in a glance:
• Sideways (Gray): Low-volatility consolidation period, ideal for range-bound strategies or waiting for a breakout.
• Bullish (Green): Confirmed uptrend, potentially suitable for buying or long entries.
• Bearish (Red): Confirmed downtrend, ideal for short selling or exiting long positions.
The “Trend Identifier” is a powerful tool for traders who seek a clear view of the market structure, using a balanced approach of volatility, trend strength, and momentum. By combining the power of ATR, ADX, EMA, and RSI, this indicator provides a nuanced picture of the market’s behavior, assisting traders in making more informed decisions.

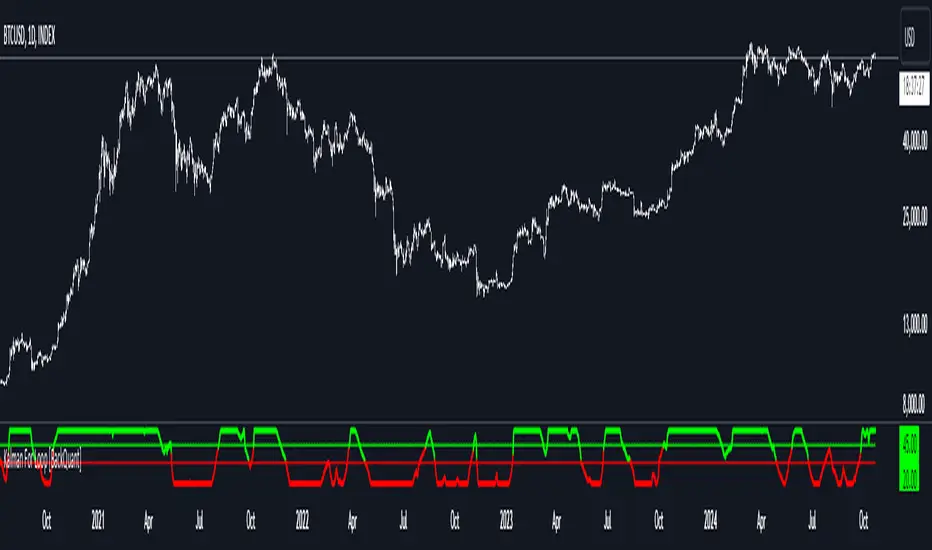
Kalman For Loop [BackQuant]Kalman For Loop
Introducing BackQuant's Kalman For Loop (Kalman FL) — a highly adaptive trading indicator that uses a Kalman filter to smooth price data and generate actionable long and short signals. This advanced indicator is designed to help traders identify trends, filter out market noise, and optimize their entry and exit points with precision. Let’s explore how this indicator works, its key features, and how it can enhance your trading strategies.
Core Concept: Kalman Filter
The Kalman Filter is a mathematical algorithm used to estimate the state of a system by filtering noisy data. It is widely used in areas such as control systems, signal processing, and time-series analysis. In the context of trading, a Kalman filter can be applied to price data to smooth out short-term fluctuations, providing a clearer view of the underlying trend.
Unlike moving averages, which use fixed weights to smooth data, the Kalman Filter adjusts its estimate dynamically based on the relationship between the process noise and the measurement noise. This makes the filter more adaptive to changing market conditions, providing more accurate trend detection without the lag associated with traditional smoothing techniques.
Please see the original Kalman Price Filter
In this script, the Kalman For Loop applies the Kalman filter to the price source (default set to the closing price) to generate a smoothed price series, which is then used to calculate signals.
Adaptive Smoothing with Process and Measurement Noise
Two key parameters govern the behavior of the Kalman filter:
Process Noise: This controls the extent to which the model allows for uncertainty in price changes. A lower process noise value will make the filter smoother but slower to react to price changes, while a higher value makes it more sensitive to recent price fluctuations.
Measurement Noise: This represents the uncertainty or "noise" in the observed price data. A higher measurement noise value gives the filter more leeway to ignore short-term fluctuations, focusing on the broader trend. Lowering the measurement noise makes the filter more responsive to minor changes in price.
These settings allow traders to fine-tune the Kalman filter’s sensitivity, adjusting it to match their preferred trading style or market conditions.
For-Loop Scoring Mechanism
The Kalman FL further enhances the effectiveness of the Kalman filter by using a for-loop scoring system. This mechanism evaluates the smoothed price over a range of periods (defined by the Calculation Start and Calculation End inputs), assigning a score based on whether the current filtered price is higher or lower than previous values.
Long Signals: A long signal is generated when the for-loop score surpasses the Long Threshold (default set at 20), indicating a strong upward trend. This helps traders identify potential buying opportunities.
Short Signals: A short signal is triggered when the score crosses below the Short Threshold (default set at -10), signaling a potential downtrend or selling opportunity.
These signals are plotted on the chart, giving traders a clear visual indication of when to enter long or short positions.
Customization and Visualization Options
The Kalman For Loop comes with a range of customization options to give traders full control over how the indicator operates and is displayed on the chart:
Kalman Price Source: Choose the price data used for the Kalman filter (default is the closing price), allowing you to apply the filter to other price points like open, high, or low.
Filter Order: Set the order of the Kalman filter (default is 5), controlling how far back the filter looks in its calculations.
Process and Measurement Noise: Fine-tune the sensitivity of the Kalman filter by adjusting these noise parameters.
Signal Line Width and Colors: Customize the appearance of the signal line and the colors used to indicate long and short conditions.
Threshold Lines: Toggle the display of the long and short threshold lines on the chart for better visual clarity.
The indicator also includes the option to color the candlesticks based on the current trend direction, allowing traders to quickly identify changes in market sentiment. In addition, a background color feature further highlights the overall trend by shading the background in green for long signals and red for short signals.
Trading Applications
The Kalman For Loop is a versatile tool that can be adapted to a variety of trading strategies and markets. Some of the primary use cases include:
Trend Following: The adaptive nature of the Kalman filter helps traders identify the start of new trends with greater precision. The for-loop scoring system quantifies the strength of the trend, making it easier to stay in trades for longer when the trend remains strong.
Mean Reversion: For traders looking to capitalize on short-term reversals, the Kalman filter's ability to smooth price data makes it easier to spot when price has deviated too far from its expected path, potentially signaling a reversal.
Noise Reduction: The Kalman filter excels at filtering out short-term price noise, allowing traders to focus on the broader market movements without being distracted by minor fluctuations.
Risk Management: By providing clear long and short signals based on filtered price data, the Kalman FL helps traders manage risk by entering positions only when the trend is well-defined, reducing the chances of false signals.
Alerts and Automation
To further assist traders, the Kalman For Loop includes built-in alert conditions that notify you when a long or short signal is generated. These alerts can be configured to trigger notifications, helping you stay on top of market movements without constantly monitoring the chart.
Final Thoughts
The Kalman For Loop is a powerful and adaptive trading indicator that combines the precision of the Kalman filter with a for-loop scoring mechanism to generate reliable long and short signals. Whether you’re a trend follower or a reversal trader, this indicator offers the flexibility and accuracy needed to navigate complex markets with confidence.
As always, it’s important to backtest the indicator and adjust the settings to fit your trading style and market conditions. No indicator is perfect, and the Kalman FL should be used alongside other tools and sound risk management practices for the best results.
Order Flow / Delta Volume IndicatorOrder Flow / Delta Volume Indicator
The Order Flow / Delta Volume Indicator is designed to give traders a comprehensive view of market activity by combining delta volume analysis, order flow imbalances, and momentum filters. This indicator is not just a mashup of components, but a carefully crafted tool that enhances decision-making by integrating various layers of market analysis into one powerful system.
How the Components Work Together:
1. Delta Volume Bars: The core of this indicator, delta volume shows the difference between buy and sell orders, allowing traders to see real-time shifts in market sentiment. Green bars indicate buy-side pressure, while red bars show sell-side dominance. By visualizing this in bar form, traders can easily spot significant shifts in order flow that could signal trend changes or momentum shifts.
2. Cumulative Delta Line (Rescaled): The cumulative delta is rescaled to plot under the price candles, giving traders a clear, contextualized view of how net buyer or seller dominance is developing over time. This line helps identify potential market reversals when price moves diverge from cumulative delta trends.
3. Order Flow Imbalance Detection: Imbalances in buy and sell volumes are automatically detected using a threshold, ensuring that traders are alerted to significant market moves. These imbalances provide insight into aggressive buying or selling behavior, which is crucial for identifying points of high trading activity or potential breakout/reversal zones.
4. VWAP Filter: Volume Weighted Average Price (VWAP) is included as a filter to confirm trend direction. The VWAP ensures that buy signals are only triggered when price action is above the VWAP (indicating strength), and sell signals are triggered when price is below the VWAP (indicating weakness). This ensures that signals are not just based on volume, but also on where price is relative to a critical benchmark.
5. RSI Filter: The inclusion of the Relative Strength Index (RSI) adds a momentum check to the signals. By using RSI, traders can avoid taking trades during low-momentum periods, ensuring they only act when market conditions favor a stronger move.
6. Signal Cooldown Feature: To avoid clutter and noise from frequent signals, this indicator includes a cooldown period between signals, ensuring that traders don’t receive excessive alerts in a short timeframe. This feature prevents overtrading and helps focus on high-quality signals.
Why This Combination is Useful:
• Comprehensive Market Insight: By combining delta volume analysis with order flow imbalance detection, this indicator provides a deep understanding of market sentiment, showing not only price movement but the underlying volume dynamics driving those moves.
• Signal Accuracy: The VWAP and RSI filters ensure that signals are only generated in strong market conditions, filtering out weak or false signals that often occur in choppy markets.
• Divergence Detection: The cumulative delta line provides traders with a tool for spotting divergences between price action and underlying volume, allowing for earlier detection of potential reversals.
This indicator is more than a simple combination of existing tools—it’s a strategic fusion of volume analysis, order flow, and momentum filters designed to provide traders with a clearer view of market activity and to generate more reliable buy/sell signals.
This description explains how the components work together and highlights the indicator’s usefulness, which should address TradingView’s concerns about originality and purpose.

Leonid's Bitcoin Sharpe RatioThe Sharpe ratio is an old formula used to value the risk-adjusted return of an asset. It was developed by Nobel Laureate William F. Sharpe. In this case, I have applied it to Bitcoin with an adjustable look-back date.
The Sharpe Ratio shows you the average return earned after subtracting out the risk-free rate per unit of volatility (I've defaulted this to 0.02 ).
Volatility is a measure of the price fluctuations of an asset or portfolio. Subtracting the risk-free rate from the mean return allows you to understand what the extra returns are for taking the risk.
If the indicator is flashing red, Bitcoin is temporarily overbought (expensive).
If the indicator is flashing green, Bitcoin is temporarily oversold (cheap).
The goal of this indicator is to signal out local tops & bottoms. It can be adjusted as far as the lookback time but I have found 25-26 days to be ideal.

Dynamic Volume RSI (DVRSI) [QuantAlgo]Introducing the Dynamic Volume RSI (DVRSI) by QuantAlgo 📈✨
Elevate your trading and investing strategies with the Dynamic Volume RSI (DVRSI) , a powerful tool designed to provide clear insights into market momentum and trend shifts. This indicator is ideal for traders and investors who want to stay ahead of the curve by using volume-responsive calculations and adaptive smoothing techniques to enhance signal clarity and reliability.
🌟 Key Features:
🛠 Customizable RSI Settings: Tailor the indicator to your strategy by adjusting the RSI length and price source. Whether you’re focused on short-term trades or long-term investments, DVRSI adapts to your needs.
🌊 Adaptive Smoothing: Enable adaptive smoothing to filter out market noise and ensure cleaner signals in volatile or choppy market conditions.
🎨 Dynamic Color-Coding: Easily identify bullish and bearish trends with color-coded candles and RSI plots, offering clear visual cues to track market direction.
⚖️ Volume-Responsive Adjustments: The DVRSI reacts to volume changes, giving greater significance to high-volume price moves and improving the accuracy of trend detection.
🔔 Custom Alerts: Stay informed with alerts for key RSI crossovers and trend changes, allowing you to act quickly on emerging opportunities.
📈 How to Use:
✅ Add the Indicator: Set up the DVRSI by adding it to your chart and customizing the RSI length, price source, and smoothing options to fit your specific strategy.
👀 Monitor Visual Cues: Watch for trend shifts through the color-coded plot and candles, signaling changes in momentum as the RSI crosses key levels.
🔔 Set Alerts: Configure alerts for critical RSI crossovers, such as the 50 line, ensuring you stay on top of potential market reversals and opportunities.
🔍 How It Works:
The Dynamic Volume RSI (DVRSI) is a unique indicator designed to provide more accurate and responsive signals by incorporating both price movement and volume sensitivity into the RSI framework. It begins by calculating the traditional RSI values based on a user-defined length and price source, but unlike standard RSI tools, the DVRSI applies volume-weighted adjustments to reflect the strength of market participation.
The indicator dynamically adjusts its sensitivity by factoring in volume to the RSI calculation, which means that price moves backed by higher volumes carry more weight, making the signal more reliable. This method helps identify stronger trends and reduces the risk of false signals in low-volume environments. To further enhance accuracy, the DVRSI offers an adaptive smoothing option that allows users to reduce noise during periods of market volatility. This adaptive smoothing function responds to market conditions, providing a cleaner signal by reducing erratic movements or price spikes that could lead to misleading signals.
Additionally, the DVRSI uses dynamic color-coding to visually represent the strength of bullish or bearish trends. The candles and RSI plots change color based on the RSI values crossing critical thresholds, such as the 50 level, offering an intuitive way to recognize trend shifts. Traders can also configure alerts for specific RSI crossovers (e.g., above 50 or below 40), ensuring that they stay informed of potential trend reversals and significant market shifts in real-time.
The combination of volume sensitivity, adaptive smoothing, and dynamic trend visualization makes the DVRSI a robust and versatile tool for traders and investors looking to fine-tune their market analysis. By incorporating both price and volume data, this indicator delivers more precise signals, helping users make informed decisions with greater confidence.
Disclaimer:
The Dynamic Volume RSI is designed to enhance your market analysis but should not be used as a sole decision-making tool. Always consider multiple factors before making any trading or investment decisions. Past performance is not indicative of future results.

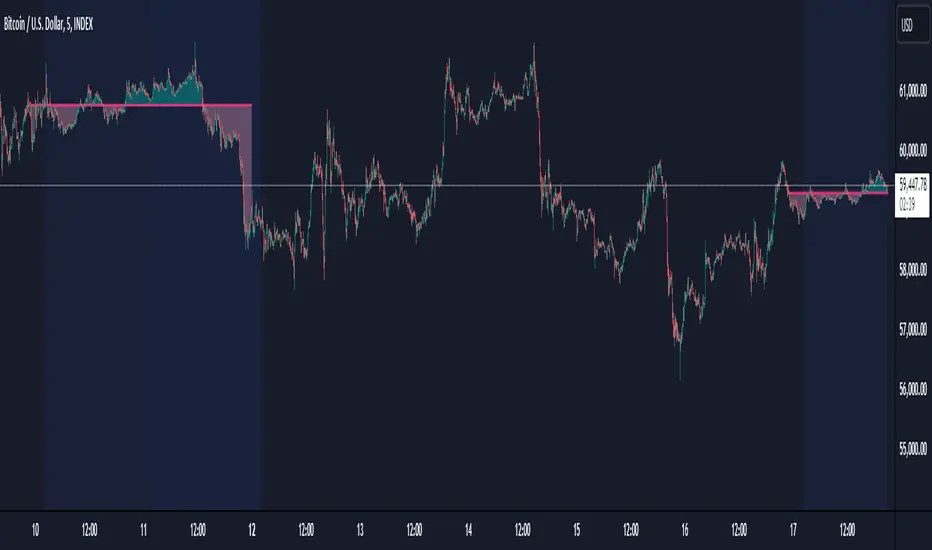
ATR+Order Block IndicatorThe ATR+Order Block Indicator is a unique and comprehensive tool designed to combine volatility-based analysis with key price action levels to provide traders with reliable entry and exit points. This indicator merges the Average True Range (ATR) for dynamic trailing stop calculation with order block detection to identify significant support and resistance zones on the chart. This combination offers traders a powerful blend of trend-following and price level analysis for improved trading decisions.
How the Components Work Together:
1. ATR-Based Trailing Stop:
• The Average True Range (ATR) is a widely used volatility indicator that measures the degree of price movement over a specified period. In this indicator, the ATR is used to create a trailing stop that dynamically adjusts to market conditions.
• How It Works: The ATR value is multiplied by a user-defined multiplier (ATR Multiplier) to set the distance of the trailing stop from the current price. This trailing stop moves with the price:
• If the price moves upwards, the trailing stop adjusts higher, ensuring it only moves in the direction of the trade.
• If the price moves downwards, the trailing stop adjusts lower accordingly.
• Purpose: This trailing stop helps traders manage risk by automatically adjusting to market volatility, ensuring that stops are not too tight in volatile conditions or too wide in quieter markets. It also helps lock in profits while maintaining a position in the market’s direction.
2. Order Block Detection:
• Order blocks are areas on the chart where significant buying (accumulation) or selling (distribution) has occurred. These zones often act as potential support or resistance levels due to the presence of unfilled buy or sell orders by large institutions or traders.
• How It Works: The indicator identifies the highest high (seller order block) and the lowest low (buyer order block) within a user-defined lookback period. These are plotted on the chart:
• Buyer Order Block: Represents a potential support area where buying interest is likely to reappear.
• Seller Order Block: Represents a potential resistance area where selling interest may reemerge.
• Purpose: By identifying these order blocks, traders can anticipate potential price reversals or continuations, aligning their trades with key market levels where significant buying or selling has occurred.
Justification for Combining These Components:
1. Enhanced Signal Accuracy and Context:
• The combination of ATR-based trailing stops with order block detection provides a dual-layered approach to trade decisions:
• ATR Trailing Stop offers trend-following signals based on volatility, helping traders capture market momentum.
• Order Blocks provide context to these signals by highlighting critical price levels where market participants have previously shown strong interest.
• This fusion allows traders to filter signals more effectively, ensuring trades are aligned with both market trends and key support/resistance zones.
2. Dynamic Risk Management:
• Using the ATR to set a dynamic trailing stop ensures that the stop-loss level adapts to the changing volatility of the market. When combined with order block detection, traders gain an additional layer of risk management:
• Stop Loss Placement: Traders can place stops just outside identified order blocks to protect against sudden price reversals while maintaining a tight stop aligned with current market volatility.
3. Reducing Market Noise and Avoiding False Signals:
• The indicator includes a mechanism to avoid repetitive signals, requiring a minimum gap between signals. This reduces noise and helps traders avoid multiple false entries in choppy market conditions.
• Order Blocks provide additional validation: For example, a buy signal generated near a Buyer Order Block carries more weight, as it aligns both with the ATR-based momentum and a key support area.
4. Improving Entry and Exit Strategies:
• Entry Points: The indicator generates buy (long) signals when the price crosses above the ATR trailing stop and sell (short) signals when it crosses below. These signals are enhanced by considering their proximity to order blocks, ensuring trades are initiated at strategic price levels.
• Exit Points: The ATR trailing stop provides a dynamic exit strategy, allowing trades to run while adjusting to market volatility. Traders can also use order blocks as targets or potential reversal points to exit trades.
5. Providing a Comprehensive Trading Tool:
• This indicator is unique in its integration of volatility and price level analysis, offering a well-rounded approach to trading. It combines the best of both worlds: trend-following momentum with the ATR and price action sensitivity through order blocks, making it suitable for different market conditions and trading styles.
How to Use the Indicator:
• Set the Parameters:
• Choose an ATR Period (default is 10) to define the number of bars for ATR calculation.
• Set the ATR Multiplier (default is 1.5) to adjust the sensitivity of the trailing stop.
• Define the Order Block Lookback Period (default is 20) to determine how many bars back the script will search for order blocks. Recommended 50.
• Interpret the Signals:
• BUY Signal: When the price crosses above the ATR trailing stop, indicating upward momentum. Confirm this signal by checking if it is near a Buyer Order Block.
• SELL Signal: When the price crosses below the ATR trailing stop, indicating downward momentum. Look for proximity to a Seller Order Block for added confidence.
• Monitor and Manage Trades:
• Use the ATR trailing stop for dynamic stop-loss placement.
• Watch for price action around the order blocks to make informed decisions about taking profits or cutting losses.
Conclusion:
The ATR+Order Block Indicator combines volatility and price action analysis in a unique way that offers traders a comprehensive tool for making informed trading decisions. By leveraging the strengths of both ATR-based dynamic stops and order block detection, it provides a balanced approach to trend-following and support/resistance trading, enhancing overall trading effectiveness and confidence.

Bitcoin PivotFind [BTC Cycle Tops & Bottoms Finder]What is PivotFind?
PivotFind is a custom indicator designed to track 30+ data points of different nature (technical, sentiment, macro, on-chain), and across multiple timeframes (from 1D to 60D), to detect the market conditions that may indicate the formation of potential Cycle Tops and Bottoms .
PivotFind's goal is to help you navigate Bitcoin's price movements and key happenings over its approximately 4-year cycles to help you craft a mid-term investment plan focused on the larger swings, rather than the shorter-term fluctuations.
What Does PivotFind Show/Do?
Market Phase Assessment and Visualization:
- Uses color-coded backgrounds (green for bull, red for bear, yellow for trend reversal) to show the current (assessed) market phase. Note that the price line itself changes color to reinforce the current phase identification.
- Helps you understand if we're in a uptrend, downtrend, or potentially changing direction (reversal), often an open question for traders, with a mid-term horizon
Cycle Top and Bottom Warnings:
- Places red dots above the price line to warn of potential cycle peaks.
- Shows green dots below the price line to indicate possible cycle bottoms.
These markers appear when multiple indicators reach certain thresholds, which historically have often coincided with significant market pivots (from bull to bear, or viceversa). Clusters of tops and bottom warnings are expected to appear at truly pivotal moments.
Parabolic Growth Signals:
- Displays upward arrows when conditions suggest potential for the rapid price increases that historically anticipated blow-off tops
- These signals are based on a combination of technical indicators and market sentiment reaching certain thresholds.
Altcoin Season Indicators:
- Marks with white diamonds the conditions that have historically led to "altseasons" (i.e. Altcoins overperforming BTC's growth rate).
- Based on factors like Bitcoin dominance decrease and certain altcoin performance metrics.
Fibonacci Retracement Bands:
Plots long-term support and resistance zones based on Fibonacci retracement levels.
These bands are calculated from previous major market highs and lows and shed light on the nature of short-term retracements in the context of major trends.
Price Scenario
PivotFind also provides reference price levels for the upcoming halving cycle, including potential thresholds for increased market interest (retail FOMO), possible overvaluation, and theoretical cycle peak ranges. These projections are based on historical data and should be considered as points of reference rather than definitive predictions.
Comprehensive Data Tables:
Right-side Table: Shows current cycle stage, Bitcoin/Altcoin market dominance percentages, and evaluates key economic factors (like inflation and interest rates) for their potential impact.
Bottom Table: Displays real-time values of over 30 key indicators, including RSI, MVRV ratio, and Fear & Greed Index.
Alerts
PivotFind offers you the ability to set up custom alerts (via the standard TradingView alert functionality) or receive automated notifications for significant market events. Despite its sophisticated analysis, PivotFind is designed to be user-friendly, with pre-set parameters that don't require complex adjustments.
How Does It Work?
PivotFind analyzes over 30 different indicators across multiple timeframes (from 1 day to 60 days), grouped into four main categories:
1. Technical Analysis:
Uses standard indicators like RSI, Stochastic RSI, Williams %R, Elliot Oscillator, TDI, and mean reversion concepts.
Looks for divergences between price and multiple indicators (like OBV, MFI, CCI, RSI, SRSI, MACD and others) to spot potential reversals.
2. Market Sentiment:
Incorporates the Crypto Fear & Greed Index (0-100 scale).
Tracks social media trends and influencer follower counts as a gauge of public interest.
3. Macroeconomic Factors:
Monitors inflation rates, interest rates, US rate yields, and money supply (M2) figures.
Tracks the U.S. Dollar Index (DXY) and bond market health through ETFs like TLT and HYG.
4. On-Chain Analytics:
Analyzes MVRV (Market Value to Realized Value) ratio to spot potential over/undervaluation.
Examines NUPL (Net Unrealized Profit/Loss) and active Bitcoin addresses.
PivotFind analyzes these indicators collectively, looking for significant correlations and confluences, to provide a view of the market's position within the 4-year cycle and spot the conditions for potential Cycle tops and bottoms (cycle pivots).
Who Is This For?
PivotFind may be particularly useful for:
- Long-term investors looking to optimize entry and exit points within the 4-year cycle
- Individuals who want to understand mid-term trends without engaging in daily analysis of multiple charts (due to lack of time and/or financial knowledge)
- Bitcoin Holders and miners planning their decisions around critical market pivot points
It's less suitable for scalpers, day-traders or those focused on short-term price movements.
Value Proposition
PivotFind simplifies market analysis by bringing together a wide range of indicators and data sources across different timeframes. It uses built-in logic to interpret these inputs within the context of Bitcoin's cycles, giving users an efficient way to spot potential major market shifts. This all-in-one approach helps make sense of complex market conditions and supports more informed decision-making.
Since Bitcoin’s broader cycle strongly influences the entire crypto market, PivotFind can also be useful for investors who are focused on Altcoins, not just Bitcoin.
Important Note (Disclaimer)
Past performance, and patterns, do not guarantee future results. Therefore, PivotFind should be used as one of many tools in your analysis. While the indicator provides a multi-faceted and multi-timeframe analysis of factors historically correlated with pivotal price shifts, it cannot predict future prices with certainty. It's a tool to help inform your decisions, not make them for you. Always conduct your own research and remember that all investments, especially in cryptocurrencies, involve risk.
Recommended Settings
PivotFinds works best on the 1D INDEX:BTCUSD chart (dark-mode, logarithmic scale).
This indicator is not publicly available and requires special access.

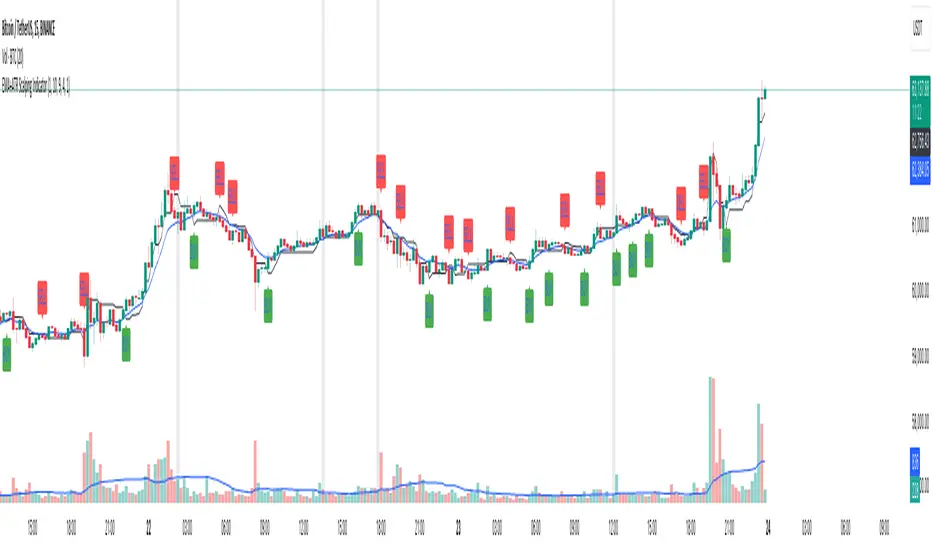
EMA+ATR Scalping Indicator by TradeTechIndicator Description: “EMA+ATR Scalping Indicator by Tradetech”
The “EMA+ATR Scalping Indicator” is a powerful tool designed to help traders identify optimal entry and exit points in the market, focusing on high-probability scalping opportunities. This indicator combines the strength of the Exponential Moving Average (EMA) with the Average True Range (ATR) to generate precise signals, aiming to maximize profits while minimizing risk.
Key Features:
• Sensitivity Key Value: Allows customization of the ATR multiplier, fine-tuning the trailing stop level for different market conditions.
• ATR Calculation: Measures market volatility over a specified period, dynamically adjusting the trailing stop to capture significant price moves while reducing noise.
• EMA for Confirmation: The 20-period EMA is used as a trend filter, ensuring that trades are aligned with the prevailing market direction.
• Trade Cooldown Period: Prevents over-trading by enforcing a minimum number of bars between consecutive trades, reducing the likelihood of whipsaws.
• Flat ATR Threshold: Identifies periods of low volatility (flat ATR), during which trading is avoided to protect against false signals.
Trading Logic:
• Entry Signals: The indicator generates long signals when the price crosses above the ATR trailing stop or breaks out consecutively in an uptrend, with the EMA confirming the bullish trend. Short signals are generated when the price crosses below the ATR trailing stop or consecutively breaks out in a downtrend, with the EMA confirming the bearish trend.
• Exit Signals: The exit points are defined by the ATR trailing stop, which adjusts dynamically with market conditions, ensuring that profits are locked in as the trend evolves.
• No Trading Zone: When the ATR is flat, indicating low volatility, the indicator displays a “No Trading Zone” to prevent taking positions in uncertain market conditions.
Why Combine EMA + ATR?
The combination of EMA and ATR in this indicator is crucial for several reasons:
1. Trend Identification (EMA): The EMA acts as a reliable trend filter, ensuring that trades are taken in the direction of the prevailing trend. By doing so, the indicator avoids taking trades against the momentum, which could result in lower probability setups.
2. Volatility-Based Trailing Stop (ATR): The ATR provides a volatility-adjusted stop-loss level, which is essential in scalping strategies where market conditions can change rapidly. This allows the trailing stop to widen during periods of high volatility and tighten during low volatility, optimizing the trade management process.
3. Enhanced Accuracy: By combining the EMA and ATR, the indicator filters out noise and avoids entering trades during flat market conditions, where the probability of false signals is higher. This synergy between trend and volatility creates a more robust and accurate scalping tool.
4. Dynamic Trade Management: The use of ATR for setting trailing stops ensures that the trade exits are dynamic and adaptable to current market conditions, maximizing the potential for capturing significant moves while minimizing drawdowns.
Overall, the EMA + ATR combination within the “EMA+ATR Scalping Indicator” provides a well-rounded approach to scalping, balancing trend-following with volatility management for more consistent trading results.
Combined Bitcoin CME Gaps and Weekend DaysScript Description: Combined Bitcoin CME Gaps and Weekend Days
Author: NeoButane (Bitcoin CME Gaps), JohnIsTrading (Day of Week),
Contributor : MikeTheRuleTA (Combined and optimizations)
This Pine Script indicator provides a combined view of Bitcoin CME gaps and customizable weekend day backgrounds on your chart. It’s designed to help traders visualize CME gaps along with customizable weekend day highlights.
Features:
CME Gaps Visualization:
Enable CME Gaps: Toggle the display of CME gaps on your chart.
Show Real vs. CME Price: Choose whether to display chart prices or CME prices for gap analysis.
Weekend Gaps Only: Filter to show only weekend gaps for a cleaner view (note: this may miss holidays).
CME Gaps Styling:
Weekend Background Highlighting:
Enable Weekend Background: Toggle the weekend day background highlight on or off.
Timezone Selection: Choose the relevant timezone for accurate weekend highlighting.
Customizable Weekend Colors: Define colors for Saturday and Sunday backgrounds.
How It Works:
CME Gaps: The script identifies gaps between CME and chart prices when the CME session is closed. It plots these gaps with customizable colors and line widths.
You can choose to see gaps based on CME prices or chart prices and decide whether to include only weekends.
Weekend Backgrounds: The script allows for background highlighting of weekends (Saturday and Sunday) on your chart. This can be enabled or disabled and customized with specific colors.
The timezone setting ensures that the background highlights match your local time settings.
Inputs:
CME Gaps Settings:
Enable CME Gaps
Show Real vs. CME Price
Only Show Weekend Gaps
CME Gaps Style:
Gap Fill Color Up
Gap Fill Color Down
Gap Fill Transparency
Weekend Settings:
Enable Weekend Background
Timezone
Enable Saturday
Saturday Color
Enable Sunday
Sunday Color
Usage:
Add this script to your TradingView chart to overlay CME gaps and weekend highlights.
Adjust the settings according to your preferences for a clearer view of gaps and customized weekend backgrounds.
This indicator provides a comprehensive tool for tracking CME gaps and understanding weekend market behaviors through visual enhancements on your trading charts.
BTC Coinbase PremiumThis script is designed to compare the price of Bitcoin on two major exchanges: Coinbase and Binance. It helps you see if there’s a difference in the price of Bitcoin between these two exchanges, which is known as a “premium” or “discount.”
Here’s how it works in simple terms:
Getting the Prices:
The script first fetches the current price of Bitcoin from Coinbase and Binance. It looks at the closing price, which is the price at the end of the selected time period on your chart.
Calculating the Difference:
It then calculates the difference between these two prices. If Bitcoin is more expensive on Coinbase than on Binance, this difference will be positive, indicating a “premium.” If it’s cheaper on Coinbase, the difference will be negative, indicating a “discount.”
Visualizing the Difference:
The script creates a visual chart that shows this price difference over time. It uses green bars to show when there’s a premium (Coinbase is more expensive) and red bars to show when there’s a discount (Coinbase is cheaper).
Optional Table Display:
If you choose to, the script can also show this price difference in a small table at the top right corner of your chart. The table displays the words “Coinbase Premium” and the exact dollar amount of the premium or discount.
Why does it matter?
Traders and investors have spotted a correlation between bullish strength on BTC and a strong Coinbase premium along with the inverse of a strong Coinbase discount and BTC price weakness.

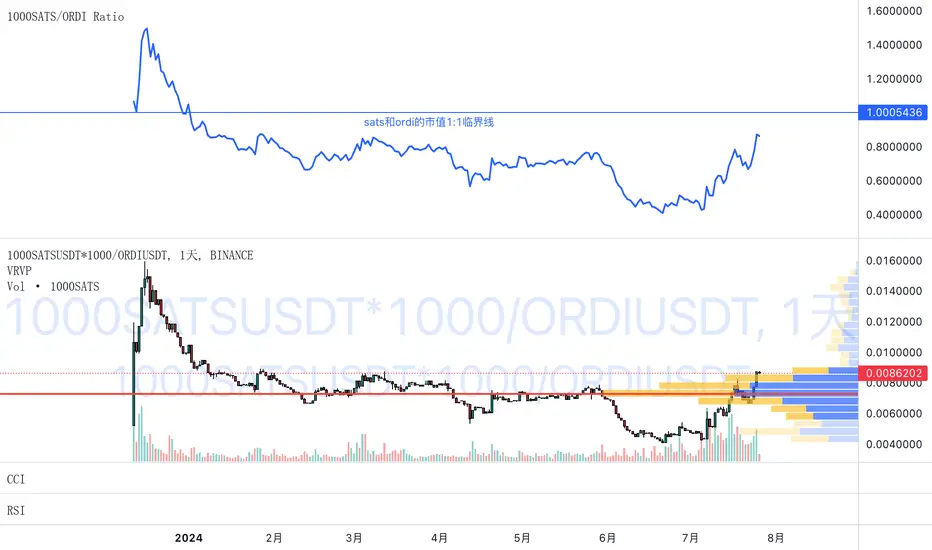
1000SATS and ORDI Market Cap RatioSure! Here is a detailed description and usage guide for your TradingView indicator:
### Indicator Description
**Title**: 1000SATS/ORDI Market Cap Ratio
**Description**: The "1000SATS/ORDI Market Cap Ratio" indicator calculates and visualizes the market capitalization ratio between 1000SATS and ORDI. This indicator allows traders and investors to analyze the relative market strength and valuation trends of 1000SATS compared to ORDI over time. By tracking this ratio, users can gain insights into market dynamics and potential trading opportunities between these two assets.
### Indicator Usage
**Purpose**:
- To compare the market capitalizations of 1000SATS and ORDI.
- To identify potential undervaluation or overvaluation of 1000SATS relative to ORDI.
- To assist in making informed trading and investment decisions based on market cap trends.
**How to Use**:
1. **Add the Indicator to Your Chart**:
- Open TradingView and navigate to your chart.
- Click on the "Indicators" button at the top of the chart.
- Select "Pine Editor" and paste the provided script.
- Click "Add to Chart" to apply the indicator.
2. **Interpret the Ratio**:
- The indicator will plot a line representing the ratio of the market capitalization of 1000SATS to ORDI.
- A rising ratio indicates that the market cap of 1000SATS is increasing relative to ORDI, suggesting stronger market performance or higher valuation of 1000SATS.
- A falling ratio indicates that the market cap of 1000SATS is decreasing relative to ORDI, suggesting weaker market performance or lower valuation of 1000SATS.
3. **Analyze Trends**:
- Use the indicator to spot trends and potential reversal points in the market cap ratio.
- Combine the ratio analysis with other technical indicators and chart patterns to enhance your trading strategy.
4. **Set Alerts**:
- Set custom alerts on the ratio to notify you of significant changes or specific thresholds being reached, enabling timely decision-making.
**Example**:
- If the ratio is consistently rising, it may indicate a good opportunity to consider 1000SATS as a stronger investment relative to ORDI.
- Conversely, if the ratio is falling, it may be a signal to reevaluate the strength of 1000SATS compared to ORDI.
**Note**: Always conduct thorough analysis and consider other market factors before making trading decisions based on this indicator.
### Script
```pinescript
//@version=4
study("1000SATS and ORDI Market Cap Ratio", shorttitle="1000SATS/ORDI Ratio", overlay=true)
// Define the circulating supply for ORDI and 1000SATS
ORDI_supply = 21000000 // Circulating supply of ORDI
SATS_1000_supply = 2100000000000 // Circulating supply of 1000SATS
// Fetch the price data for ORDI
ordi_price = security("BINANCE:ORDIUSDT", timeframe.period, close)
// Fetch the price data for 1000SATS
sats_1000_price = security("BINANCE:1000SATSUSDT", timeframe.period, close)
// Calculate the market capitalizations
ordi_market_cap = ordi_price * ORDI_supply
sats_1000_market_cap = sats_1000_price * SATS_1000_supply
// Calculate the market cap ratio
ratio = sats_1000_market_cap / ordi_market_cap
// Plot the ratio
plot(ratio, title="1000SATS/ORDI Market Cap Ratio", color=color.blue, linewidth=2)
```
This description and usage guide should help users understand the purpose and functionality of your indicator, as well as how to effectively apply it in their trading activities on TradingView.
SOL & BTC EMA with BTC/SOL Price Difference % and BTC Dom EMAThis script is designed to provide traders with a comprehensive analysis of Solana (SOL) and Bitcoin (BTC) by incorporating Exponential Moving Averages (EMAs) and price difference percentages. It also includes the BTC Dominance EMA to offer insights into the overall market dominance of Bitcoin.
Features:
SOL EMA: Plots the Exponential Moving Average (EMA) for Solana (SOL) based on a customizable period length.
BTC EMA: Plots the Exponential Moving Average (EMA) for Bitcoin (BTC) based on a customizable period length.
BTC Dominance EMA: Plots the Exponential Moving Average (EMA) for BTC Dominance, which helps in understanding Bitcoin's market share relative to other cryptocurrencies.
BTC/SOL Price Difference %: Calculates and plots the percentage difference between BTC and SOL prices, adjusted for their respective EMAs. This helps in identifying relative strength or weakness between the two assets.
Background Highlight: Colors the background to visually indicate whether the BTC/SOL price difference percentage is positive (green) or negative (red), aiding in quick decision-making.
Inputs:
SOL Ticker: Symbol for Solana (default: BINANCE
).
BTC Ticker: Symbol for Bitcoin (default: BINANCE
).
BTC Dominance Ticker: Symbol for Bitcoin Dominance (default: CRYPTOCAP
.D).
EMA Length: The length of the EMA (default: 20 periods).
Usage:
This script is intended for traders looking to analyze the relationship between SOL and BTC, using EMAs to smooth out price data and highlight trends. The BTC/SOL price difference percentage can help traders identify potential trading opportunities based on the relative movements of SOL and BTC.
Note: Leverage trading involves significant risk and may not be suitable for all investors. Ensure you have a good understanding of the market conditions and employ proper risk management techniques.

Buy Sell Trend MonitorDescription
The purpose of this indicator is to create symbols that try to show the most accurate positions possible for trading. The formation of BUY/SELL symbols is based on the intersection of SYMBOL(Himself), BTC.D, BTC and DXY indices. The resulting signals take values between 0 and 16. These values represent the strength of the signal, and the higher its numerical value, the stronger the signal. Here, 2 different calculation methods are followed for BTC and Altcoins. In BTC, calculations are made according to the direction of BTC Market value and DXY averages, while in Altcoins, calculations are made according to the direction of BTC, BTC.D and DXY averages. If DXY for BTC is trending downwards and the BTC market value is trending upwards, the BUY symbol is formed depending on the level at which the trend occurs. For altcoins, if DXY is trending down, BTC is trending up and BTC.D is trending down, the BUY symbol is formed depending on the level at which the trend occurs. For the SELL signal, the opposite is true.
Symbols are drawn according to standard ticker and OHLC4 values.
The averages of the 1-length RSI value of these symbols are taken as the 6-length SMA.
Symbols
The symbols are explained one by one below.
Orange Line: Bitcoin Marketcap line.
White Line: DXY line.
Red Line: Bitcoin Dominance line.
Aqua Line: Current Symbol line.
Best Use
This indicator should be used for SPOT trades. Regardless, since it is not possible to know exactly the direction of the market, it should be considered to buy gradually at buy signals and sell gradually at sell signals.
It should be followed for at least a 4-hour period. We do not recommend its use as the margin of error will increase in shorter time periods.
Since the signals are not guaranteed to work 100%, we do not recommend you to trade with all your money.
No Repainting
Repainting is definitely not done. After the symbols appear, the closing should be expected. Once the closing occurs, the symbol will now be permanent.
Disclaimer
This indicator is for informational purposes only and should be used for educational purposes only. You may lose money if you rely on this to trade without additional information. Use at your own risk.
Version
v1.0

Bitcoin Puell Multiple (BPM)The Bitcoin Puell Multiple is a key indicator for evaluating buying and selling opportunities based on the profitability of Bitcoin miners.
The Idea
The Bitcoin Puell Multiple is a ratio that measures the daily profitability of Bitcoin miners in relation to the historical annual average of this profitability. It is calculated by dividing the amount of newly issued Bitcoins (in USD) each day by the 365-day moving average of that same amount. This indicator provides valuable information on Bitcoin's market cycles, helping investors to identify periods when Bitcoin is potentially undervalued or overvalued.
How to Use
To use the Bitcoin Puell Multiple, investors watch for extreme levels of the indicator. A high Puell Multiple suggests that miners are making exceptionally high profits compared to the previous year, which could indicate an overvaluation of Bitcoin and a selling opportunity (red zones). Conversely, a low Puell Multiple indicates that miners' earnings are low relative to history, suggesting an undervaluation of Bitcoin and a potential buying opportunity (green zones). The trigger thresholds for these zones can be configured in the tool's parameters.
What makes this tool different from the other "Puell Multiple" scripts available is that it is up to date in terms of its data sources, with a more precise calculation, and allows you to view the entire history.
Zone trigger limits and their visualization, as well as colors, are all configurable via the tool parameters.
Here, for example, is a configuration with more sensitive trigger levels and a different color:

Bitcoin Trend Indicator█ Overview
The Trend Indicator script is designed to help traders identify the direction and strength of momentum in the price of a digital asset. By using historical price data, it calculates and provides daily signals indicating whether the asset is in an uptrend, downtrend, or no trend at all. The script can be applied to various cryptocurrencies, such as Bitcoin and Ether, using their respective price charts.
█ Key Concepts and Calculation Methodology
For calculations, the script uses the 180 most recent candles.
The Trend Indicator is calculated based on four moving average pairs (MAPs), which compare shorter-term and longer-term moving averages of the asset's price.
The moving averages are exponentially weighted, meaning more recent prices have a greater impact on the average than older prices. The half-life of the moving averages determines the weight decay.
The script uses the following moving average pairs:
1-day vs. 5-day
2.5-day vs. 10-day
5-day vs. 20-day
10-day vs. 40-day
█ Calculation Steps
Exponentially Weighted Moving Averages (EWMA):
Each moving average is calculated using an exponential decay factor and a normalization factor to adjust for the fixed window of 180 observations.
Component Inputs:
For each moving average pair, the script compares the shorter-term moving average to the longer-term moving average. If the shorter-term average is greater than or equal to the longer-term average, the component input is +1 (indicating an uptrend). If it is less, the input is -1 (indicating a downtrend).
Trend Indicator Value:
The script averages the four component inputs to produce a final value ranging from -1 to +1, representing the trend's direction and strength:
+1: Significant uptrend
+0.5: Uptrend
0: No trend
-0.5: Downtrend
-1: Significant downtrend
█ Learn More
For more information about the Bitcoin Trend Indicator and other trading tools, please visit my TradingView profile. Feel free to reach out with any questions or feedback.

Bitcoin Fundamentals - Bitcoin Block RewardThe Bitcoin Block Reward is the batch of new Bitcoins generated by the miners after solving each block.
The Block Reward is set as a basic rule and cannot be changed without agreement between the entire Bitcoin network. It started at 50 BTC during the first period. Afterwards the Block Reward gets adjusted to half of it value (Halving Event) on each cycle of 210000 blocks mined.
This is the only way that new bitcoins are created. It creates an incentive for miners to secure the network.
Over time the Block Reward will decreases to a value that might not cover the mining costs. At that point, the use of the Bitcoin Network might have increased sufficiently as to generate enough transaction fees to cover the mining costs.
MOTIVATION
Even though this is a very simple indicator, I'm currently missing a data source to compute the Block Reward value within Tradingview. Therefore, I created this indicator and its associated library function to enable its visualization and (eventually) for coders to make use of the source function to power more elaborate scripts related to the Halving Events.
Hope that helps!

Intellect_city - Halvings Bitcoin CycleWhat is halving?
The halving timer shows when the next Bitcoin halving will occur, as well as the dates of past halvings. This event occurs every 210,000 blocks, which is approximately every 4 years. Halving reduces the emission reward by half. The original Bitcoin reward was 50 BTC per block found.
Why is halving necessary?
Halving allows you to maintain an algorithmically specified emission level. Anyone can verify that no more than 21 million bitcoins can be issued using this algorithm. Moreover, everyone can see how much was issued earlier, at what speed the emission is happening now, and how many bitcoins remain to be mined in the future. Even a sharp increase or decrease in mining capacity will not significantly affect this process. In this case, during the next difficulty recalculation, which occurs every 2014 blocks, the mining difficulty will be recalculated so that blocks are still found approximately once every ten minutes.
How does halving work in Bitcoin blocks?
The miner who collects the block adds a so-called coinbase transaction. This transaction has no entry, only exit with the receipt of emission coins to your address. If the miner's block wins, then the entire network will consider these coins to have been obtained through legitimate means. The maximum reward size is determined by the algorithm; the miner can specify the maximum reward size for the current period or less. If he puts the reward higher than possible, the network will reject such a block and the miner will not receive anything. After each halving, miners have to halve the reward they assign to themselves, otherwise their blocks will be rejected and will not make it to the main branch of the blockchain.
The impact of halving on the price of Bitcoin
It is believed that with constant demand, a halving of supply should double the value of the asset. In practice, the market knows when the halving will occur and prepares for this event in advance. Typically, the Bitcoin rate begins to rise about six months before the halving, and during the halving itself it does not change much. On average for past periods, the upper peak of the rate can be observed more than a year after the halving. It is almost impossible to predict future periods because, in addition to the reduction in emissions, many other factors influence the exchange rate. For example, major hacks or bankruptcies of crypto companies, the situation on the stock market, manipulation of “whales,” or changes in legislative regulation.
---------------------------------------------
Table - Past and future Bitcoin halvings:
---------------------------------------------
Date: Number of blocks: Award:
0 - 03-01-2009 - 0 block - 50 BTC
1 - 28-11-2012 - 210000 block - 25 BTC
2 - 09-07-2016 - 420000 block - 12.5 BTC
3 - 11-05-2020 - 630000 block - 6.25 BTC
4 - 20-04-2024 - 840000 block - 3.125 BTC
5 - 24-03-2028 - 1050000 block - 1.5625 BTC
6 - 26-02-2032 - 1260000 block - 0.78125 BTC
7 - 30-01-2036 - 1470000 block - 0.390625 BTC
8 - 03-01-2040 - 1680000 block - 0.1953125 BTC
9 - 07-12-2043 - 1890000 block - 0.09765625 BTC
10 - 10-11-2047 - 2100000 block - 0.04882813 BTC
11 - 14-10-2051 - 2310000 block - 0.02441406 BTC
12 - 17-09-2055 - 2520000 block - 0.01220703 BTC
13 - 21-08-2059 - 2730000 block - 0.00610352 BTC
14 - 25-07-2063 - 2940000 block - 0.00305176 BTC
15 - 28-06-2067 - 3150000 block - 0.00152588 BTC
16 - 01-06-2071 - 3360000 block - 0.00076294 BTC
17 - 05-05-2075 - 3570000 block - 0.00038147 BTC
18 - 08-04-2079 - 3780000 block - 0.00019073 BTC
19 - 12-03-2083 - 3990000 block - 0.00009537 BTC
20 - 13-02-2087 - 4200000 block - 0.00004768 BTC
21 - 17-01-2091 - 4410000 block - 0.00002384 BTC
22 - 21-12-2094 - 4620000 block - 0.00001192 BTC
23 - 24-11-2098 - 4830000 block - 0.00000596 BTC
24 - 29-10-2102 - 5040000 block - 0.00000298 BTC
25 - 02-10-2106 - 5250000 block - 0.00000149 BTC
26 - 05-09-2110 - 5460000 block - 0.00000075 BTC
27 - 09-08-2114 - 5670000 block - 0.00000037 BTC
28 - 13-07-2118 - 5880000 block - 0.00000019 BTC
29 - 16-06-2122 - 6090000 block - 0.00000009 BTC
30 - 20-05-2126 - 6300000 block - 0.00000005 BTC
31 - 23-04-2130 - 6510000 block - 0.00000002 BTC
32 - 27-03-2134 - 6720000 block - 0.00000001 BTC

CME Gap Oscillator [CryptoSea]Introducing the CME Gap Oscillator , a pioneering tool designed to illuminate the significance of market gaps through the lens of the Chicago Mercantile Exchange (CME). By leveraging gap sizes in relation to the Average True Range (ATR), this indicator offers a unique perspective on market dynamics, particularly around the critical weekly close periods.
Key Features
Gap Measurement : At its core, the CME Oscillator quantifies the size of weekend gaps in the context of the market's volatility, using the ATR to standardize this measurement.
Dynamic Levels : Incorporating a dynamic extreme level calculation, the tool adapts to current market conditions, providing real-time insights into significant gap sizes and their implications.
Band Analysis : Through the introduction of upper and lower bands, based on standard deviations, traders can visually assess the oscillator's position relative to typical market ranges.
Enhanced Insights : A built-in table tracks the frequency of the oscillator's breaches beyond these bands within the latest CME week, offering a snapshot of recent market extremities.
Settings & Customisation
ATR-Based Measurement : Choose to measure gap sizes directly or in terms of ATR for a volatility-adjusted view.
Band Period Adjustability : Tailor the oscillator's sensitivity by modifying the band calculation period.
Dynamic Level Multipliers : Adjust the multiplier for dynamic levels to suit your analysis needs.
Visual Preferences : Customise the oscillator, bands, and table visuals, including color schemes and line styles.
In the example below, it demonstrates that the CME will want to return to the 0 value, this would be considered a reset or gap fill.
Application & Strategy
Deploy the CME Oscillator to enhance your market analysis
Market Sentiment : Gauge weekend market sentiment shifts through gap analysis, refining your strategy for the week ahead.
Volatility Insights : Use the oscillator's ATR-based measurements to understand the volatility context of gaps, aiding in risk management.
Trend Identification : Identify potential trend continuations or reversals based on the frequency and magnitude of gaps exceeding dynamic levels.
The CME Oscillator stands out as a strategic tool for traders focusing on gap analysis and volatility assessment. By offering a detailed breakdown of market gaps in relation to volatility, it empowers users with actionable insights, enabling more informed trading decisions across a range of markets and timeframes.

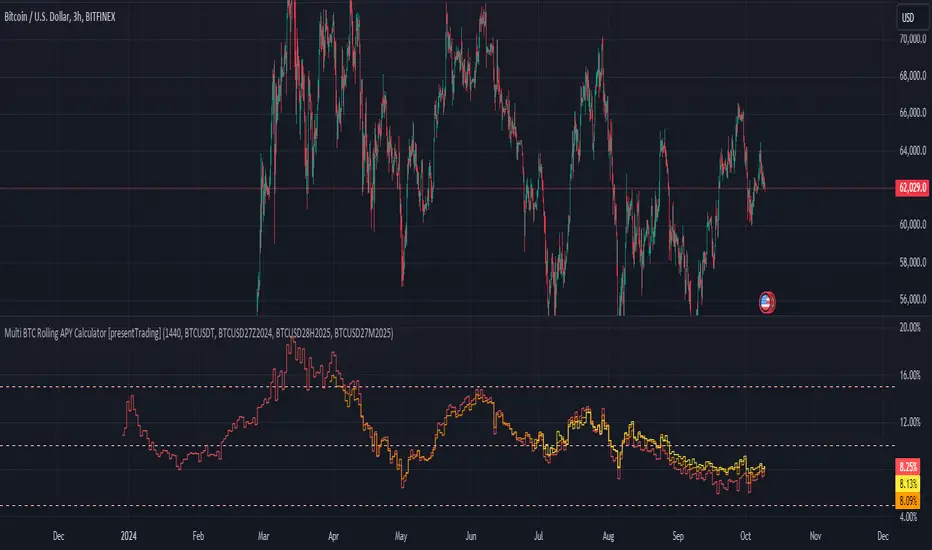
Multi BTC Rolling APY Calculator [presentTrading]█ Introduction and How it is Different
The "Multi BTC Rolling APY Calculator " is an innovative Pine Script indicator tailored for cryptocurrency traders, providing insights into arbitrage opportunities and market sentiment by calculating the Rolling Annual Percentage Yield (APY) between spot and futures prices of Bitcoin. Unlike traditional APY calculators, this tool specializes in capturing the nuances of the highly volatile and less efficient cryptocurrency markets. Rolling APY is derived from traditional market basis arbitrage but adapted to highlight significant discrepancies that frequently occur between derivative and underlying asset prices in crypto markets.
Historical backtesting has revealed that Bitcoin's Rolling APY can serve as a robust indicator of market sentiment:
- Below 0%: Often indicates panic or 'end-of-world' scenarios.
- 0-5%: Signifies extreme market fear.
- 5-10%: Reflects a calm market environment.
- 10-15%: Suggests a moderately warm market.
- 15-20%: Indicates an overheated market.
- **Above 20%: Signals FOMO (fear of missing out).
This nuanced understanding of Rolling APY helps investors not only spot arbitrage opportunities but also gauge the emotional state of the market, providing a dual function that enhances trading strategies in the volatile realm of cryptocurrencies.
█ Strategy: How It Works – Detailed Explanation
🔶 Rolling APY Calculation
The Rolling APY calculation is crucial for understanding the annualized potential returns from arbitrage strategies, given by the formula:
APY = ((Future Price - Spot Price) / Spot Price) * (365 / Days Until Expiration) * 100
This annualizes the observed premium or discount on futures contracts relative to the spot price, providing a year-over-year expectation of returns if one were to engage in arbitrage over the specified period.
🔶 Days Calculation
The accuracy of APY is contingent upon the precise calculation of days until each contract expires:
Days = (Expiration Timestamp - Current Timestamp) / 86400000
This calculation ensures the APY reflects true market dynamics for each futures contract's duration.
█ Trade Direction
While this tool does not provide direct trading signals, it informs traders about potential arbitrage opportunities and the prevailing market sentiment. Traders can leverage this data to make strategic decisions, aligning long or short positions with the anticipated market movements and arbitrage conditions.
█ Usage
By inputting specific parameters related to their market analysis, traders can monitor discrepancies in Bitcoin’s pricing across different timelines, which is especially beneficial for those involved in derivatives trading, arbitrage, and sentiment analysis.
█ Default Settings
- Resolution: Controls the frequency of data (default is daily).
- Show numbers in annual: Determines whether APY is displayed on an annual basis.
- Base Symbol and Future Symbols: Specify the spot and futures markets for analysis.
panpanXBT BTC Risk Metric OscillatorThis is the Bitcoin Risk Metric. Inspired by many power law analysts, this script assigns a risk value to the price of Bitcoin. The model uses regression of 'fair value' data to assign risk values and residual analysis to account for diminishing returns as time goes on. This indicator is for long-term investors looking to maximise their returns by highlighting periods of under and overvaluation for Bitcoin.
This is a companion script for panpanXBT BTC Risk Metric . Use this indicator in tandem to achieve the view shown in the chart above.
Please note, this indicator will only work on BTCUSD charts but will work on any timeframe.
DISCLAIMER: The product on offer presents a novel way to view the price history of Bitcoin. It should not be relied upon solely to inform financial decisions. What you do with the information is entirely up to you. Please thoroughly consider your decisions and consult many different sources to make sure you're making the most well-informed decision.
### How to Interpret
The risk scale goes from 0 to 100,
Blue - 0 being low risk, and
Red - 100 being high risk.
Low risk values represent periods of historical undervaluation, while high values represent overvaluation. These periods are marked by a colourscale from blue to red.
### Use Cases and Best Practice
A dynamic DCA strategy would work best with this indicator, whereby an amount of capital is deployed/retired on a regular basis. This amount deployed grows or shrinks depending on the proximity of the risk level to the extremes (0 and 100).
Let's say you have a maximum of $500 to deploy per month.
When risk is between 0 and 10, you could deploy the full $500.
When risk is between 10 and 20, you could deploy $400.
When risk is between 20 and 30, you could deploy $300.
When risk is between 30 and 40, you could deploy $200.
When risk is between 40 and 50, you could deploy $100.
Conversely, when risk is above 50, you could:
Sell 1/15th of your BTC stack when risk is between 50 and 60.
Sell 2/15th of your BTC stack when risk is between 60 and 70.
Sell 3/15th of your BTC stack when risk is between 70 and 80.
Sell 4/15th of your BTC stack when risk is between 80 and 90.
Sell 5/15th of your BTC stack when risk is between 90 and 100.
This framework allows the user to accumulate during periods of undervaluation and derisk during periods of overvaluation, capturing returns in the process.
In contrast, simply setting limit orders at 0 and 100 would yield the absolute maximum returns, however there is no guarantee price will reach these levels (see 2018 where the bear market bottomed out at 20 risk, or 2021 where price topped out at 97 risk).
### Caveats
"All models are wrong, some are useful"
No model is perfect. No model can predict exactly what price will do as there are too many factors at play that determine the outcome. We use models as a guide to make better-informed decisions, as opposed to shooting in the dark. This model is not a get rich quick scheme, but rather a tool to help inform decisions should you consider investing. This model serves to highlight price extremities, which could present opportune times to invest.
### Conclusion
This indicator aims to highlight periods of extreme values for Bitcoin, which may provide an edge in the market for long-term investors.
Thank you for your interest in this indicator. If you have any questions, recommendations or feedback, please leave a comment or drop me a message on TV or twitter. I aim to be as transparent as possible with this project, so please seek clarification if you are unsure about anything.
