Sigma Volatility BandsThis indicator models and displays bands of potential future price based on historic realized volatility.
This can be used for finding price target where there is no past price action.
The price bands are derived from Standard Deviations based on input bars back of historic volatility.
More Inputs:
Lookback = Number of bars considered
Forward Bars = Number of bars to project bands forward
There are two display modes:
Forward shifted envelopes = (see below) Draws bands of price from the Standard Deviation
Forward for Anchor Lines = Draws a wedge out number of bars forward
(Vibe coded. Message me for suggested updates and improvements)
Historicvolatility

Average True Range - ImprovedAverage True Range - Improved is a small variation I have made to the standard ATR indicator. It will test the current ATR against the Historic Average ATR of your preference to see if the current volatility is high or low.
Once it has determined if it is high or low it will color code the circles at the top based on this information. Green means the current volatility is low and red means the current volatility is higher than the historic average.
In the settings I have also placed a couple styles, if you wish to show the ATR and Historic ATR in percent format instead of normal you can turn them on in the style settings. If you are using the percent format I recommend setting the Precision to 2-3 decimal places.
I hope you all enjoy this indicator, if you have any questions please feel free to post them in the comments.

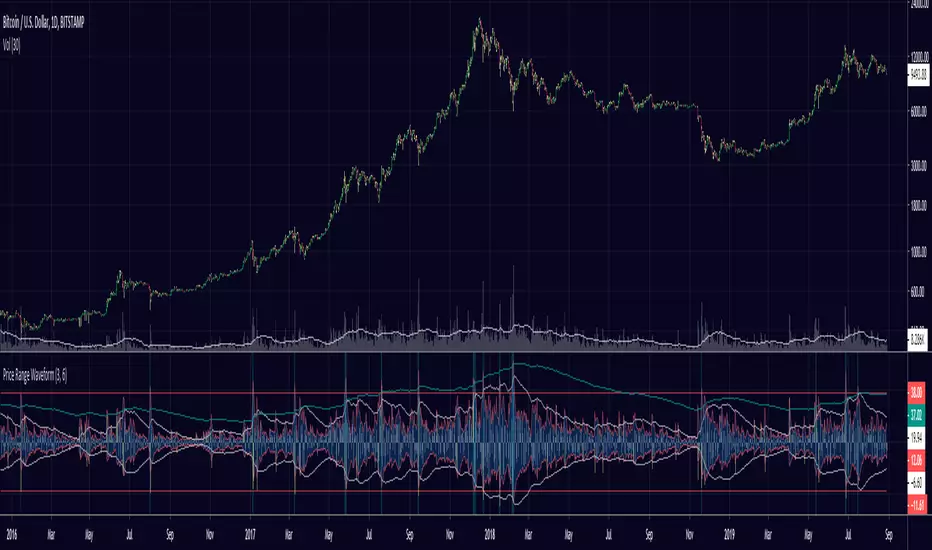
lefrog_Price Range WaveformThe Price Range Waveform calculated the difference from the open to close in percentage based.
The "Critical Range" input field lets you calibrate the zone above which a background color will be triggered.
Very useful in evaluating price expansion/contraction cycles and probable bottoms.
Works on any ticker and any timeframe.
Modification of the "Critical Range" default value may be mandatory.