Range Indicator Golden Pocket, Liquidity, FairValueGapOverview
This indicator is a comprehensive institutional market structure toolkit. It is designed to identify high-probability reversal zones by merging three powerful technical analysis concepts: Fibonacci Golden Pockets (61.8% - 65%), Liquidity Pool Analysis (Swing Failure Patterns), and Fair Value Gaps (FVG). By automating the detection of price inefficiencies and "stop runs," it helps traders navigate complex price action with objective, rule-based confirmation.
What the Script Does
The script continuously monitors a user-defined lookback period to define a trading range. Within this range, it dynamically plots:
Golden Pockets: High-confluence retracement zones (calculated as 0.35 - 0.382 internal range levels).
Liquidity Zones: Highlighted regions at the absolute high and low (Top/Bottom 5%) where institutional orders and retail stops are typically concentrated.
Swing Failure Patterns (SFP): Real-time detection of liquidity grabs where price breaches a range extreme but fails to close outside, signaling a potential trap.
Fair Value Gaps (FVG): Visualizes 3-candle price imbalances, showing areas of aggressive buying or selling that often act as future magnets or support/resistance.
2-Candle Confirmation: A momentum-based filter requiring a candle-close confirmation before a reversal signal is generated.
For Whom is it?
Smart Money Concepts (SMC) & ICT Students: Traders looking for automated liquidity sweeps and market inefficiencies.
Fibonacci & Mean Reversion Traders: Those seeking a clean, professional visualization of the Golden Pocket across multiple timeframes.
Systematic Day Traders: Who require strict price-action confirmation (SFP and 2-candle rules) to remove emotional bias from their entries.
Functions and Input Options
1. Market Structure & Visuals
Lookback Period (Default: 100): Defines the window for calculating the range extremes.
Box Offset Right (Default: 50): Extends all zones into the future for better anticipatory trading.
Show Price Lines & Labels: Displays the exact price for every zone boundary on the right axis for precise execution.
2. Fair Value Gap (FVG) Settings
Show Fair Value Gaps: A toggle to enable/disable the plotting of price imbalances.
FVG Extension (Default: 10): Determines how many bars into the future the FVG box remains visible.
Custom Colors: Separate color inputs for Bullish (Gap Up) and Bearish (Gap Down) inefficiencies.
3. Professional Alert System
The script includes five specific alert conditions:
GP Touch: Early warning when price enters a Golden Pocket.
2-Candle Pattern: Confirmed momentum shift within a Golden Pocket.
SFP Long/Short: Alerts when a Liquidity Grab (Swing Failure) is confirmed at the range high or low.
Transparency and Compliance (Moderator Info)
Non-Repainting Logic: All signals (SFP, 2-Candle, and FVG) are calculated and triggered based on confirmed candle closes. Drawings use barstate.islast purely for visual efficiency without altering historical data integrity.
Educational Context: The script visualizes well-known market principles (Fibonacci, SFPs, and FVGs) to aid traders in their analysis; it does not provide automated financial advice or "black-box" buy/sell signals.
Resource Management: Optimized for Pine Script v5, using efficient array and box handling to ensure smooth performance even on lower timeframes.
Goldenpocket

Golden Pocket Syndicate [GPS]Golden Pocket Syndicate is a multi-layered market analysis toolkit built for precision entries and sniper-style reversals in both trending and ranging conditions. The script fuses volume dynamics, golden pocket structures, market maker behavior, and liquidation cluster tracking into one high-confluence system.
Core Features:
• 📐 Golden Pocket Zones: Dynamic GP levels from daily, weekly, monthly, and yearly timeframes. These levels update in real-time and serve as confluence zones for entries and exits.
• 📊 WaveTrend Divergence Diamonds: Momentum shifts are detected using a custom filtered WaveTrend cross system to mark high-probability reversal conditions.
• 🧠 Market Maker Premium Divergence: Tracks price dislocation between CME and Binance to detect large player manipulation using a configurable premium threshold.
• 💎 MM Reversal Diamonds: Identifies potential market maker traps and large player pivots using historical candle behavior, EMA alignment, and price structure breaks.
• 📉 Stealth Liquidation Cluster Arrows: Volume-based liquidation pressure visualized as lightweight directional arrows based on calculated wick expansion and volume bursts. Highlights key zones where price is likely to bounce or reject.
• 🧭 Trend Validation: Uses volume-based trend conditions and short-term EMA positioning to further qualify signals and eliminate noise.
How to Use:
This indicator is designed to help traders visualize confluence between key institutional price levels, momentum shifts, and volume-based pressure points. Long/short opportunities can be explored at marked reversal diamonds or liquidation zones that align with key GP levels. Intended for use on higher timeframes (15m to 4H), though flexible across any pair or market.

Fibonacci Moving Average PlusFibonacci Moving Average Plus is a sophisticated technical indicator that employs the first 15 numbers of the Fibonacci sequence to create dynamic moving average channels. This indicator aims to capture both immediate and long-term price movements by calculating Exponential Moving Averages (EMAs) based on these Fibonacci values. By using Fibonacci-based moving averages for both high and low price points, the indicator generates a visual channel that reflects the ebb and flow of market trends, acting as potential zones of support and resistance. Additionally, the indicator provides midline, retracement, and extension levels rooted in Fibonacci ratios, which are frequently observed as key levels for reversals or trend continuation.
Ideology Behind Using Fibonacci Sequence-Based Moving Averages
The Fibonacci sequence, known for its mathematical harmony and prevalence in natural patterns, is widely utilized in technical analysis to identify potential turning points in markets. In this indicator, the first 15 Fibonacci numbers (5, 8, 13, 21, etc.) are used as the lookback periods for EMAs to capture different layers of market sentiment. These moving averages represent timeframes that are theoretically in alignment with the natural rhythms of market cycles, where key levels—often coinciding with Fibonacci numbers—can act as magnetic points for price.
The Fibonacci high and low channels aim to encapsulate price action, giving traders a sense of whether the market is trending, consolidating, or experiencing reversal pressure. These levels, grounded in both mathematics and market psychology, help traders spot areas where price might face resistance or find support.
Key Features
Fibonacci Moving Average High and Low: This indicator calculates the high and low EMAs based on Fibonacci sequence numbers (e.g., 5, 8, 13, etc.) for enhanced trend analysis.
Golden Pocket Retracement (GPR) and Extension (GPE) Bands: Displays common Fibonacci retracement and extension levels (0.618, 0.65 for retracement, and 1.618, 1.65 for extension).
Midline: Plots the average of the Fibonacci high and low to act as an additional reference level.
Stop-Loss Levels: Provides suggested stop-loss levels based on Fibonacci levels for both long and short positions.
Basic User Guide
Adjust Input Settings:
Input Timeframe: Set a specific timeframe for the Fibonacci moving average calculation, separate from the chart's primary timeframe.
Show Fibonacci MA High/Low: Toggle the visibility of the high and low Fibonacci moving averages.
Show Mid Line: Display a midline for added trend reference.
Show Golden Pocket Bands: Choose to display retracement or extension bands for potential support or resistance zones.
Show Stop-Loss Levels: Enable to visualize potential stop-loss levels for both long and short trades.
Interpretation:
Fibonacci MA High and Low: Use these lines to gauge the general trend. When the price is above both, it may indicate an uptrend; below both, a downtrend.
Golden Pocket Retracement: This zone (between 0.618 and 0.65) is often a key level for potential reversals or support/resistance.
Golden Pocket Extension: The 1.618 and 1.65 levels can indicate potential profit-taking or trend exhaustion points.
Stop-Loss Levels: The calculated stop-loss levels (long SL below and short SL above) can aid in risk management.
Customization:
You can customize the appearance and visibility of each component through the input settings to fit your specific strategy and visual preferences.
This indicator should be used alongside other technical analysis tools to provide a more comprehensive trading approach.
This Indicator would not exist without the original contributions and blessing from Sofien Kaabar

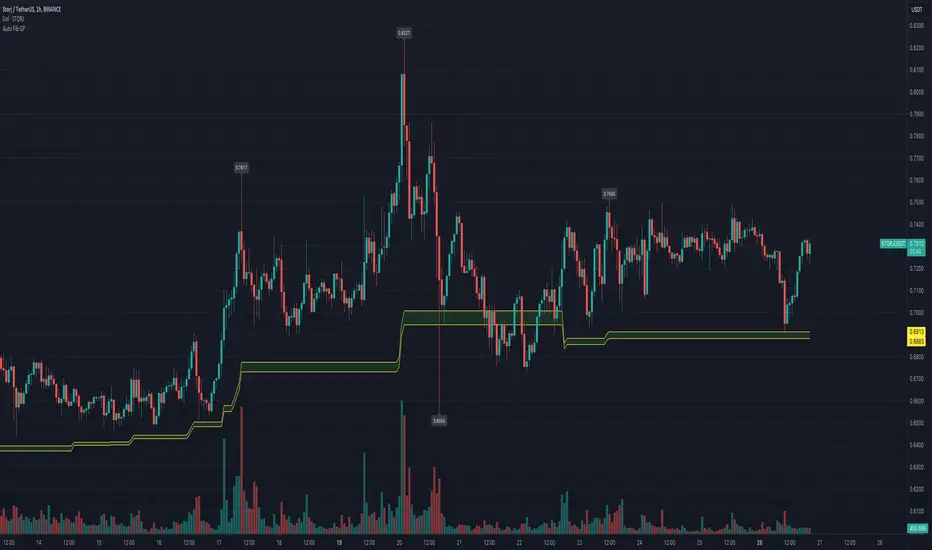
Automatic Fibonacci Retracement Golden Pocket (GP)Main info
This script automatically draws you the Fibonacci retracement level called golden pocket from the latest detected pivot point to the actual price. This level is very popular among traders because the price tends to reverse on this level pretty often. You should use this on higher timeframes 15m+.
It is good to keep in mind that this level alone is not enough, you should still have another level there to enter the trade, for example golden pocket in combination with a demand zone is pretty solid. :)
Settings
The length for pivot point calculation is available in the script settings.
You can enable inverted golden pocket (for shorts)
You can hide/show the pivot point labels
If you want any updates, just feel free to write me :)
Eagle-CrossingThis is Arcane Bears First Script Which charts your Golden Cross and Death Cross, You can update the settings as you see fit!
If you have any questions please join us at www.arcanebear.com
