Gap Detector (Body and Candle)Finds/Detects gaps between candles and candle bodies for any chart/timeframe with O(n+delta) performance.
Candle Gaps (between wicks) act as strong support or resistance. They are drawn as solid boxes.
Body Gaps (ignores wicks) act as mild support or resistance. They are depicted with lines.
Adjust the settings for candle/body gap width, smaller the time frame, smaller the gap.
Adjust max historical bars to fine tune performance on your system/setup. The more historical bars the script scans, more time required to load the chart. At times based on system configuration, TradingView may timeout the script due to too many bars. Reducing the max bars helps in this scenario.
This is a revamped version of "Body Gap Detector".
Happy charting !
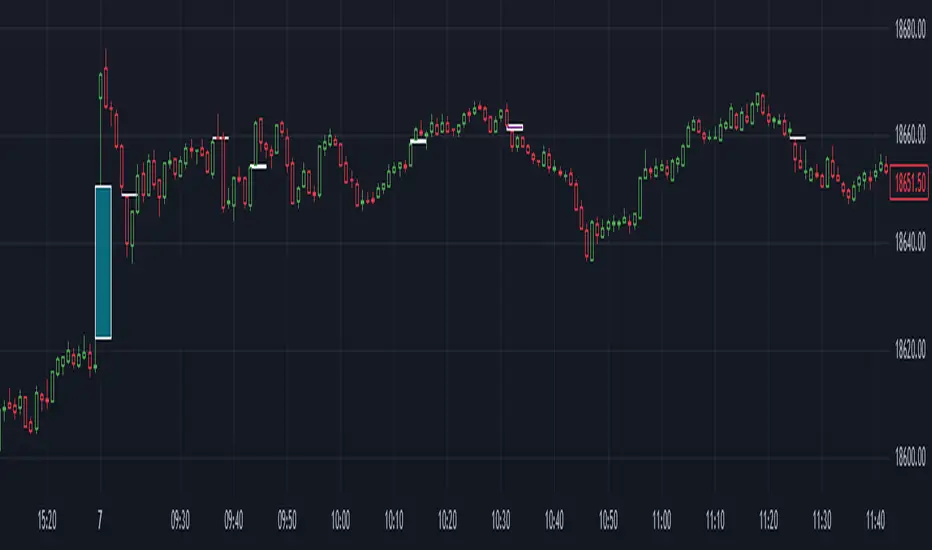
Gapup
Power Earnings Gap Screener Pro [LevelUp]Customizable Pine Screener to scan for stocks with a Power Earnings Gap as well as accelerating earnings and sales. Historical analysis shows that strong earnings often trigger institutional buying, pushing prices higher and increasing the likelihood of sustained price gains.
🔹 Power Earnings Gap (PEG)
A power earnings gap refers to a significant price gap up after an earnings report, reflecting a rapid shift in investor sentiment and perceived value. It’s called "power" because the move is often sharp, sustained, and accompanied by high trading volume, signaling a potential trend continuation or reversal.
A gap is the difference between the closing price of a stock on the day before an earnings report and the opening price the next trading day. A power earnings gap typically exceeds a certain threshold (e.g., 8-10% or more) and is driven by earnings surprises, guidance changes, or other significant news.
Strong earnings beats, misses, or forward-looking guidance can trigger these gaps. For example, a company reporting higher-than-expected profits or raising guidance might gap up, while a miss or weak outlook could cause a gap down.
The gap is often accompanied by above-average trading volume, confirming the move's strength. Power gaps often lead to sustained price movement in the direction of the gap (continuation) or signal a reversal if the gap fills quickly.
How Power Earnings Gap Be Helpful
▪ Power earnings gaps often indicate strong momentum. Traders can capitalize on this by entering trades in the direction of the gap (e.g., buying on a gap-up if the trend continues).
Example: If a stock gaps up 10% after a stellar earnings report and shows high volume, traders might buy, expecting further upside as momentum builds.
▪ Breakout Opportunities: A gap through key technical levels (e.g., resistance or support) can signal a breakout. Traders use these gaps to identify potential long-term trends.
Example: A stock breaking above a resistance level on a power earnings gap may continue to rally, offering a setup for swing or position traders.
▪ Volatility for Short-Term Trades: Earnings gaps create heightened volatility, ideal for day traders or scalpers. The large price swings allow for quick profits if timed correctly.
Example: A trader might use options (e.g., calls for a gap-up, puts for a gap-down) to leverage the volatility around earnings.
▪ Confirmation of Fundamental Strength/Weakness: A power earning gap often reflects a fundamental shift, e.g., strong earnings growth or a major business development. Traders can use this to align technical setups with fundamental catalysts.
Example: A gap-up after a company raises its full-year guidance might signal a long-term buying opportunity.
▪ Risk Management and Stop Losses: Gaps provide clear levels for setting stop-loss orders. For instance, traders might place stops at or below the gap up bar low to protect against a potential reversal.
Example: If a stock gaps up from $100 to $110 and intraday hits a low of $105, a trader might set a stop at $105 or lower to limit downside risk.
▪ Gap Fill Strategies:Some traders bet on gaps filling, i.e., the stock returning to its pre-gap price. If a power earnings gap seems overextended (e.g., due to market overreaction), contrarian traders might short a gap-up or buy a gap-down, anticipating a pullback.
Example: A stock gaps up 15% but lacks volume or follow-through; a trader might short it, expecting the price to retreat.
🔹 Earnings and Sales Acceleration
Earnings and sales acceleration refers to the rate of growth in a company's earnings over consecutive quarters. It highlights companies that are not only growing but doing so at an accelerating pace, signaling improving financial health and operational momentum. This metric is derived from earnings reports, which detail a company’s financial performance.
Key Concepts
▪ Earnings Acceleration: When a company’s earnings per share (EPS) growth rate increases over time (e.g., EPS growth of 10% in Q1, 15% in Q2, 20% in Q3). It indicates improving profitability, often due to cost efficiencies, margin expansion and strong demand.
▪ Sales Acceleration: When revenue growth rates increase over time (e.g., revenue growth of 5% in Q1, 8% in Q2, 12% in Q3). This reflects rising demand for products/services and operational efficiency.
▪ Relation to Earnings Reports: Acceleration is calculated by comparing sequential quarter-over-year growth rates in earnings and sales, often highlighted in earnings reports or analyst commentary. It’s a sign of fundamental strength when both metrics accelerate together.
How It’s Helpful to Traders
▪ Identify High-Potential Stocks: Stocks with accelerating earnings and sales often attract investor attention, as they signal a company is outperforming expectations and gaining market share. This can lead to sustained price appreciation.
Example: A tech company reporting 20% EPS growth and 15% sales growth quarter-over-quarter may see bullish price action as investors bet on continued momentum.
▪ Momentum Trading Opportunities: Acceleration often fuels stock price momentum, especially post-earnings. Traders can ride these trends using technical setups like breakouts or pullbacks.
Example: A stock breaking above a key resistance level after reporting accelerating growth may be a buy signal for swing traders.
▪ Early Indicator of Breakouts: Companies with accelerating fundamentals are more likely to experience price breakouts, as institutional investors (e.g., hedge funds, mutual funds) pile in. Traders can use this to position early.
Example: A retailer with accelerating sales due to strong holiday demand might gap up post-earnings, offering a breakout trade.
▪ Confirmation of Fundamental Strength: Acceleration validates a company’s growth story, reducing the risk of investing in stocks with inconsistent performance. Traders can align technical trades with strong fundamentals.
Example: A biotech with accelerating sales from a new drug launch may sustain a rally, giving traders confidence in long positions.
▪ Volatility for Short-Term Trades: Earnings reports showing acceleration often lead to significant price gaps or volatility, creating opportunities for day traders or options traders.
Example: A trader might buy call options on a stock expected to report accelerating earnings, anticipating a sharp post-earnings move.
🔹 Power Earnings Gaps - Examples
🔹 Screening Features - Setting Your Search Criteria
Power Earnings Gap
▪ Search Range
How many bars back to search for Power Earnings Gaps, anywhere between 1 and 90 bars.
▪ Last Bar Only
Look only at the last bar for Power Earnings Gaps. This is useful when looking for PEGs when screening at the end of a trading day. Choosing this option, the Search Range will be ignored.
▪ Minimum Price % Gap Up From Prior Close
This is the minimum gap up percent change to be considered a Power Earnings Gap.
▪ Minimum Volume % Change Over Average
This is the minimum volume percent change, over the 50-day average volume, to be considered a Power Earnings Gap.
▪ Require Positive Surprise
Require a positive earnings surprise and the minimum percent change.
▪ Require Closing Range
To ensure the price action closed strong on the day, specify a preferred closing range as a percentage of the bar's daily range.
▪ Gap Up Bar
The gap up bar can be configured to require one of the following:
- Open Above Prior High - Ensures there is visible gap up from the prior bar.
- Low Above Prior High - Allows for intraday price action to go below the prior bar high.
- No Requirement
Earnings And Sales Acceleration
▪ Quarters of Acceleration
You can specify between 1 and 4 quarters of earnings and/or sales acceleration.
🔹 Installation And Usage
▪ Mark this indicator as a Favorite.
▪ Use the Pine Screener to search for stocks.
▪ Save the search results to a watchlist.
▪ View the watchlist in TradingView.
🔹 Note
▪ Risk of Reversals: Not all gaps sustain their direction. Over reactions can lead to gap fills.
▪ High Volatility: Earnings gaps can be unpredictable, requiring quick decision-making & discipline.
유료 스크립트
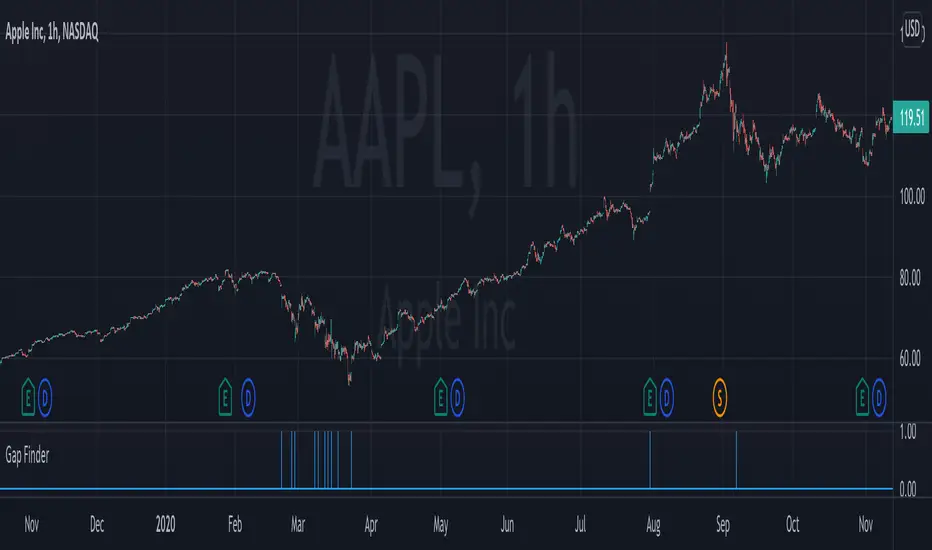
Smart Gap Indicator + EMAs📈 Smart Gap Indicator + EMAs
Spot high-impact gaps with precision and confidence.
🔍 What it does:
This tool identifies and highlights strategic price gaps that often precede strong directional moves. It filters out noise by combining advanced logic with volume activity and trend bias, helping you focus on the most relevant setups.
📊 Key Features:
Smart Gap Detection – Automatically detects meaningful gap up/down events based on dynamic thresholds.
EMA Trend Filter – Optional multi-EMA filter (10, 21, 50) to help align trades with the prevailing market trend.
Volume Spike Signal – Highlights volume surges that may indicate institutional involvement.
Clean Visuals – Configurable labels, shapes, and optional gap fill lines to aid quick interpretation.
Gap Performance Table – Summarizes recent gap activity to assess directional bias.
⚠️ Built-in Alerts:
Gap Up
Gap Down
Gap + Volume Spike
💡 Made by a trader, for traders.
Whether you're a swing trader, gap hunter, or momentum follower—this tool was crafted to give you an edge where it matters most: timing.
Auto Gap DetectorThis indicator uses previous sessions open/close (whichever is closest) and the new sessions open to automatically detect both a gap up or gap down on any timeframe but is intended for use on on the daily timeframe ONLY. This is not the traditional definition of a gap but the one that i use for my strategy and has been more consistent and conservative than others.
We have also provided instructions on how to create alerts for these indicators below.
Happy Trading!
White Boxes: indicate an overnight gap up/down that is incomplete or not filled.
Green Boxes: When a gap fill is complete the white box will be changed to a green box so that it may still be used as a reference for support and resistance on following sessions.
*Color, transparency and borders of boxes can be customized in settings.
Set Up Alerts
Now, let’s make sure you get notified when a gap has occurred and when it has been filled happens:
Open the Alerts Menu
On the chart, click the bell icon (top right of the screen) to create an alert.
Configure the Auto Gap indicator
In the “Condition” dropdown, select “Auto Gap indicator".
Below that, select “Overnight Gap Detected or Overnight Gap Filled.”
*Note: if you want to detect when both a gap has been detected and when it has been filled you must create two separate alerts.
Set “Once Per Bar Close” in the next dropdown (this ensures it only triggers after the period ends, avoiding false signals mid-bar).
Choose how you want to be notified (e.g., popup, email, or phone app—set this under “Notifications”).
Configure the Auto Gap Alert
Click the bell icon again to create a second alert.
Feel free to leave comments requesting any upgrades or potential bugs. Thank you!

Earnings Gap UpsBased on research conducted by John Pocorobba and Jason Thompson, the Earnings Gap Ups Indicator is designed to identify three types of earnings gaps, key levels, and the "alpha window"—a period when stocks often outperform following a gap. These gaps are frequently observed in high-performing stocks.
What is an Earnings Gap?
An earnings gap occurs when a stock's price makes a significant jump, after the company reports earnings signifying the street (institutions) were caught off guard.
The three different types of gaps are as follows: [/b
PEG (Power Earnings Gap)
Price gain of 10% or more
Volume is greater than 200% above the 50-day average
EPS surprise of at least 20%
Monster Gap
Price gain of 20% or more
Volume is greater than 300% above the 50-day average
No fundamental requirement
Monster Peg
Price Gain of 20% or more
Volume is greater than 300% above the 50-day average
EPS surprise of at least 20%
Key Levels and the Alpha Window
In addition to spotting these gaps, the indicator marks key levels on the chart and extends them through the alpha window, which represents the time period when the stock tends to outperform after the gap.
Key levels include:
High volume close: The closing price on a day with unusually high trading volume
High volume close minus 5%: A potential support level below the high volume close
Gap day high: The highest price reached on the gap day
Gap day low: The lowest price reached on the gap day
By understanding and tracking these gaps and levels, traders can map out a playbook for trading earnings gaps.

Pivotal Point Detection
The indicator highlights price gaps (overnight gaps) with significantly increased volume in the daily chart only. These price jumps can occur after earnings reports or other significant news and often point to an important event (e.g., a new product or business model). According to Jesse Livermore, these are called Pivotal Points.
The price jumps displayed by the indicator are not a guarantee that they represent a true Pivotal Point, but they provide a hint of a significant business development - especially when they occur repeatedly alongside revenue growth. This can help identify potentially strong growth stocks and high-performing investments. However, the underlying events and connections must be investigated through additional research.
make posible to find stocks like:
NYSE:PLTR NASDAQ:ROOT NASDAQ:NVDA NYSE:CVNA NYSE:LRN
A "pivotal price line" is drawn at the opening price of the Pivotal Point. This line is considered a support level. If the price falls below this line, the Pivotal Point loses its validity.

Gap Detector [MS]This indicator helps traders identify and visualize price gaps in market data. When price movements create gaps between trading sessions or periods, the script highlights these areas with colored clouds and markers.
Key Features:
Automatically detects price gaps based on a customizable gap percentage threshold
Visualizes gaps using color-coded clouds (green when price moves upward, red for downward price action)
Places small triangle markers at gap locations for easy identification of gaps, and if many happen close together
Shows gray clouds when price is within the last gap
Use it For:
Watching for gap-fills
Gap support/resistance levels
Trading gap breakouts
...and more
How it Works:
The script compares each bar's opening price with the previous bar's closing price. A gap is identified when the opening price is significantly different from the previous close (beyond the user-defined gap percentage). The gap area is then marked with a colored cloud:
Green clouds: Show gaps where price jumped higher
Red clouds: Show gaps where price dropped lower
Gray clouds: Indicate price action within the gap
Settings:
Gap %: Controls the minimum price difference required to identify a gap (default 0.01 or 1%)
This indicator can help traders:
Identify potential support/resistance levels at gap areas
Monitor gap-filling scenarios
Spot significant price movements between trading sessions
The script is designed to work across all timeframes and markets.

Gap Finder Pro (incl. Island Gaps)Hello Traders!
Unlock the power of gap trading with Gap Finder Pro , a comprehensive tool designed to identify, analyze, and visualize price gaps in any market. This advanced indicator goes beyond simple gap detection, offering you a wealth of features to enhance your gap trading strategies.
Key Features
Precise gap detection for both up and down gaps
Island gap identification and analysis
Detailed statistics for data-driven decision making
Customizable visual elements for clear chart analysis
Flexible settings to adapt to various trading styles and timeframes (works on daily and intraday charts)
Understanding and Trading Gaps
Price gaps occur when an asset opens at a different price than its previous close, creating a blank space on the chart. Gaps can signal significant market sentiment shifts and often present lucrative trading opportunities. Gap Finder Pro helps you capitalize on these opportunities
Island Gaps: A Powerful Trading Signal
Island gaps, a rare but potent chart pattern, occur when a gap is followed by a period of price consolidation and then another gap in the opposite direction. The indicator automatically detects and highlights these formations, allowing you to spot potential trend reversals or continuation patterns quickly.
Comprehensive Statistics
Make data-driven decisions with the built-in statistics panel. Analyze:
Total number of gaps (up and down)
Average and median gap sizes
Gap fill rates and average time to fill
Percentage of gaps filled within specific timeframes
Breakdown of gap types (standard vs. island)
These statistics empower you to understand market behavior better and refine your gap trading strategies over time.
Trading Strategies
Island Gap Reversals: Capitalize on the powerful reversal signals provided by island gaps.
Breakout Trading: Look for gaps in a V-formation as potential signs of strong trend continuation.
Gap Fill Trading: Use the indicator to identify unfilled gaps and set targets for potential mean reversion trades.
(For example, enter short for a up gap fill if a down candle closes below the previous candle's low.)
Statistical Edge: Leverage the comprehensive statistics to develop gap-based trading systems.
Whether you're a seasoned gap trader or looking to incorporate gap analysis into your trading strategy, Gap Finder Pro provides the tools and insights you need to make informed decisions in any market condition. Elevate your trading with this powerful, all-encompassing gap analysis indicator.

Swing Trend AnalysisIntroducing the Swing Trend Analyzer: A Powerful Tool for Swing and Positional Trading
The Swing Trend Analyzer is a cutting-edge indicator designed to enhance your swing and positional trading by providing precise entry points based on volatility contraction patterns and other key technical signals. This versatile tool is packed with features that cater to traders of all timeframes, offering flexibility, clarity, and actionable insights.
Key Features:
1. Adaptive Moving Averages:
The Swing Trend Analyzer offers multiple moving averages tailored to the timeframe you are trading on. On the daily chart, you can select up to four different moving average lengths, while all other timeframes provide three moving averages. This flexibility allows you to fine-tune your analysis according to your trading strategy. Disabling a moving average is as simple as setting its value to zero, making it easy to customize the indicator to your needs.
2. Dynamic Moving Average Colors Based on Relative Strength:
This feature allows you to compare the performance of the current ticker against a major index or any symbol of your choice. The moving average will change color based on whether the ticker is outperforming or underperforming the selected index over the chosen period. For example, on a daily chart, if the 21-day moving average turns blue, it indicates that the ticker has outperformed the selected index over the last 21 days. This visual cue helps you quickly identify relative strength, a key factor in successful swing trading.
3. Visual Identification of Price Contractions:
The Swing Trend Analyzer changes the color of price bars to white (on a dark theme) or black (on a light theme) when a contraction in price is detected. Price contractions are highlighted when either of the following conditions is met: a) the current bar is an inside bar, or b) the price range of the current bar is less than the 14-period Average Daily Range (ADR). This feature makes it easier to spot price contractions across all timeframes, which is crucial for timing entries in swing trading.
4. Overhead Supply Detection with Automated Resistance Lines:
The indicator intelligently detects the presence of overhead supply and draws a single resistance line to avoid clutter on the chart. As price breaches the resistance line, the old line is automatically deleted, and a new resistance line is drawn at the appropriate level. This helps you focus on the most relevant resistance levels, reducing noise and improving decision-making.
5. Buyable Gap Up Marker: The indicator highlights bars in blue when a candle opens with a gap that remains unfilled. These bars are potential Buyable Gap Up (BGU) candidates, signaling opportunities for long-side entries.
6. Comprehensive Swing Trading Information Table:
The indicator includes a detailed table that provides essential data for swing trading:
a. Sector and Industry Information: Understand the sector and industry of the ticker to identify stocks within strong sectors.
b. Key Moving Averages Distances (10MA, 21MA, 50MA, 200MA): Quickly assess how far the current price is from key moving averages. The color coding indicates whether the price is near or far from these averages, offering vital visual cues.
c. Price Range Analysis: Compare the current bar's price range with the previous bar's range to spot contraction patterns.
d. ADR (20, 10, 5): Displays the Average Daily Range over the last 20, 10, and 5 periods, crucial for identifying contraction patterns. On the weekly chart, the ADR continues to provide daily chart information.
e. 52-Week High/Low Data: Shows how close the stock is to its 52-week high or low, with color coding to highlight proximity, aiding in the identification of potential breakout or breakdown candidates.
f. 3-Month Price Gain: See the price gain over the last three months, which helps identify stocks with recent momentum.
7. Pocket Pivot Detection with Visual Markers:
Pocket pivots are a powerful bullish signal, especially relevant for swing trading. Pocket pivots are crucial for swing trading and are effective across all timeframes. The indicator marks pocket pivots with circular markers below the price bar:
a. 10-Day Pocket Pivot: Identified when the volume exceeds the maximum selling volume of the last 10 days. These are marked with a blue circle.
b. 5-Day Pocket Pivot: Identified when the volume exceeds the maximum selling volume of the last 5 days. These are marked with a green circle.
The Swing Trend Analyzer is designed to provide traders with the tools they need to succeed in swing and positional trading. Whether you're looking for precise entry points, analyzing relative strength, or identifying key price contractions, this indicator has you covered. Experience the power of advanced technical analysis with the Swing Trend Analyzer and take your trading to the next level.

Precise Gap FinderPrecise Gap Finder
This indicator identifies Fair Value Gaps (FVGs) in price action and it is perfect for traders looking to exploit price imbalances and capitalize on trading opportunities.
How It Works:
The Precise Gap Finder detects Fair Value Gaps by analyzing three consecutive candles. A gap is identified when the middle candle’s price range (open to close) is not overlapped by the high and low prices of the surrounding candles. This indicates a price imbalance, which can be a strong signal for potential market moves.
How to Use for Trading:
Identify Entry Points: Use the highlighted Fair Value Gaps to spot potential entry points. An upward FVG can indicate a potential buying opportunity, while a downward FVG can signal a potential selling opportunity.
Confirm Trends: Combine the FVG signals with other technical indicators to confirm trends and enhance the accuracy of your trades.
Risk Management: Use FVGs to identify potential stop-loss and take-profit levels. Gaps can serve as natural support and resistance levels.
Backtesting: Analyze historical data to understand how FVGs have impacted price movements in the past, helping you refine your trading strategy

Gap Finder (Arpan)This indicator highlights gaps on the chart where the price between two bars changes without any trades happening between them. It'll highlight gaps created during "Gap Up" or "Gap Down". This indicator has been developed to highlight mainly smaller gaps created on lower time frames though it displays gaps on any time frame. This script also has the option to disable "Opening Gaps" so that we can easily see only smaller gaps on the charts. Gaps are highlighted with colored boxes. Users can change length, border color and background color of those boxes. Set "Opacity" to zero in settings if you don't want to see borders or background colors. Users are welcomed to share their suggestions or bugs in the script
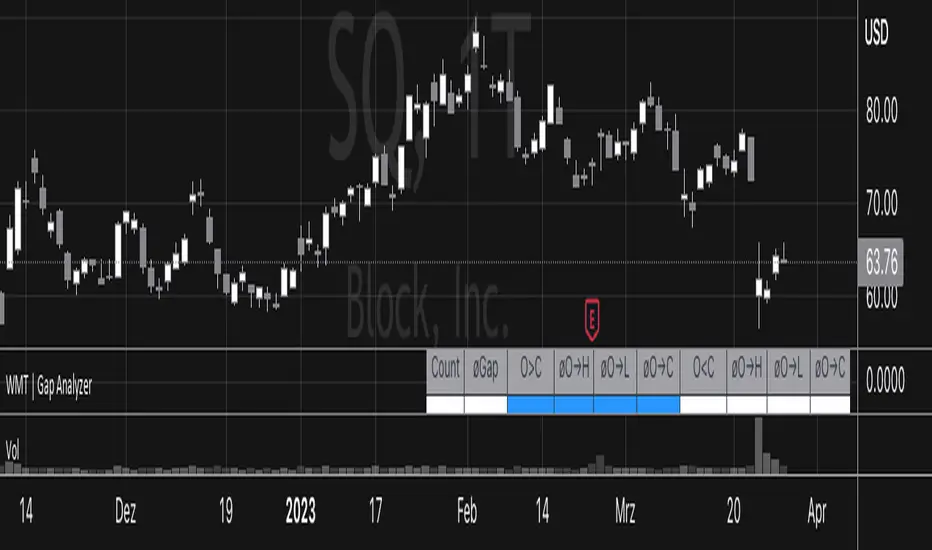
Gap Analyzer [WMT] - Data for Gap Up and Gap DownGet data for gaps with Gap Analyzer
Change the gap mode in settings to switch between a Gap Up (default) or Gap Down
Change the threshold for the minimum (Gap Up) and maximum (Gap Down) gap
Change Data Years -> Years of the look back period to calculate the stats
Retrieve valuable information for past statistics on how the instrument behaved with the given gap
Definitions for Gap Up
Price can fade lower from the open or (Gap Up Fade)
Price can continue higher from the open (Gap Up Continuation)
Definitions for Gap Down
Price can continue lower from the open or (Gap Down Continuation)
Price can bounce higher from the open (Gap Down Bounce)
For each of those, we get:
"øO→H": average percentage movement from open to high of the day
"øO→L": average percentage movement from open to low of the day
"øO→C": Average percentage movement from open to close of the day
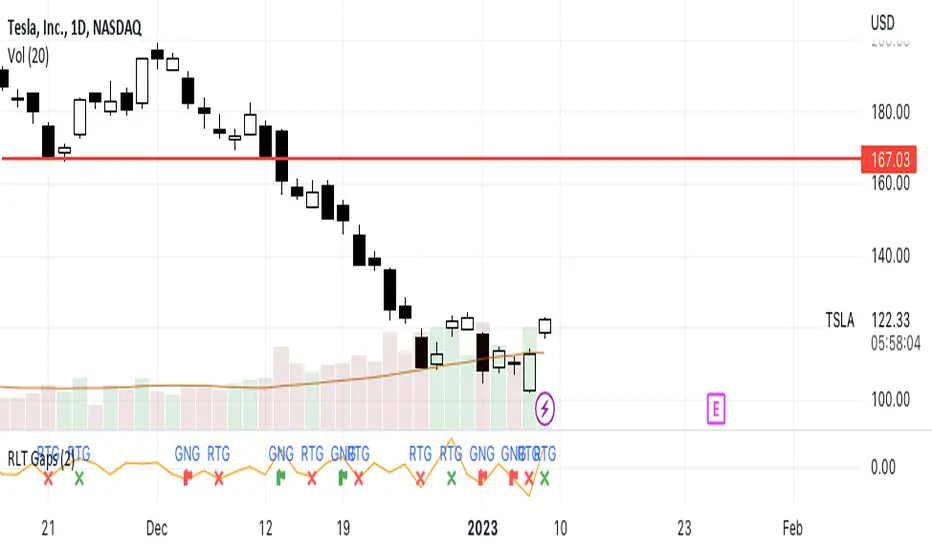
RLT GapsThis tool is meant to help you learn the different types of gaps:
GNG = Gap N Go (flag icon). This occurs
RTG = Retest Gap (x icon)
SETTINGS
Gap Size: Will display a green(bullish) or red(bearish) icon. The 2% (default) gap size will highlight gaps that are greater than the configured setting (2% up or 2% down).
NOTES
The gap size is measured from the previous day CLOSE to the current day OPEN and ignores the current days movement.
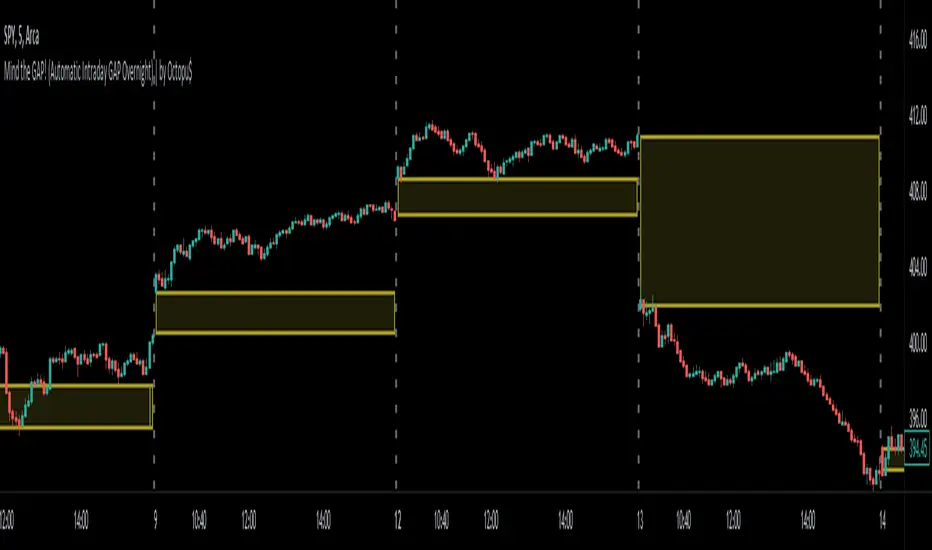
Mind the GAP! (Automatic Intraday GAP Overnight) | by Octopu$🤏 Mind the GAP! (Automatic Intraday GAP Overnight) | by Octopu$
Gaps are areas on a chart where the price of a stock moves sharply up or down, with little or no trading in between.
When it happens overnight (not considering Extended Hours), it is just considered as Price Level, for possible revisit.
A Gap is defined when the Open current Candle is Higher or Lower than the Close of the Last Candle:
When the Open of the current Candle is Higher than the Close of the Last Candle it is considered a Gap UP;
When the Open of the current Candle is Lower than the Close of the Last Candle it is considered a Gap DOWN;
Something interesting about Gap is that:
1. The Price Action can travel fast between these levels (Volatility);
2. One (or both) of these levels (Hi/Lo) can act as Support (or Breakout);
3. One (or both) of these levels (Hi/Lo) can act as Resistance (or Breakout).
This Indicator includes these Gaps added Automatically to your Chart.
It is also built-in with a Shadow between the lines for easy visualization.
Colors are also customizable and the Lines are also editable according t your preferences.
Any Time Frame. Any Ticker.
(Using SPY 5m just as an example:)
www.tradingview.com
AMEX:SPY
Features:
• Identifies Gaps on MC/MO
• Automatically adds Lines to these levels
• Includes shadow for easy visualization
Options:
• Customizable: Colors and Lines
• On/Off Switches for the Levels
• Show/Hide Previous Days
Notes:
v1.0
Indicator release
Changes and updates can come in the future for additional functionalities or per requests.
Did you like it? Boost it. Shoot a message! I'd appreciate if you dropped by to say thanks.
- Octopu$
🐙
Gap FinderThe Gap Finder Indicator will allow you to quickly identify gaps on the chart. Gaps in this indicator are defined as the "black space" between candles with the space being as small as $0.01. A gap up is one where the previous candle's high is lower than the current candle's low. A gap down is one where the previous candle's low is higher than the current candle's high.
Features:
Highlight Gap Area will show the price levels for the last found gap.
Show Last Only - will show only the last gap to help declutter the chart.
Basic guidelines for Gap trading:
Wait 3-5 Periods to allow the momentum to settle
Take trade on reversal candle with stop above recent high
Exit for profit when the gap fills.
This indicator will work for all timeframes using the definitions above so good for day traders, swing traders and any other style of trader using gaps in their strategy.

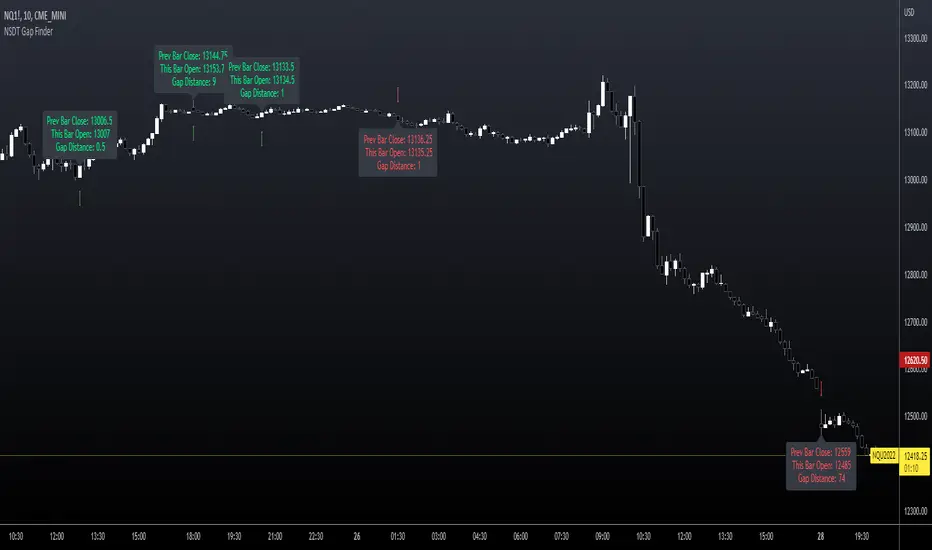
NSDT Gap FinderThis script plots gaps between candles.
It uses the "round_to_mintick" feature in the Pinescript code, so it works on any instrument out to 3 decimal places.
If there is a Gap Up (open of current candle is greater than the close of previous candle) it will plot a green arrow under the current candle and plot a label above the current candle to show the Gap Amount.
If there is a Gap Down (open of current candle is less than the close of previous candle) it will plot a red arrow over the current candle and plot a label below the current candle to show the Gap Amount.
You can turn the label and/or the arrow on and off.
I created this indicator to more easily identify gaps in the market. The probability of a gap being filled is extremely high. Some are right away (intraday candle to candle), some take a while (gap from previous day close to current day open), and some make take a long time (close at end of previous week to open at beginning of current week).
This is published free to use and open source code.
Please see my other similar Gap Indicators.
Daily Gap Range
USA Session - Previous Day Close Gap to Current Day Open
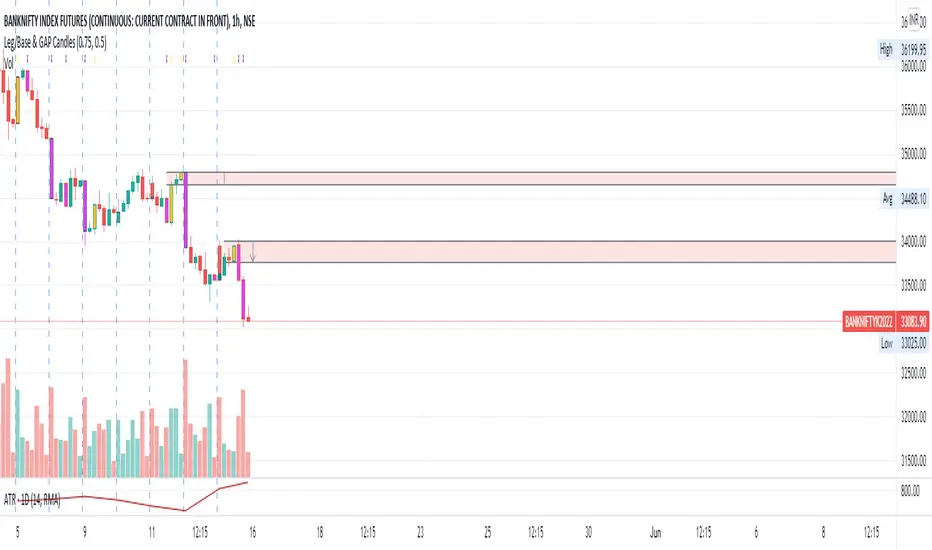
Leg/Base & GAP CandlesThis script, redraws the Minute, Hourly, Daily, Weekly, Monthly candles for gap up and gap down situation. Also this candle marks the LEG candles and BASE Candles with different colors to mark the supply and demand zone.
This script is only for Indian NSE markets (09:15 to 15:30) for GAP up/GAP down redraw.
This script is most beneficial for TradeLegend students.
This script is originally made by me, and no code has been modified or copied from anywhere else except Pinescript documentation.
Gap FinderThis indicator finds gaps based on User specified input % threshold in the indicator settings. Histogram plot shows gaps as vertical lines for easy detection. Enjoy!
TC Gaps IndicatorTrade Central Gaps indicator makes it super easy to visualise gaps in your charts in any timeframe. You can also configure the width of gaps in percentage (default is 0.5%).

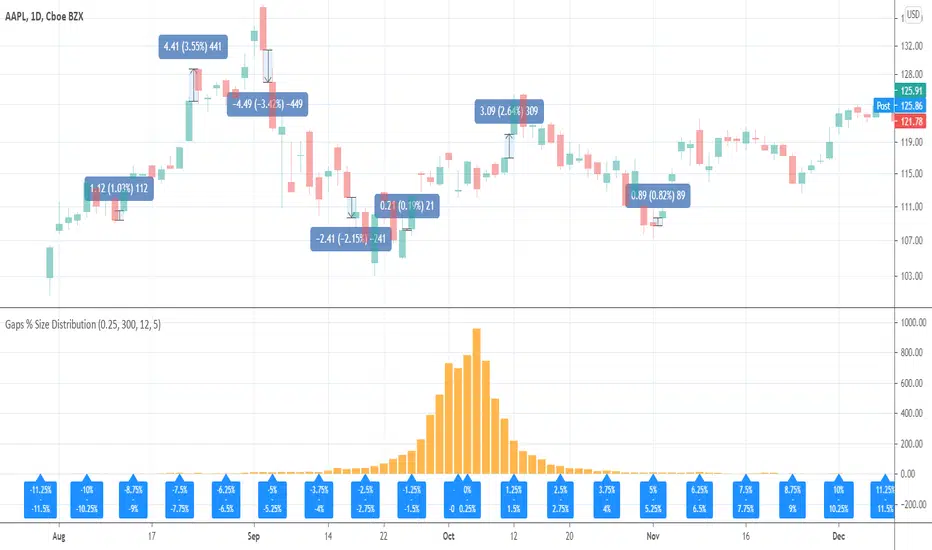
Gaps % Size DistributionThis tool is to visualize the distribution of gap % sizes, i.e. those things that I marked on the main chart. The tool uses the entire history of an instrument.
The detalization depends on the Binning Step parameter. The lower chart timeframe the lower that step should be.
Good luck.
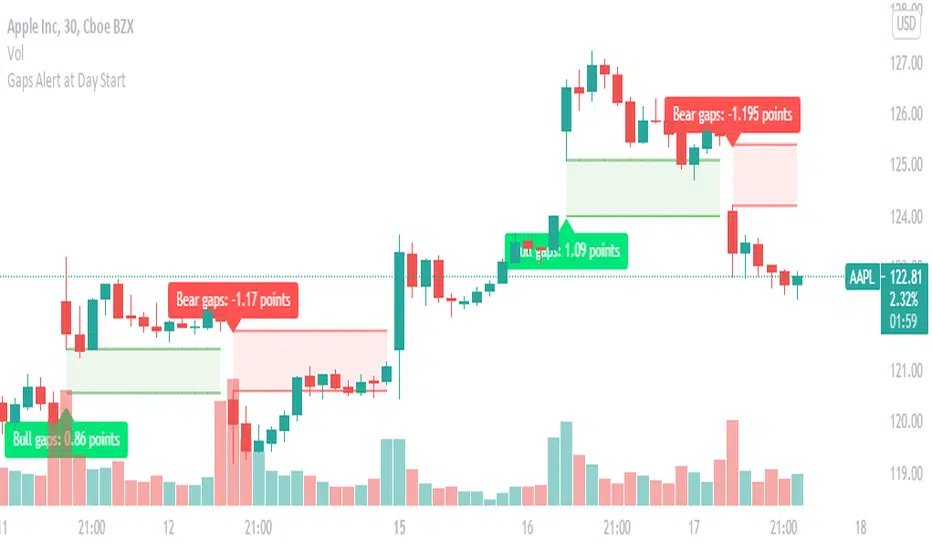
Gaps : set Alert to get Alert at Day StartGaps are areas on a chart where the price of a stock (or another financial instrument) moves sharply up or down,
with little or no trading in between. As a result, the asset's chart shows a gap in the normal price pattern.
The trader can interpret and exploit these gaps for profit.
What do i look for in these gaps, Will these gaps will fill or not fill?
When someone says a gap has been filled, that means the price has moved back to the original pre-gap level.
how you can benefit with this indicator?
this indicator instantly picks up the gap at the start of the day and also helps in identifying weather it is a bullish gap or a bearish gap
in this you can easily set up alerts, you will be instantly alerted if any gap occurs.
What does the visual on chart indicates ?
Green color gaps are bullish gaps or gap up ,label indicates the type of gap and the width of the gap
Red color gaps are bearish gaps or gap down ,label indicates the type of gap and the width of the gap
once you set alert you will Receive alert in the below format
Price (current price) 'Bear gap width: ' (gap Width in points)
Price (current price) 'Bull gap width: ' (gap Width in points)
This will work on all time frame equal to or less than "D".
BITCOIN CME FUTURES GAPSDisplays information about Bitcoin CME Futures Gaps over BTCUSD (or XBTUSD) charts.
You can configure a threshold percentage to only display gaps whose size is greater than that percentage. The gap precentage is calculated based on the current close price.
Gaps up are displayed in Orange, gaps down in Green

Gapup Advanced (B/S)This indicator provides you support and resistance line for Intraday trading. We have made the calculations using the historical data of (EMA 10, open ,high,low,close,52week high,52w low). We tried to capture the rapid moment of stock depending on the previous day values and EMA 10. Unlike the lagging indicator which changes the values periodically.
This is a Leading Indicator which uses TRADINGVIEW's powerful code "Resolution "-ie the indicator values will not change for the intraday, though you change to any timeframe.
Our indicator will take care of the work of conditioning and plotting and plot only if it matches all the criteria. So plotting of EMA is not required. If you want to plot EMA manually ,I would (recommend tf=15min,10ema) .
How to use this Indicator ?
When we can go long?
When you get a green line along with dot, go for BUY. Once the candle hits our target (i.e the black dotted line) close the trade and book your profits. And once the dot in the green line is off ,it means the stock will not go beyond primary target. When the dot in the green line is off, it means it has the possibility to go DOWN further.
Bonus Tip: If the 15 min candle closes above any of the trend line and in the next candle if it takes support from that line itself then it has the possibility to go up further.
When we can go short ?
When you get a red line along with dot, go for SELL. Once the candle hits our target (i.e the black dotted line) close the trade and book your profits. And once the dot in the red line is off , it means the stock will not go beyond primary target. When the dot in the red line is off, it means it has the possibility to go UP further.
Bonus Tip: If the 15 min candle closes below any of the trend line and in the next candle if it faces the resistance from that line itself then it has the possibility to go down further.
The other 2 green dotted lines/ red dotted lines are Bonus targets 2 and 3.
ie. The trend may reverse @ any point above the primary target in case of buy.
Ie. The trend may reverse @ any point below the primary target in case of sell.
To be a Consistent Profitable Trader:
Always aim for the one adjacent level above or below the current level.
Unique Feature - "THE PINK LINE"
In case of buy call, if the trend reverses we give you a recommended down target.
In case of sell call , if the trend reverses we give you a recommended up target.
Minor Support & Resistance line:
Also if the trend reverses,
In case of buy, minor support and resistance are present below.
In case of sell, minor support and resistance are present above.
It can used to trade in Options, futures ,equity. Suitable for all high moment stocks,indices, commodities.
Final Bonus Tip:
I always recommend for every trader to trade with min stock quantity eg:1-10 with any indicator/ strategy. Then you can choose to trade in lots in futures and options.
It is useful for scalpers and Intraday traders.
Recommended Time Frame : 5/15 min.
Suitable for all stocks,indices, commodities .