DWM HLOC, Mid & WicksSimple, yet effective.
1. Automatically calculate and projects key price levels from a previous period (Yesterday, OR Last Week / Month) onto the current trading session. It acts as an immediate Support & Resistance map based on historical price action.
2. Multi-Timeframe Logic
Modes --
Daily Mode: Projects yesterday's data onto today.
Weekly Mode: Projects last week's data onto the current week.
3. Key Levels Visualized The script calculates seven distinct price levels:
OHLC: Previous Open, High, Low, and Close.
Equilibrium (Mid): The exact 50% mark between the previous High and Low.
Wick Midpoints (New):
Upper Wick 50%: The midpoint between the High and the top of the body.
Lower Wick 50%: The midpoint between the Low and the bottom of the body.
4. Smart "Gap" Visualization The script uses unique starting points to help traders visualize market gaps:
Standard Levels (High, Low, Open, Mids): These lines originate from the Previous Period's Open, showing the full context of the level relative to time.
Close Level: This line originates from the Current Period's Open. This visually highlights the "Gap" (the jump in price between where the market closed previously and where it opened today).
5. Full Customization
Aesthetics: Every line can be individually toggled on/off.
Styling: Users can independently change the color, line style (Solid, Dotted, Dashed), and thickness for every specific level.
Gap

SCOTTGO - Day Trade Stock Quote V4This Pine Script indicator, titled "SCOTTGO - Day Trade Stock Quote V4," is a comprehensive, customizable dashboard designed for active traders. It acts as a single, centralized reference point, displaying essential financial and technical data directly on your chart in a compact table overlay.
📊 Key Information Provided
The indicator is split into sections, aggregating various critical data points to provide a holistic picture of the stock's current state and momentum:
1. Ownership & Short Flow
This section provides fundamental context and short-interest data:
Market Cap, Shares Float, and Shares Outstanding: Key figures on the company's size and publicly tradable shares.
Short Volume %: Indicates the percentage of trading activity driven by short sellers.
Daily Change %: Shows the day's price movement relative to the previous close.
2. Price & Volatility
This tracks historical and immediate price levels:
Previous Close, Day High/Low: Key daily reference prices.
52-Week High/Low: Important long-term boundaries.
Earnings Date: A crucial fundamental date (currently displayed as a placeholder).
3. Momentum & Volume
These metrics are essential for understanding intraday buying and selling pressure:
Volume & Average Volume: The current trade volume compared to its historical average.
Relative Volume (RVOL): Measures how much volume is currently trading compared to the average rate for that time period (shown for both Daily and 5-Minute rates).
Volume Buzz (%): A percentage representation of how much current volume exceeds or falls below the average.
ADR % & ATR %: Measures of volatility.
RSI, U/D Ratio, and P/E Ratio: Momentum and valuation indicators.
4. Context
This provides background information on the security:
Includes the Symbol, Exchange, Industry, and Sector (note: some fields use placeholder data as this information is not always available via Pine Script).
⚙️ Customization
The dashboard is highly customizable via the indicator settings:
You can control the visibility of every single metric using the Section toggles.
You can change the position (Top Left, Top Right, etc.), size, and colors of the entire table.
In summary, this script is a powerful tool for day traders who need to monitor a large number of fundamental, technical, and volatility metrics simultaneously without cluttering the main chart area.

ICT Fair Value Gap (FVG) Detector │ Auto-Mitigated │ 2025Accurate ICT / Smart Money Concepts Fair Value Gap (FVG) detector
Features:
• Detects both Bullish (-FVG) and Bearish (+FVG) using strict 3-candle rule
• Boxes automatically extend right until price mitigates them
• Boxes auto-delete when price closes inside the gap (true mitigation)
• No repainting – 100% reliable
• Clean, lightweight, and works on all markets & timeframes
• Fully customizable colors and transparency
How to use:
– Bullish FVG (green) = potential support / buy zone in uptrend
– Bearish FVG (red) = potential resistance / sell zone in downtrend
Exactly matches The Inner Circle Trader (ICT) methodology used by thousands of SMC traders in 2024–2025.
Enjoy and trade safe!

Gap-Up Momentum Screener (S.S)
ENGLISH-VERSION
1) TradingView Gap Screener (for US stocks)
➤ Conditions
Gap-Up ≥ +3% (large gaps indicate institutional pressure)
Pre-market volume ≥ 150% of the 20-day average
RS line > 50
Price > 50 SMA
Market cap ≥ 1 billion USD
No penny stocks
2) Minervini Gap-Entry Strategy (Swing Trading)
This is a variant specifically optimized for gaps + momentum.
A) Setup Criteria
The stock must meet the following conditions:
Gap-Up ≥ +3%
First retracement ≤ 30% of the gap
High relative strength (RS line rising)
Volume on the gap day > 2× average
Price above 20 EMA, 50 SMA, 150 SMA, 200 SMA
No immediate resistance within 2–5%
B) Entry Setups
Entry 1: First Pullback Entry (FPE)
Wait for the first 1–3 day consolidation.
Entry → Breakout of the small range.
Stop → Below the low of the pullback.
Rule: No entry on the gap day itself.
Entry 2: High Tight Flag above the Gap
Stock rises > 10% after the gap
Then forms a 3–8 day sideways phase
Entry → Break above the flag’s high
Stop → Below the flag base
Entry 3: ORB Entry (Opening Range Breakout, 30 minutes)
Very effective for strong gaps.
Wait 30 minutes after the market opens
Entry → Break above the high of these first 30 minutes
Stop → Below the 30-minute low
C) Stop Levels
For FPE: 4–8%
For ORB: 1–2 × ATR(14)
For flags: 3–5%
D) Add Rules
Only if the stock continues showing strong volume:
Add on every new 3–5 day high
Add only above half-range levels
Maximum 3 adds
3) Early-Warning Module (Setup forming but not ready for entry)
This module marks stocks that are forming a setup but are not yet buyable.
➤ Criteria
Gap-Up ≥ 3%
Strong volume
Stock pulls back and consolidates (1–5 bars)
BUT no breakout yet
4) Exact Entry Checklist (Minervini-style, optimized for gaps)
Checklist before entry:
Gap ≥ +3%
20 EMA rising
Volume > 2× average
RS line rising
Price > 50 SMA
Pullback not deeper than 30% of the gap
3+ green signals from the Early-Warning diamonds
If all 7 are fulfilled → green light.
5) How to apply the strategy in daily practice
Morning (08:00–09:00)
Check the screener
Build your watchlist
Identify gaps
US Market Open (15:30)
Monitor the Early-Warning module
Sort gap momentum opportunities
16:00–17:00
Enter: First Pullback / ORB / Flag
Set stops
Determine position size based on risk
After 20:00
Check volume strength
If momentum fades → no more adds

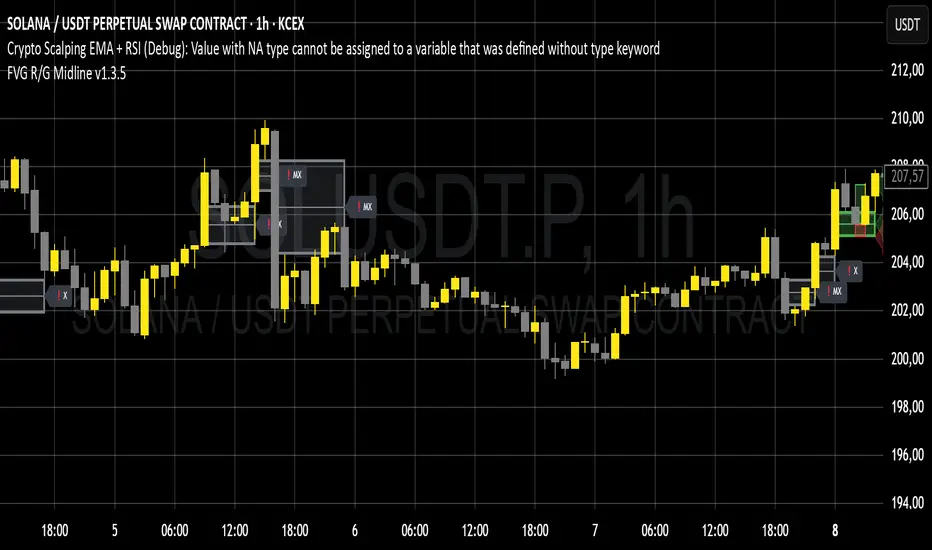
Scalper Pro Pattern Recognition & Price Action📘 Scalper Pro Pattern Recognition & Price Action
Overview
Scalper Pro is a dynamic multi-layer trend recognition and price action strategy that integrates Supertrend, Smart Money Concepts (SMC), and volatility-based risk control.
It adapts to market volatility in real time to enhance entry precision and optimize risk.
⚠️ This script is for educational and research purposes only.
Past performance does not guarantee future results.
🎯 Strategy Objectives
Detect structural market shifts (BOS / CHoCH) automatically.
Identify Order Blocks (OB), Fair Value Gaps (FVG), and key liquidity zones.
Plot dynamic Take-Profit (TP) and Stop-Loss (SL) levels based on ATR.
Avoid low-volatility (sideways) conditions using ADX filtering.
Combine trend-following signals with structural confirmation.
✨ Key Features
Supertrend Entry Signals — Generates precise buy/sell markers based on price crossovers with the Supertrend line.
Order Block Detection — Automatically plots both Internal and Swing Order Blocks for smart money insights.
Fair Value Gap Visualization — Highlights inefficiency zones in bullish or bearish structures.
Market Structure Labels — Marks Break of Structure (BOS) and Change of Character (CHoCH) points for clear trend shifts.
Dynamic Risk Levels — Automatically generates TP/SL lines and price labels using ATR-based distance.
📊 Trading Rules
Long Entry:
• Price crosses above the Supertrend (ta.crossover(close, supertrend))
• ADX above sideways threshold (trend condition confirmed)
• Optional confirmation from a bullish BOS or CHoCH
Short Entry:
• Price crosses below the Supertrend (ta.crossunder(close, supertrend))
• ADX above threshold
• Optional confirmation from a bearish BOS or CHoCH
Exit (or Reverse):
• Opposite Supertrend crossover
• Price hits TP/SL lines
• Trend shift confirmed by internal BOS/CHoCH
💰 Risk Management Parameters
Stop Loss & Take Profit based on ATR × risk multiplier
ATR Length: 14 (default)
Risk %: 3% per trade
Sideways Filter: ADX < 15 → no trade zone
TP1–TP3 = Entry ± (ATR × 1~3)
⚙️ Indicator Settings
Supertrend Module:
ATR Length: 10
Factor: nsensitivity × 7
ADX Module:
ADX Length: 15
Sideways Threshold: 15
EMA Set:
EMA (5, 9, 13, 34, 50) × Volatility Factor (3)
SMA Filter:
SMA(8) & SMA(9) for short-term trend confirmation
Smart Money Concepts Module:
Displays BOS/CHoCH, Order Blocks, FVGs, Equal Highs/Lows, and Premium/Discount zones
🔧 Improvements & Uniqueness
Integrates Supertrend momentum with Smart Money Concepts (SMC) structural analysis.
Dual detection layers: Internal (micro) and Swing (macro) structures.
ATR-driven auto labeling for entry, stop, and profit targets.
Premium/Discount and Equilibrium zones visualized on the chart.
Built-in ADX filter to skip low-trend market conditions.
✅ Summary
Scalper Pro Pattern Recognition & Price Action merges classical trend-following with modern market structure analytics.
It combines momentum detection, volatility control, and smart money mapping into one cohesive framework.
Unified trend, structure, and risk visualization.
Auto-marked BOS/CHoCH, OB, FVG, and liquidity zones.
Usable for scalping, intraday, or swing trading setups.
⚠️ This strategy is based on historical data and designed for educational use only.
Always apply sound risk management and forward testing before live trading.

ATHENS Gold ICT + Smart Money [Advanced Signals]🎯 ADVANCED ICT + SMART MONEY CONFLUENCE INDICATOR
This indicator combines Inner Circle Trader (ICT) concepts with Smart Money theory to deliver high-probability trading signals based on institutional order flow and market structure.
━━━━━━━━━━━━━━━━━━━━━━━━━━━━━━━━━━━━━━━━
⚡ KEY FEATURES:
✅ ICT CONFLUENCE SYSTEM (0-4 Score)
• Order Blocks (Institutional Entry Zones)
• Fair Value Gaps (Price Imbalances)
• Liquidity Sweeps (Stop Hunt Detection)
• Market Structure (BOS & ChoCh)
✅ SMART SIGNALS
• Signals only trigger with minimum confluence
• Customizable requirements (OB/FVG/Liquidity)
• Filters out low-quality setups
• Higher win rate potential (65-85%)
✅ VISUAL COMPONENTS
• Order Blocks (OB+ / OB-)
• Fair Value Gaps (FVG↑ / FVG↓)
• Liquidity Zones (💧 markers)
• Break of Structure (BOS)
• Change of Character (ChoCh)
✅ PERSISTENT TP/SL LINES
• Entry, Stop Loss, TP1, TP2
• Automatically calculated from OB levels
• Lines extend across chart canvas
• Clear risk:reward visualization
✅ SMART DASHBOARD
• Real-time confluence score
• Component status (OB/FVG/Liquidity)
• Trend direction & RSI
• Signal strength indicator
━━━━━━━━━━━━━━━━━━━━━━━━━━━━━━━━━━━━━━━━
🎯 HOW IT WORKS:
The indicator scores each setup based on 4 key components:
1️⃣ ORDER BLOCK PRESENCE
• Bullish OB = Last bearish candle before strong move up
• Bearish OB = Last bullish candle before strong move down
• Price must be in OB zone
2️⃣ FAIR VALUE GAP (FVG)
• Gap between 3 candles indicating imbalance
• Price tends to fill these gaps
• Bounce from FVG = high probability entry
3️⃣ LIQUIDITY SWEEP
• Price sweeps recent high/low
• Retail stop losses triggered
• Smart money enters opposite direction
4️⃣ MARKET STRUCTURE
• Bullish = HH + HL
• Bearish = LH + LL
• Confirms trend direction
CONFLUENCE SCORE:
- 4/4 = Excellent (75-85% win rate)
- 3/4 = Good (65-75% win rate)
- 2/4 = Moderate (55-65% win rate)
- 1/4 = Weak (avoid)
━━━━━━━━━━━━━━━━━━━━━━━━━━━━━━━━━━━━━━━━
⚙️ CUSTOMIZABLE SETTINGS:
SIGNAL REQUIREMENTS:
- Require Order Block (ON/OFF)
- Require FVG (ON/OFF)
- Require Liquidity Sweep (ON/OFF)
- Minimum Confluence (1-4)
VISUAL SETTINGS:
- Show/Hide OB, FVG, BOS, ChoCh
- Adjustable lookback periods
- Customizable colors
- Line extension length
RISK MANAGEMENT:
- Risk:Reward ratio (1:1 to 5:1)
- Stop Loss buffer (%)
- Auto TP/SL calculation
- Clear old lines option
━━━━━━━━━━━━━━━━━━━━━━━━━━━━━━━━━━━━━━━━
📈 RECOMMENDED SETTINGS:
CONSERVATIVE (High Quality):
- Require OB: ON
- Require FVG: ON
- Min Confluence: 3/4
- Result: 1-2 signals/day, 70-80% win rate
BALANCED (Recommended):
- Require OB: ON
- Require FVG: OFF
- Min Confluence: 2/4
- Result: 2-4 signals/day, 60-70% win rate
AGGRESSIVE (More Signals):
- Require OB: OFF
- Require FVG: OFF
- Min Confluence: 2/4
- Result: 3-6 signals/day, 55-65% win rate
━━━━━━━━━━━━━━━━━━━━━━━━━━━━━━━━━━━━━━━━
🎯 BEST PRACTICES:
✅ Trade 3/4 or 4/4 confluence signals only
✅ Confirm with higher timeframe (H4/Daily)
✅ Trade during kill zones (London/NY open)
✅ Use proper position sizing (1-2% risk)
✅ Wait for all components to align
✅ Respect stop losses
✅ Take partial profits at TP1
❌ Don't trade 1/4 confluence signals
❌ Don't ignore liquidity sweeps
❌ Don't trade against higher TF trend
❌ Don't overtrade (quality > quantity)
━━━━━━━━━━━━━━━━━━━━━━━━━━━━━━━━━━━━━━━━
⚡ SIGNAL TYPES:
🟢 BUY SIGNAL (Green Triangle)
- Appears when bullish confluence met
- Label shows "BUY ICT"
- Blue entry line + Red SL + Green/Lime TPs
- Long opportunity
🔴 SELL SIGNAL (Red Triangle)
- Appears when bearish confluence met
- Label shows "SELL ICT"
- Blue entry line + Red SL + Green/Lime TPs
- Short opportunity
━━━━━━━━━━━━━━━━━━━━━━━━━━━━━━━━━━━━━━━━
📊 SUITABLE FOR:
- Gold (XAUUSD) - Optimized
- Forex pairs (Major pairs)
- Indices (US30, NAS100, SPX500)
- Crypto (BTC, ETH - adjust settings)
Recommended Timeframes:
- 15M - Primary for scalping
- 5M - Entry refinement
- 1H - Swing trading
- H4/Daily - Trend confirmation
━━━━━━━━━━━━━━━━━━━━━━━━━━━━━━━━━━━━━━━━
⚠️ DISCLAIMER:
This indicator is for educational purposes only. Past performance does not guarantee future results. Always:
- Practice on demo account first
- Use proper risk management
- Never risk more than you can afford to lose
- Seek professional financial advice
- Understand that trading carries risk
━━━━━━━━━━━━━━━━━━━━━━━━━━━━━━━━━━━━━━━━
🎓 BASED ON:
- ICT (Inner Circle Trader) Concepts
- Smart Money Theory
- Order Flow Analysis
- Institutional Trading Zones
- Market Structure Theory
━━━━━━━━━━━━━━━━━━━━━━━━━━━━━━━━━━━━━━━━
📢 FEATURES SUMMARY:
✅ Confluence-based signals (not random)
✅ Order Blocks + FVG + Liquidity integration
✅ Persistent TP/SL lines (scroll-friendly)
✅ Smart dashboard (real-time info)
✅ Customizable requirements
✅ High-probability setups
✅ Professional trading approach
✅ Works on multiple assets
✅ Clean visual presentation
✅ Beginner to advanced friendly
━━━━━━━━━━━━━━━━━━━━━━━━━━━━━━━━━━━━━━━━
Trade smart. Trade with confluence. 🎯
#ICT #SmartMoney #OrderBlocks #FVG #Gold #Forex #TradingStrategy #Confluence

Gap & Crap Detector V1Gap & Crap Detector (5% Gap Detector + % Labels)
This indicator automatically detects stocks that gap up ≥ 5% (adjustable) from the previous day’s close and tracks whether the move holds or fails over the next three candles.
🔍 How It Works
Yellow % Label → Appears on every candle that gaps up ≥ 5%, showing the exact percentage gap.
Gap & Go (Green Label) → Triggers when the next 3 candles close above the gap-day low, signaling momentum continuation.
Gap & Crap (Red Label) → Triggers immediately if any of the next 3 candles close below the gap-day low, signaling momentum failure.
⚙️ Inputs & Customization
Gap % Threshold – Default 5% (adjustable)
Label Size – Tiny / Small / Normal / Large / Huge
Opacity Controls – Independently set transparency for yellow, red, and green labels
Gap & Go Offset – Adjust how high above the candle the green label appears
🧠 Usage
Use this tool to identify breakout gaps and verify whether price action confirms (Gap & Go) or fails (Gap & Crap).
Ideal for momentum traders, swing traders, Ovtlyr Plan M, and gap strategy backtesting.

Whale HunterThis script searches for gaps (above selected price gap percent), and mark it with a box (that can be extend right)
also it takes the buy price of Gap-Up and sell price of a Gap-Down and tries to cluster them into price ranges in a table (the space between price clusters is configurable), so you can see what are the most likely price range that the whales are buying and selling that makes the price move in a way that causes a X% gap,
so this indicator will show you where the whales are buying and selling

Session Gap Fill [LuxAlgo]The Session Gap Fill tool detects and highlights filled and unfilled price gaps between regular sessions. It features a dashboard with key statistics about the detected gaps.
The tool is highly customizable, allowing users to filter by different types of gaps and customize how they are displayed on the chart.
🔶 USAGE
By default, the tool detects all price gaps between sessions. A price gap is defined as a difference between the opening price of one session and the closing price of the previous session. In this case, the tool uses the opening price of the first bar of the session against the closing price of the previous bar.
A bullish gap is detected when the session open price is higher than the last close, and a bearish gap is detected when the session open price is lower than the last close.
Gaps represent a change in market sentiment, a difference in what market participants think between the close of one trading session and the open of the next.
What is useful to traders is not the gap itself, but how the market reacts to it.
Unfilled gaps occur when prices do not return to the previous session's closing price.
Filled gaps occur when prices come back to the previous session's close price.
By analyzing how markets react to gaps, traders can understand market sentiment, whether different prices are accepted or rejected, and take advantage of this information to position themselves in favor of bullish or bearish market sentiment.
Next, we will cover the Gap Type Filter and Statistics Dashboard.
🔹 Gap Type Filter
Traders can choose from three options: display all gaps, display only overlapping gaps, or display only non-overlapping gaps. All gaps are displayed by default.
An overlapping gap is defined when the first bar of the session has any price in common with the previous bar. No overlapping gap is defined when the two bars do not share any price levels.
As we will see in the next section, there are clear differences in market behavior around these types of gaps.
🔹 Statistics Dashboard
The Statistics Dashboard displays key metrics that help traders understand market behavior around each type of gap.
Gaps: The percentage of bullish and bearish gaps.
Filled: The percentage of filled bullish and bearish gaps.
Reversed: The percentage of filled gaps that move in favor of the gap
Bars Avg.: The average number of bars for a gap to be filled.
Now, let's analyze the chart on the left of the image to understand those stats. These are the stats for all gaps, both overlapping and non-overlapping.
Of the total, bullish gaps represent 55%, and bearish ones represent 44%. The gap bias is pretty balanced in this market.
The second statistic, Filled, shows that 63% of gaps are filled, both bullish and bearish. Therefore, there is a higher probability that a gap will be filled than not.
The third statistic is reversed. This is the percentage of filled gaps where prices move in favor of the gap. This applies to filled bullish gaps when the close of the session is above the open, and to filled bearish gaps when the close of the session is below the open. In other words, first there is a gap, then it fills, and finally it reverses. As we can see in the chart, this only happens 35% of the time for bullish gaps and 29% of the time for bearish gaps.
The last statistic is Bars Avg., which is the average number of bars for a gap to be filled. On average, it takes between one and two bars for both bullish and bearish gaps. On average, gaps fill quickly.
As we can see on the chart, selecting different types of gaps yields different statistics and market behavior. For example, overlapping gaps have a greater than 90% chance of being filled, whereas non-overlapping gaps have a less than 40% chance.
🔶 SETTINGS
Gap Type: Select the type of gap to display.
🔹 Dashboard
Dashboard: Enable or disable the dashboard.
Position: Select the location of the dashboard.
Size: Select the dashboard size.
🔹 Style
Filled Bullish Gap: Enable or disable this gap and choose the color.
Filled Bearish Gap: Enable or disable this gap and choose the color.
Unfilled Gap: Enable or disable this gap and choose the color.
Max Deviation Level: Enable or disable this level and choose the color.
Open Price Level: Enable or disable this level and choose the color.

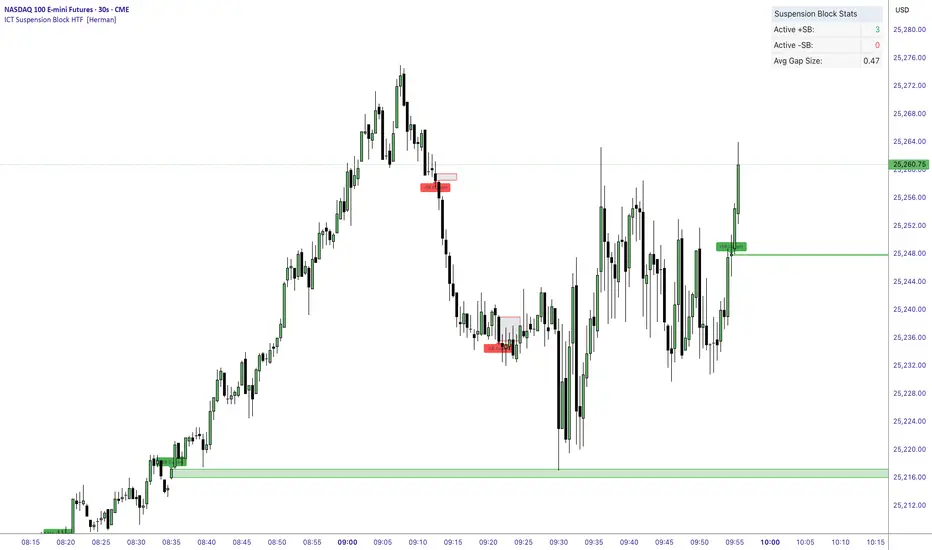
ICT Suspension Block HTF [Herman]ICT Suspension Block HTF — auto-marking +SB / –SB with MTF
ICT Suspension Block HTF automatically detects and plots Suspension Blocks (SB ) on your chart and optionally pulls them from higher timeframes. It’s built for traders who want precise, visual SB zones with mitigation/entry alerts and a compact stats panel.
What’s a Suspension Block (SB) ?
-A Suspension Block is a body-to-body price imbalance formed by three consecutive candles in the same direction where the bodies create sequential “gaps” (a brief pause in price efficiency).
-Bullish +SB: three bullish candles with body-to-body gaps stepping up.
-Bearish –SB: three bearish candles with body-to-body gaps stepping down.
This script highlights the actionable block zone (between the body levels of the middle candle) and lets you extend it forward for reaction tests.
Note: This tool implements a widely discussed definition of Suspension Blocks for educational/analytical use.
Key features
-Auto detection: Plots +SB/–SB the moment a valid 3-candle structure forms.
-Multi-Timeframe (MTF):
-Current timeframe detection (toggle).
-MTF1 & MTF2 pulls (e.g., 5m and 15m by default) to show HTF SBs directly on your LTF chart.
-Smart de-duplication: Avoids drawing near-identical blocks (tick-aware tolerance).
-Midpoint line (optional): Draws the 50% of the block for refined confluence.
-Forward extension: Choose how far to extend the zone in bars.
Alerts:
-New +SB/–SB formed
-Price enters a block
-Block mitigated
-Stats table: Lightweight panel showing active +SB / –SB counts and average detected gap size.
Theme aware : Light/Dark table themes matched to Herman Trading visuals.
Inputs (quick guide)
-Multi-Timeframe
-Enable Current Timeframe
-Enable MTF1 (timeframe input)
-Enable MTF2 (timeframe input)
Core
-Show Bullish / Bearish
-Show Labels
-Show 50% Midpoint
-Min Gap Size (% of candle body) — filters out weak structures
-Extension Length (bars) — how far to project the zone
-Max Number of Blocks — auto-prunes oldest drawings
-Label Size & Colors
-Alerts
-New Block Formation
-Price Entered Block
-Block Mitigation
-Table
-Show / Position
-Theme (Light / Dark)
How mitigation & entry work
-Entry alert: Fires when price crosses into a block (from outside).
-Mitigation: When price tags the block boundaries (top/bottom), the zone is marked mitigated (faded, no further extension).
-The stats panel updates counts in real time.
Practical tips
-Use HTF SBs (e.g., 15m/1h) on your execution timeframe for higher-quality reaction zones.
-Combine with your existing framework (session timing, liquidity sweeps, iFVG/MSS, etc.).
-Tighten/loosen Min Gap Size to match instrument volatility.
-Keep Max Blocks reasonable for performance on very low timeframes.
Disclaimer
This indicator is for education and analysis. It does not constitute financial advice. Trading involves risk; always do your own research and manage risk appropriately.
Fair Value Gap / iVFG / Imbalance / MTF SuiteDescription
This indicator detects Fair Value Gaps (FVGs) and Imbalances across up to 10 user-selected timeframes and manages them with precise retest handling and clean visualization options.
What’s unique
3-candle FVG detection per timeframe (no lookahead).
Retest handling: on the first touch the touched edge snaps to the retest wick and the zone recolors (fresh → retested).
Right-side projection limits to avoid endless extensions.
Deterministic multi-TF overlay: HTF zones are computed independently (lookahead off) and drawn in a stable, priority-based order.
iFVG / parked zones: optionally convert a filled gap into an iFVG (parked/blue) instead of deleting/greying it.
Optional Imbalance Add-on (3-candle), with split halves + 50% midline.
How it works (technical)
FVG logic (3 candles):
Bullish when low > high (gap up); Bearish when high < low (gap down).
The created box spans the untraded range of candle B and starts at time .
Retest behavior:
On the first wick-touch, the nearest boundary adapts to the wick extreme. If enabled, the box recolors to a “retested” palette.
Projection:
Boxes extend to the right; optional bar limit constrains length.
Display limits:
FIFO pruning per direction keeps only the newest N boxes; iFVG/grey pools can share or use separate limits.
Imbalance Add-on (optional):
Classic 3-candle imbalance; draws upper/lower halves and an optional 50% midline.
No lookahead / confirmation:
Calculations run with barmerge.lookahead_off; detection finalizes on bar close (repaint-free on close).
How to use
Treat fresh gaps as potential reaction zones or confluence with liquidity / structure.
Use retested gaps for continuation or rejection logic.
Limit right-projection and visible count to keep charts readable on lower TFs.
Combine with your own execution rules (entries, stops, partials).
Key settings
General: adjust/recolor on retest, right-side limit (bars).
Display Limits: max visible per direction; separate iFVG cap if desired.
Visuals: filled vs. outline, transparency, TF labels (auto or custom), label alignment.
Theme: presets (Pegasus Classic, Icefire, Solarized, Heatmap, Pastel, Monochrome) or Custom colors.
Timeframes: enable up to 10 TF slots (e.g., M1/M5/M15/H1/H4/D1…).
Add-on — Imbalance: enable/disable, midline on/off, filled/outline, colors.
Alerts
New Bullish FVG
New Bearish FVG
Add-on: New Bullish Imbalance
Add-on: New Bearish Imbalance
Notes & limitations
FVG detection is confirmed on bar close; intrabar retest recolor can occur as price interacts.
Historical rendering depends on chart history & session settings.
Many TFs + large box counts can be heavy; use projection limits and display caps for performance.
This tool does not generate trade signals; it visualizes inefficiencies for discretionary or rules-based workflows.
Disclaimer
For educational and informational purposes only. Not financial advice.
Access / Support: Invite-only. For access or assistance, please DM.

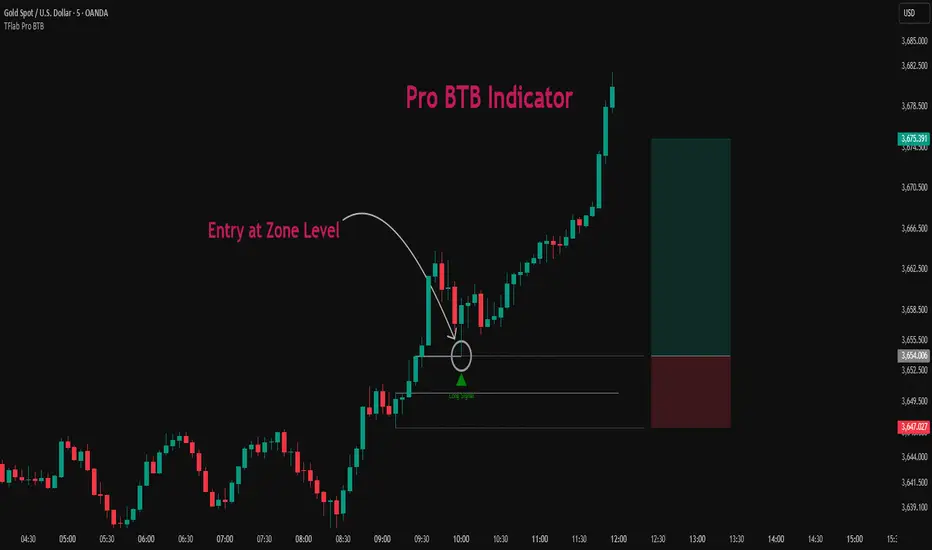
Pro BTB Pour Samadi Indicator [TradingFinder] Back To Breakeven🔵 Introduction
The Pro BTB (Professional Back To Breakeven) strategy is one of the most advanced price action setups, designed and taught by Mohammad Ali Poursamadi, an international Iranian trader and a well-known instructor of financial market analysis.
The main logic of this strategy is based on the natural behavior of the market :
Breakout of a key level: Price moves beyond an important support or resistance.
Retest / Back To Breakeven: Price returns to the broken level.
Continuation of the main trend: Entry at this point allows alignment with the dominant market direction.
To better understand Pro BTB, it is necessary to first know the concept of a Spike. A spike refers to a sudden and powerful movement of price in one direction, usually caused by heavy order flow. Such a move creates an Imbalance between buyers and sellers. Because the market does not have enough time to distribute orders fairly, it leaves an Inefficiency on the chart.
The direct result of this process is the formation of a Fair Value Gap (FVG) a gap between candles that shows trades were not distributed evenly. In simple terms: the spike is the cause, and Imbalance, Inefficiency, and FVG are its consequences.
In practice, Pro BTB works effectively in both bullish and bearish structures. In a Bullish Setup, a bullish spike first breaks a resistance level. Then, when price returns to that same level, a safe and low-risk buying opportunity is created. Conversely, in a Bearish Setup, a bearish spike breaks a support level, and when price comes back to the broken level, it provides the best conditions for a short entry. These two examples illustrate how Pro BTB logic provides precise, low-risk entries in both directions of the market.
🔵 How to Use
The Pro BTB (Back To Breakeven) strategy allows traders to enter precisely after price returns to the breakout level; this way the entry aligns with the natural market flow while risk is minimized. In practice, this method is simple yet powerful: first, identify a valid breakout on a key level, then wait for price to return to that level, and finally, take the entry in the direction of the main trend.
🟣 Bullish Setup
When a bullish spike occurs and a key resistance is broken, price usually returns to the same level. This level, now acting as support, provides the best opportunity for a long entry. In this scenario, the stop-loss is placed behind the breakout candle or slightly below the broken level, and the take-profit target should be defined with at least a 1:2 risk-to-reward ratio. With strong momentum, higher targets can also be considered.
🟣 Bearish Setup
In a bearish scenario, a bearish spike breaks a key support. After the breakout, price usually returns to the same level, which now acts as resistance. This creates the best conditions for a short entry. The stop-loss is placed behind the breakout candle or slightly above the broken level, while the take-profit target is set with a risk-to-reward ratio greater than 1:2.
🟣 General Rules of Pro BTB
To apply Pro BTB correctly, several key rules must be followed :
The breakout must be valid and occur on a key level.
Always wait for the retest; do not enter immediately after the breakout.
Entry should only happen when price touches the broken level and shows candlestick confirmation.
The stop-loss (SL) must be placed behind the breakout candle or the broken level.
The take-profit (TP) must always be at least twice the trade risk.
For higher reliability, the breakout should align with the trend on higher timeframes.
🟣 Six Entry Methods in Pro BTB
For greater flexibility, Pro BTB offers six standard entry methods :
Market Entry : Enter immediately at the breakout level.
Limit Order : Place a limit order on the breakout level.
Stop Order : Enter only after confirmation of continuation.
Confirmation Candle : Enter after a confirmation candle closes on the level.
Pattern Entry : Enter based on candlestick patterns such as Pin Bar or Engulfing.
Zone Entry : Enter from a zone instead of an exact point to account for market noise.
🔵 Setting
🟣 Spike Filter | Movement
Minimum Spike Bars : Defines the minimum number of consecutive candles required for a valid spike.
Movement Power : Enables or disables the momentum-based spike filter.
Movement Power Level : Sets the strength threshold; higher values filter out weaker moves and only detect strong spikes.
🟣 Spike Filter | Gap
Gap Filter : Enables or disables the gap filter.
Gap Type : Selects which type of gap should be detected (All Gaps, Significant, Structural, Major).
🟣 Spike Filter | Doji
Doji Tolerance : Defines whether doji candles are allowed within a spike.
Max Doji Body Ratio : Maximum ratio of body-to-total candle size for classifying a candle as a doji.
Max Doji in Spike Ratio : Maximum percentage of doji candles allowed within a spike.
🟣 Position Management
Stop-Loss Threshold : Enables or disables the stop-loss threshold feature.
Stop-Loss Threshold Value : Defines the value of the stop-loss threshold for risk management.
Risk-Reward Ratio : Sets the desired risk-to-reward ratio (e.g., 1:1 or 1:2).
Include SL Threshold in R:R : Determines whether the stop-loss threshold is included in risk-to-reward calculations.
🟣 Display Settings
Display Mode : Chooses between Setup (showing setups) or Signal (showing trade signals).
Show Entry Levels: Displays entry levels on the chart (buy/sell zones) when enabled
Only Display the Last Position : Displays only the most recent position on the chart when enabled.
Setup Width Drawing : Adjusts the visual width of the setup drawings on the chart for better visibility.
🟣 Alert
Alert : Enables alert notifications. When turned on, you can set TradingView alerts to receive notifications once the setup or signal conditions are met
🔵 Conclusion
The Pro BTB (Back To Breakeven) strategy is a smart and structured entry method based on natural market behavior after a breakout and retest of the broken level. It helps traders avoid emotional, high-risk entries by waiting for market confirmation and entering precisely at a point that aligns with the main trend and sits closest to the key level.
The simplicity of its rules, flexibility in entry methods, and a risk-to-reward ratio above 2 have made Pro BTB one of the most popular tools among price action traders. Nevertheless, as with any strategy, it is recommended to practice it in demo accounts or through personal backtesting before applying it to real trading, in order to find the entry conditions that best suit your trading style.
SP2L Pour Samadi Indicator [TradingFinder] Spike 2 Legs PA🔵 Introduction
The SP2L (Spike–2Leg) strategy, designed by Mohammad Ali Poursamadi, an international Iranian trader, is a simple yet powerful price action setup developed to identify precise entry points following sharp market movements.
A Spike refers to a sudden and rapid move in the market, usually triggered by a heavy flow of orders in one direction. This sharp movement creates an Imbalance between buyers and sellers. Since the market does not have time to trade evenly during such moves, it generates Inefficiency on the chart.
The direct result of a spike is usually the formation of a Fair Value Gap (FVG) — a space between candles indicating that trades were not distributed fairly. In simple terms, the spike is the cause, while Imbalance, Inefficiency, and FVG are its consequences.
🟣 How is a Spike formed?
Big Movement : A spike begins with a sharp and powerful move caused by heavy order flow in one direction.
Imbalance : This move disrupts the balance between buyers and sellers.
Inefficiency : Due to the speed of the move, the market fails to trade efficiently, leaving inefficiency on the chart.
Fair Value Gap (FVG) : The final outcome is a price gap between candles, highlighting unfair distribution of trades.
In SP2L, entries occur right after a spike. The entry logic is based on the structure of each candle’s Higher Lows (HLs) or Lower Highs (LHs).
When a spike occurs and candles consecutively form higher lows or lower highs :
In bullish conditions, each previous low becomes a potential Buy Entry.
In bearish conditions, each previous high becomes a potential Sell Entry.
🔵 How to Use
In the SP2L strategy, entries occur directly within the ongoing strong movement (the spike). A spike forms when heavy order flow pushes the market strongly in one direction, creating several large candles in sequence. This disrupts balance and leaves patterns such as Imbalance and FVG on the chart.
During such moves, the market does not necessarily retrace; instead, it continues strongly in the direction of the spike. The key principle in SP2L is that candles begin forming Higher Lows (HLs) in a bullish spike or Lower Highs (LHs) in a bearish spike. Each HL or LH acts as a potential entry level, but the actual entry only triggers once price returns to retest that level. This allows the trader to enter within a powerful wave while keeping stop-losses clear and risk controlled.
🟣 Bullish SP2L
When a bullish spike occurs, candles consecutively form Higher Lows. Each HL marks a potential entry. The entry is activated when price returns to that HL.
Stop-Loss (SL) : Placed below the candle where the spike originated, usually the lowest point before the sharp move.
Take-Profit (TP) : Defined based on classic risk-to-reward ratios, commonly TP1 = 1:1 and TP2 = 1:2. Stronger trends may allow extended targets.
🟣 Bearish SP2L
When a bearish spike occurs, candles consecutively form Lower Highs. Each LH marks a potential sell entry. The entry is triggered when price returns to retest that LH.
Stop-Loss (SL) : Placed above the candle where the bearish spike started, usually the highest point before the sharp drop.
Take-Profit (TP) : Similar to bullish setups, typically TP1 = 1:1 and TP2 = 1:2, with extended targets possible if bearish momentum continues.
🔵 Settings
🟣 Spike Filter | Movement
Minimum Spike Bars : Defines the minimum number of consecutive candles required for a valid spike.
Movement Power : Enables or disables the momentum-based spike filter.
Movement Power Level : Sets the strength threshold; higher values filter out weaker moves and only detect strong spikes.
🟣 Spike Filter | Gap
Gap Filter : Enables or disables the gap filter.
Gap Type : Selects which type of gap should be detected (All Gaps, Significant, Structural, Major).
🟣 Spike Filter | Doji
Doji Tolerance : Defines whether doji candles are allowed within a spike.
Max Doji Body Ratio : Maximum ratio of body-to-total candle size for classifying a candle as a doji.
Max Doji in Spike Ratio : Maximum percentage of doji candles allowed within a spike.
🟣 Trend Detection
Trend Detection : Enables or disables the trend detection module using dojis.
Max Doji Body Ratio : Maximum body-to-candle ratio used to classify a doji in trend calculations.
Candle Lookback : Number of candles used to calculate doji percentage for trend evaluation.
Max Doji in Trend Ratio : Maximum percentage of doji candles allowed within the lookback window for the trend to be valid.
🟣 Position Management
Stop-Loss Threshold : Enables or disables the stop-loss threshold feature.
Stop-Loss Threshold Value : Defines the value of the stop-loss threshold for risk management.
Risk-Reward Ratio : Sets the desired risk-to-reward ratio (e.g., 1:1 or 1:2).
Include SL Threshold in R:R : Determines whether the stop-loss threshold is included in risk-to-reward calculations.
🟣 Display Settings
Display Mode : Chooses between Setup (showing setups) or Signal (showing trade signals).
Only Display the Last Position : Displays only the most recent position on the chart when enabled.
🔵 Conclusion
The SP2L (Spike–2Leg) strategy, designed by Mohammad Ali Poursamadi, offers a simple yet effective framework for trading strong market flows. Built on the logic of spikes and candle structures (HLs and LHs), it identifies precise entry points directly within the main movement of the market, where risk is clear and reward is logical.
With transparent rules, defined stop-loss placement, and flexible risk management, SP2L proves especially effective in volatile markets such as forex, gold, and indices. Its simplicity makes it practical for both beginner traders and seasoned professionals.
In summary, SP2L helps traders avoid unnecessary complexity by focusing on spikes and consecutive HL/LH formations to capture accurate, low-risk entries.

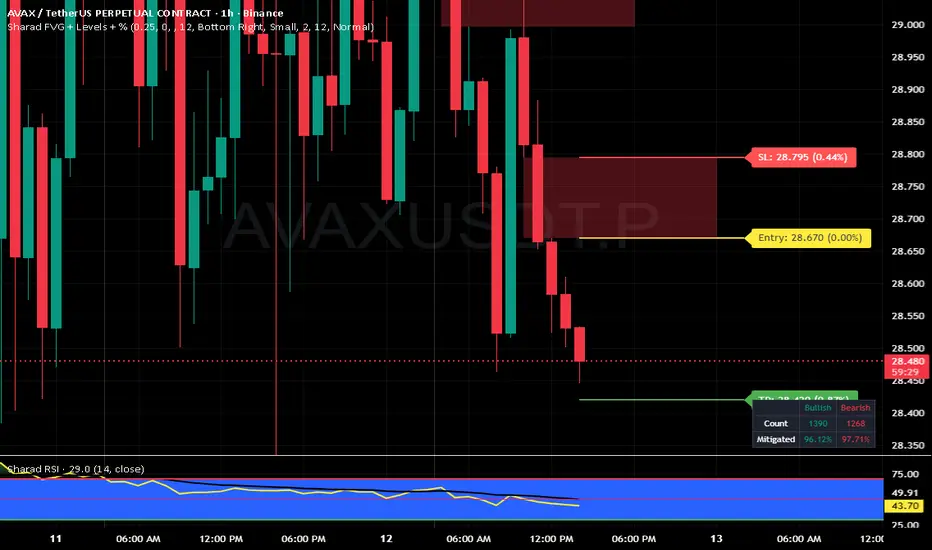
Sharad FVG (Last FVG SL/TP + Entry + % + Label Size)Sharad Fair Value Gap — Last FVG Entry, SL & TP (with % Labels)
What it is
A streamlined Fair Value Gap (FVG) tool that plots exact trading levels for the latest unmitigated FVG only:
Entry (yellow)
Stop-Loss (red)
Target (green) computed from a configurable Risk:Reward
Price and percentage distance printed on the right of each line
Optional dashboard and optional visualization of recent unmitigated/mitigated FVGs
The goal is simple: find the newest valid imbalance and give you just three actionable levels—no clutter.
How it detects FVGs
The script uses the standard 3-candle FVG logic (inspired by LuxAlgo’s implementation):
Bullish FVG forms when:
low > high and close > high and the gap size exceeds the Threshold filter.
The bullish gap is between high (lower bound) and low (upper bound).
Bearish FVG forms when:
high < low and close < low and the gap size exceeds the Threshold filter.
The bearish gap is between low (lower bound) and high (upper bound).
Threshold % filters small/weak gaps. You can also enable Auto, which estimates a dynamic threshold from recent candle ranges, so tiny imbalances don’t spam your chart in low-volatility regimes.
You may set Timeframe to detect FVGs on the chart timeframe or any higher/lower TF via request.security.
“Latest FVG only” levels (the core feature)
From the most recent unmitigated FVG (bullish or bearish), the script draws:
Entry
Bullish FVG → Entry = higher side of the gap (the gap max)
Bearish FVG → Entry = lower side of the gap (the gap min)
Stop-Loss (SL) = the opposite side of that same gap
Target (TP) = Entry + (Risk × R:R) for bulls, Entry − (Risk × R:R) for bears
where Risk = |Entry − SL| and R:R is your input (default 1:2)
Each line shows the price and its absolute % distance from Entry in parentheses—like TradingView’s long/short tool.
Alerts included
These are carried over from the base logic so you can build workflows:
Bullish FVG – when a new bullish gap is detected
Bearish FVG – when a new bearish gap is detected
Bullish FVG Mitigation – when a bullish gap is filled
Bearish FVG Mitigation – when a bearish gap is filled
Credits & License
Inspiration & base logic: LuxAlgo’s “Fair Value Gap ”.
This script: modified and extended by Sharad (Entry/SL/TP for latest FVG, price/% labels, label sizing, decluttered drawing).
License: This derivative keeps the original CC BY-NC-SA 4.0 license.
Attribution: Credit LuxAlgo for the original FVG approach and detection logic.
Non-Commercial: You may not use this for commercial purposes.
Share-Alike: If you remix/redistribute, you must use the same license and provide attribution.
Disclaimer:
Educational use only. Nothing in this script or its description is financial advice or a recommendation to buy/sell any asset. Markets involve substantial risk. Past performance and historical fill rates do not guarantee future results. You are solely responsible for your trading decisions and risk management. Data feeds, broker routing, spreads, slippage, and TradingView’s real-time behavior (especially with MTF) can affect outcomes. Test thoroughly on a demo account and consider multiple forms of confirmation before risking capital.
ICT NDOG/NWOGICT NDOG / NWOG — Opening Gap Visualizer
Plots daily (NDOG) and weekly (NWOG) opening gaps.
An opening gap is the price range between the previous close and the new session’s open.
Features:
• Optional border lines at gap high/low.
• Optional Consequent Encroachment line (50%).
• Optional Quadrant lines (25% and 75%).
• Color customization
• Custom NDOG and NWOG amount (separated)
*Also included in ICT ULT (All In One) Indicator
*Feel free to suggest improvement in the comments

Volumatic Fair Value Gaps [BigBeluga]🔵 OVERVIEW
The Volumatic Fair Value Gaps indicator detects and plots size-filtered Fair Value Gaps (FVGs) and immediately analyzes the bullish vs. bearish volume composition inside each gap. When an FVG forms, the tool samples volume from a 10× lower timeframe , splits it into Buy and Sell components, and overlays two compact bars whose percentages always sum to 100%. Each gap also shows its total traded volume . A live dashboard (top-right) summarizes how many bullish and bearish FVGs are currently active and their cumulative volumes—offering a quick read on directional participation and trend pressure.
🔵 CONCEPTS
FVGs (Fair Value Gaps) : Imbalance zones between three consecutive candles where price “skips” trading. The script plots bullish and bearish gaps and extends them until mitigated.
Size Filtering : Only significant gaps (by relative size percentile) are drawn, reducing noise and emphasizing meaningful imbalances.
// Gap Filters
float diff = close > open ? (low - high ) / low * 100 : (low - high) / high *100
float sizeFVG = diff / ta.percentile_nearest_rank(diff, 1000, 100) * 100
bool filterFVG = sizeFVG > 15
Volume Decomposition : For each FVG, the indicator inspects a 10× lower timeframe and aggregates volume of bullish vs. bearish candles inside the gap’s span.
100% Split Bars : Two inline bars per FVG display the % Bull and % Bear shares; their total is always 100%.
Total Gap Volume : A numeric label at the right edge of the FVG shows the total traded volume associated with that gap.
Mitigation Logic : Gaps are removed when price closes through (or touches via high/low—user-selectable) the opposite boundary.
Dashboard Summary : Counts and sums the active bullish/bearish FVGs and their total volumes to gauge directional dominance.
🔵 FEATURES
Bullish & Bearish FVG plotting with independent color controls and visibility toggles.
Adaptive size filter (percentile-based) to keep only impactful gaps.
Lower-TF volume sampling at 10× faster resolution for more granular Buy/Sell breakdown.
Per-FVG volume bars : two horizontal bars showing Bull % and Bear % (sum = 100%).
Per-FVG total volume label displayed at the right end of the gap’s body.
Mitigation source option : choose close or high/low for removing/invalidating gaps.
Overlap control : older overlapped gaps are cleaned to avoid clutter.
Auto-extension : active gaps extend right until mitigated.
Dashboard : shows count of bullish/bearish gaps on chart and cumulative volume totals for each side.
Performance safeguards : caps the number of active FVG boxes to maintain responsiveness.
🔵 HOW TO USE
Turn on/off FVG types : Enable Bullish FVG and/or Bearish FVG depending on your focus.
Tune the filter : The script already filters by relative size; if you need fewer (stronger) signals, increase the percentile threshold in code or reduce the number of displayed boxes.
Choose mitigation source :
close — stricter; gap is removed when a closing price crosses the boundary.
high/low — more sensitive; a wick through the boundary mitigates the gap.
Read the per-FVG bars :
A higher Bull % inside a bullish gap suggests constructive demand backing the imbalance.
A higher Bear % inside a bearish gap suggests supply is enforcing the imbalance.
Use total gap volume : Larger totals imply more meaningful interest at that imbalance; confluence with structure/HTF levels increases relevance.
Watch the dashboard : If bullish counts and cumulative volume exceed bearish, market pressure is likely skewed upward (and vice versa). Combine with trend tools or market structure for entries/exits.
Optional: hide volume bars : Disable Volume Bars when you want a cleaner FVG map while keeping total volume labels and the dashboard.
🔵 CONCLUSION
Volumatic Fair Value Gaps blends precise FVG detection with lower-timeframe volume analytics to show not only where imbalances exist but also who powers them. The per-gap Bull/Bear % bars, total volume labels, and the cumulative dashboard together provide a fast, high-signal read on directional participation. Use the tool to prioritize higher-quality gaps, align with trend bias, and time mitigations or continuations with greater confidence.

Parabolic Move Indicator for catching moves with Penny Stocks.
Catch the day’s first big moves! Track premarket gap-ups or gap-downs, then spot early momentum shifts using volume, RSI, VWAP, EMAs, and breakout levels—perfect for acting on strong intraday setups right at market open.
**Description:**
The Parabolic Move Scanner + VWAP Bands + EMAs indicator helps traders identify **high-probability intraday moves**, particularly immediately after market open. It is ideal for stocks that **gap up or down premarket, pull back slightly, and then show renewed strength or weakness** once regular trading begins.
The indicator combines multiple components for precise signals:
* **Relative Volume Filter: ** Highlights bars with unusually high activity to ensure signals are backed by real participation.
* **RSI Momentum Change: ** Detects sudden momentum shifts to identify early strength or weakness.
* **Recent Highs/Lows Breakout: ** Confirms price is breaking short-term resistance or support.
* **VWAP & Standard Deviation Bands: ** Provides intraday trend reference points, with optional daily reset.
* **Exponential Moving Averages (EMAs): ** Tracks trend across short, medium, and long-term intraday periods.
* **Visual Signals: ** Background highlights and horizontal breakout lines make it easy to spot key bars.
* **Alerts: ** Configurable alerts notify you of bullish or bearish parabolic moves.
**Optimal Use Case: **
Use in the first 15–30 minutes after market open at 1 minute Time Frame. Best for **stocks showing a premarket gap followed by a pullback**, then resuming strength (bullish) or weakness (bearish). The combination of **volume, RSI, breakouts, VWAP, and EMAs** ensures you identify the **day’s biggest marktet open moves especially with penny stocks moves** with higher confidence.
---
### **Recommended Settings**
**Component** | **Recommended Setting** | **Description / Purpose**
| **Volume Average Length** | 20 bars | Period for calculating average volume to detect relative spikes. |
| **Volume Multiplier** | 2.0 | Current bar volume must exceed 2× average to signal high activity. |
| **RSI Length** | 7 bars | Short-term RSI period to measure momentum changes. |
| **RSI Change Threshold** | 7 | Minimum RSI change required to trigger momentum signal. |
| **Recent Highs Lookback** | 5 bars | Number of bars to check for short-term breakout levels. |
| **Horizontal Line Length** | 10 bars | Length of horizontal breakout line drawn on the chart. |
| **Horizontal Line Color** | Green (bullish) / Red (bearish) | Visual identification of breakout levels. |
| **Horizontal Line Thickness** | 1 | Line width for breakout visualization. |
| **VWAP Source** | hlc3 | Price source for VWAP calculation. |
| **VWAP Bands Multipliers** | 1×, 2×, 3× | Standard deviation multiples for intraday bands.
| **VWAP Daily Reset** | Enabled | Resets VWAP at the start of each trading day.
| **EMA Lengths** | 9, 13, 20, 33, 50 | Short, medium, and long-term EMAs to track intraday trend. |
| **Enable Bearish Signals** | True | Allows detection of bearish parabolic moves. |
|

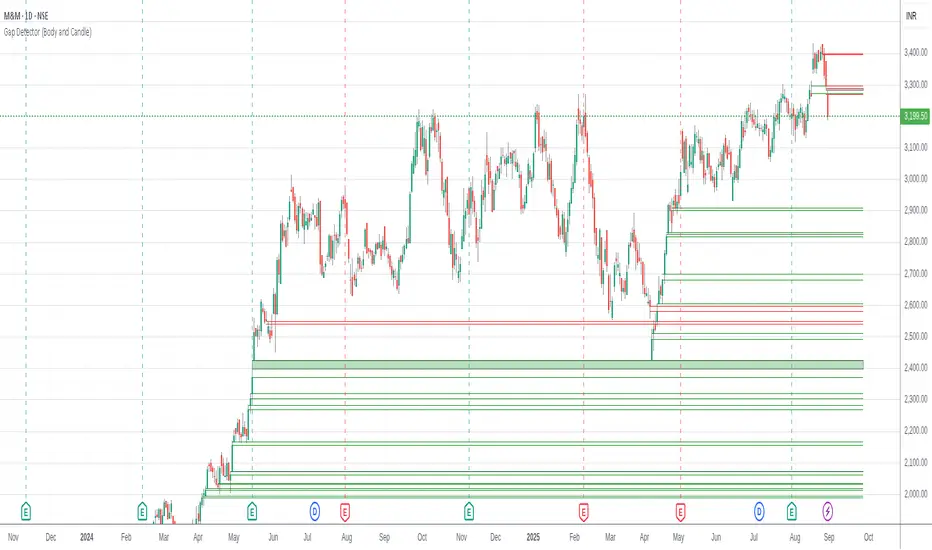
Gap Detector (Body and Candle)Finds/Detects gaps between candles and candle bodies for any chart/timeframe with O(n+delta) performance.
Candle Gaps (between wicks) act as strong support or resistance. They are drawn as solid boxes.
Body Gaps (ignores wicks) act as mild support or resistance. They are depicted with lines.
Adjust the settings for candle/body gap width, smaller the time frame, smaller the gap.
Adjust max historical bars to fine tune performance on your system/setup. The more historical bars the script scans, more time required to load the chart. At times based on system configuration, TradingView may timeout the script due to too many bars. Reducing the max bars helps in this scenario.
This is a revamped version of "Body Gap Detector".
Happy charting !
Fair Value Gap Suite Adrian V1.0.0Brief description
The “FVG Suite” identifies fair value gaps across multiple time units, evaluates them with a displacement score, optionally filters them according to market structure events (BOS/CHOCH), and provides context-based alerts for first touch, partial and full fills, and invalidation. The aim is to show only high-quality imbalances and trade them based on rules.
What makes the script unique (originality/added value)
Displacement score: Strength of the impulse movement as a combination of (body/ATR, range/ATR, volume Z-score).
MTF aggregator: FVGs from higher timeframes are collected, ranked, and displayed as zones on the active chart (including overlap clustering).
Structure context: Optionally, only FVGs after confirmed BOS/CHOCH in the trend direction, including premium/discount evaluation relative to the HTF range.
Adaptive invalidation: FVG expires after candles, opposing BOS or defined time (e.g., end of session).
Session/instrument filter: Time window (e.g., NY/LDN), minimum tick size, ATR-based minimum gap.
Smart fill logic: Distinguishes between first touch, partial fill (≥ %), full fill (100%); alarms per event.
Statistics overlay (optional): Hit rate/expectancy per TF & session for fine-tuning the filters.
How it works (conceptually)
FVG definition (3-candle pattern): Bullish if High < Low (bearish analog). Size = gap span in points.
Quality score:Score = w1*(|Body|/ATR) + w2*(Range/ATR) + w3*(Volume-Z), normalized to 0–100.
MTF scan: List of higher TFs: (customizable). Findings are merged, ranked, and displayed as zones with priority (color/opacity).
Context filter: Only FVGs that emerge after BOS/CHOCH in the direction of the current trend; optional exclusion in premium/discount areas.
Invalidation & alerts: A zone is considered active until the invalidation rule takes effect. Alerts are triggered upon: initial contact, partial/full filling, invalidation.
Important inputs
Min. FVG size: × ATRor ticks/points
Min. displacement score: (0–100)
MTF list:
BOS/CHOCH filter: On/Off (Lookback candles)
Session filter: NY/LDN/Asia (local time, weekend toggle)
Invalidation: maxBars = , Opposite BOS = On/Off, Session End = On/Off
Fill definitions: Partial fill ≥ % of the gap; Full fill = 100%
Overlay options: Zone color/transparency, HTF label, statistics overlay On/Off
Alerts (names & triggers)
FVG Suite – First Touch: Price touches an active FVG zone for the first time.
FVG Suite – Partial Fill: Partial fill ≥ configured threshold.
FVG Suite – Full Fill: Gap completely filled.
FVG Suite – Invalidated: Zone invalidated by rules. (Alert message contains: symbol, TF of the zone, direction, score, size, trigger rule.)
Use (best practices)
Trade in the trend direction with BOS/CHOCH filter; target counter-imbalances/liquidity pools.
Use session filters to avoid news spikes/illiquid periods.
Calibrate parameters for each market/TF (ATR/volume profiles differ).
Limitations
Structure labels can be reevaluated for new highs/lows (repainting of labels, not of FVG finds).
Spreads/news can generate “pseudo fills.”
Backtests/statistics are sample-dependent; no guarantee of results.
Changelog
v1.0 – First release (score model, MTF aggregator, BOS/CHOCH filter, fill alerts).
Credits
FVG concept: public ICT/SMC literature (general idea). Implementation/scoring, MTF ranking, smart fill logic: own development.
Note/disclaimer
No financial advice. For educational purposes only. Trading involves high risk; use stop losses and a fixed risk budget.
BTC CME Futures Gaps (BTCGapHunt_CME)BTC CME Futures Gaps Indicator
Overview
This indicator visualises price gaps between the daily close and open of Bitcoin CME futures (CME:BTC1!). These gaps are often revisited ("filled") by market price action and may serve as technical targets.
Thanks
... to Maven and the Blockchain Masons (x.com/Masons_DAO) to push me on this topic.
What Is a CME Gap?
CME Bitcoin Futures do not trade 24/7. Gaps form when the market reopens at a different price than where it last closed.
Gaps are often used as support/resistance or liquidity targets.
This indicator tracks, visualises, and alerts on these gaps.
Key Features
Automatic gap detection using daily open/close on CME:BTC1!
Dynamic gap size threshold based on ATR (Average True Range)
Highlight unfilled gaps and track partial fills visually
Alerts for gap formation and fill events
Parameter overlay showing real-time settings
Supported and Overrideable Parameters
ATR Length: Defines the lookback period for ATR calculation (default: 14)
Gap Size Multiplier: Multiplies the ATR to set the dynamic gap threshold (default: 1.0)
Proximity Threshold: Price distance from gap edge to consider it filled (default: 100 USD)
Max Gaps Tracked: Maximum number of concurrent gaps shown (default: 50)
Alerts Enabled: Toggle alerts for gap formation and gap fill events
How the Gap Size Is Calculated
Minimum Gap Size = ATR(14) * Gap Size Multiplier
ATR Length and Gap Size Multiplier are configurable.
Gap threshold adjusts dynamically with market volatility.
Visual Guide
Red Box: Fully unfilled gap
Lemon Yellow Box: Partially filled gap
Right Margin Boxes: Snapshot of unfilled gaps for quick access
Top-Right Panel: Current ATR, Gap Size, Thresholds, etc.
Alerts
Gap Formed: A new gap is detected.
Gap Filled: The gap is either partially or fully filled.
Recommended Timeframes
1H, 4H, 1D (best resolution)
Designed for BTC spot/perpetual charts (e.g., BTCUSD, BTCUSDT)
How To Use
Add the script to your BTC chart.
Monitor red/yellow boxes for unfilled gaps.
Check config panel for current threshold and settings.
Enable alerts via TradingView for real-time updates.
Notes
Up to 50 gaps are tracked (adjustable).
Data source: CME futures via request.security.
All visuals and alerts are time-synced with your chart.
Disclaimer
This script is for educational purposes only. Trade at your own risk.

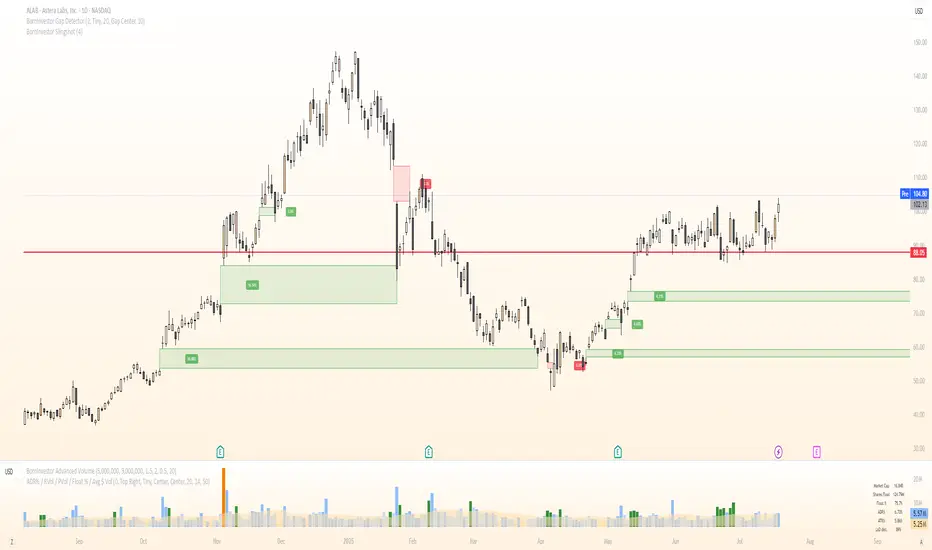
BornInvestor Gap Detector📈 BornInvestor Gap Detector
The BornInvestor Gap Detector is a powerful visual tool for identifying and analyzing price gaps on any chart. It automatically detects up and down gaps, highlights them with customizable boxes, and offers detailed labeling and alerting functionality.
🔍 Key Features:
Automatic Detection of bullish and bearish gaps based on customizable deviation settings.
Visual Highlighting of gaps using colored boxes with optional trail length limitation.
Gap Size Labels showing the percentage size of the gap, with the ability to display them only on the most recent N gaps.
Alerts for:
New gap appearance
Gap fully or partially closed
Price entering a gap zone (ideal for breakout/backfill strategies)
Customizable Colors for up/down gap borders and backgrounds.
Optional Message when no gaps are found on the current chart.
💡 Usefulness:
Gaps are an edge. They frequently act as support or resistance—especially on the first retest—when aligned with high-volume areas or other key price zones. Many strong stock moves begin with gaps, a concept central to strategies like Episodic Pivots.
This indicator helps you:
Identify gaps as potential entry zones on secondary setups
Quantify gaps via percentage size
Filter gaps based on size to suit your specific trading approach
Set alerts when price enters a gap or meets your custom criteria
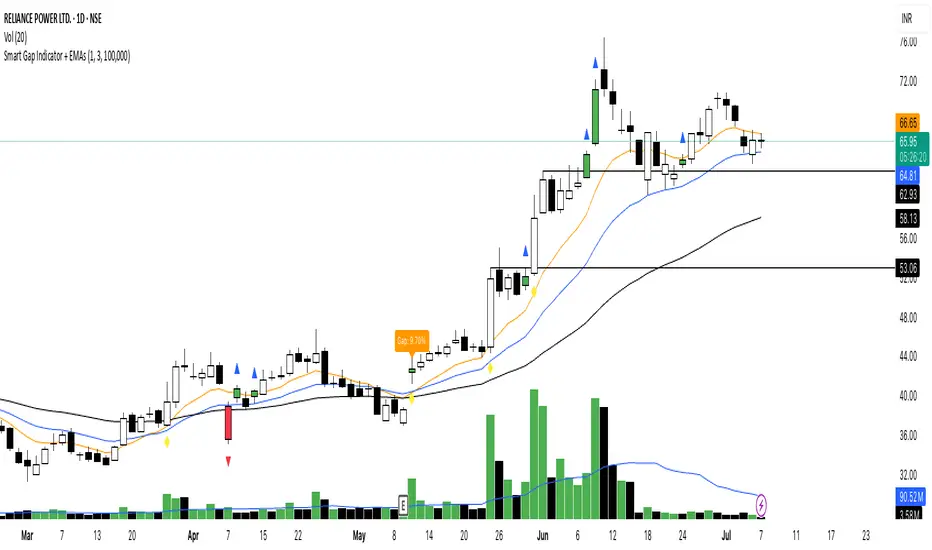
Smart Gap Indicator + EMAs📈 Smart Gap Indicator + EMAs
Spot high-impact gaps with precision and confidence.
🔍 What it does:
This tool identifies and highlights strategic price gaps that often precede strong directional moves. It filters out noise by combining advanced logic with volume activity and trend bias, helping you focus on the most relevant setups.
📊 Key Features:
Smart Gap Detection – Automatically detects meaningful gap up/down events based on dynamic thresholds.
EMA Trend Filter – Optional multi-EMA filter (10, 21, 50) to help align trades with the prevailing market trend.
Volume Spike Signal – Highlights volume surges that may indicate institutional involvement.
Clean Visuals – Configurable labels, shapes, and optional gap fill lines to aid quick interpretation.
Gap Performance Table – Summarizes recent gap activity to assess directional bias.
⚠️ Built-in Alerts:
Gap Up
Gap Down
Gap + Volume Spike
💡 Made by a trader, for traders.
Whether you're a swing trader, gap hunter, or momentum follower—this tool was crafted to give you an edge where it matters most: timing.