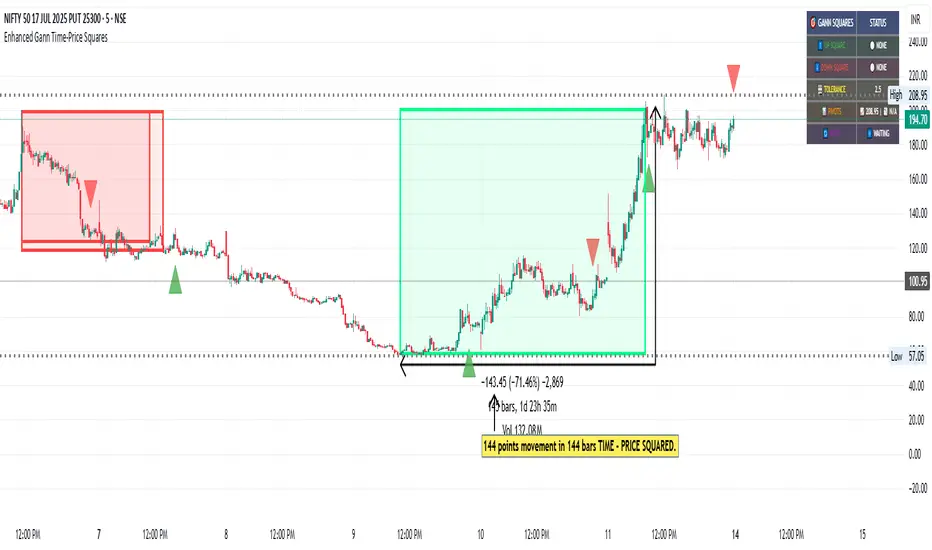
Enhanced Gann Time-Price SquaresEnhanced Gann Time-Price Squares Indicator
A comprehensive Pine Script indicator that identifies and visualizes W.D. Gann's time-price square formations on your charts. This tool helps traders spot potential market turning points where time and price movements align according to Gann's legendary market theories.
Key Features:
Automatic Square Detection - Identifies completed squares where price movement equals time movement
Future Projections - Shows forming squares with projected completion points
Pivot Integration - Automatically detects pivot highs/lows as square starting points
Visual Clarity - Clean box outlines with customizable colors and styles
Smart Filtering - Prevents overlapping squares and includes minimum move thresholds
Real-time Status - Information table showing current square formations
How to Use:
The indicator draws boxes when price moves from pivot points equal the time elapsed (number of bars). Green squares indicate upward movements, red squares show downward movements. Dashed lines show forming squares, while dotted lines project where they might complete.
Settings:
Adjust pivot sensitivity and minimum price moves
Customize tolerance for time-price matching
Toggle projections, labels, and visual elements
Fine-tune colors and line styles
Perfect for Gann theory practitioners and traders looking for time-based market analysis. The squares often coincide with significant support/resistance levels and potential reversal points.
Compatible with all timeframes and instruments.
More updates to follow
간
Gann Single SwingGann Single Swing Indicator
The Gann Single Swing indicator is a sophisticated tool rooted in the geometric and cyclical market analysis principles pioneered by William Delbert Gann. Designed for traders who value deep market structure analysis, this indicator leverages the interplay of price and time to identify key support and resistance zones, potential reversal points, and critical price-time synchronization areas. Its unique approach makes it an invaluable instrument for those employing Gann-based methodologies or seeking a systematic way to decode complex market dynamics.
What It Does
The Gann Single Swing indicator is built to pinpoint high-probability zones for price action, such as support and resistance levels, where traders can logically initiate long or short positions. By analyzing a user-defined price swing (a move between two selected points, such as a local high and low), the indicator constructs a geometric framework that reveals hidden patterns in market movements. It identifies:
Support and Resistance Zones: Key price levels where the market is likely to reverse or consolidate.
Temporal Reversal Zones: Specific time periods where price reversals are more probable due to time-price resonance.
Price-Time Synchronization Points: Areas where price and time align to signal potential market turning points.
How It Works
The indicator’s algorithm is grounded in Gann’s geometric principles, focusing on the relationship between price movements and time cycles. Here’s a high-level overview of its process:
Swing Selection: Traders select two key points on the chart (e.g., a local minimum and maximum) to define a price swing.
Channel Construction: The swing is encapsulated within a dynamic channel, forming the foundation of the geometric model.
Gann Fan Application: A Gann Fan is applied to the channel to calculate critical angles, representing the balance between price and time. These angles help identify resonant points that align with the channel’s central axis.
Squared Channel Analysis: The algorithm creates “squared” channels, geometrically derived sub-structures, analyzed for intersections and alignments to project external support and resistance zones beyond the base swing.
Internal Zone Mapping: Within the base swing, a reverse Gann Fan maps internal zones, highlighting areas of price-time convergence that may act as dynamic support or resistance.
Zone Projection: The indicator synthesizes these calculations to plot precise zones of support, resistance, and potential reversals, both spatially (price levels) and temporally (time-based zones).
While the exact mathematical formulations remain proprietary, the indicator relies on time-tested Gann techniques, such as angle-based analysis and cyclical resonance, to deliver actionable insights.
How to Use It
Select the Swing: Identify two significant points on the chart (e.g., a recent high and low) to define the swing. These points serve as the anchor for the indicator’s calculations.
Interpret the Zones: The indicator plots support and resistance zones (both price-based and time-based). Look for price action near these zones to identify potential entry or exit points.
Combine with Other Tools: For best results, use alongside other Gann-based tools (e.g., Gann Squares or Time Cycles) or traditional technical analysis (e.g., trendlines, Fibonacci levels) to confirm signals.
Monitor Temporal Zones: Pay attention to time-based reversal zones, as they may indicate when a price move is likely to occur, enhancing trade timing.
Why It’s Unique
Unlike conventional indicators that rely on moving averages, RSI, or other common metrics, the Gann Single Swing indicator offers a proprietary blend of Gann’s geometric and cyclical principles. Its ability to integrate price and time into a cohesive model sets it apart, providing traders with a deeper understanding of market structure. The indicator does not use public domain code or standard technical indicators, ensuring originality and value for traders seeking advanced tools.
Who It’s For
This indicator is ideal for:
Traders familiar with Gann’s methodologies who want to automate and enhance their geometric analysis.
Advanced traders looking to uncover hidden market patterns through price-time relationships.
Those seeking a robust, non-traditional tool for identifying high-probability trade setups.
The Gann Single Swing indicator is not a black-box forecasting tool but a powerful framework for dissecting market behavior. By combining user-defined inputs with sophisticated geometric calculations, it empowers traders to make informed decisions based on the timeless principles of Gann’s market philosophy.

Gann Swing PointsIndicator Logic
This is a GANN-style swing indicator that classifies bars based on their high/low structure relative to the previous bar.
I strongly encourage you to replay bars on Tradingview using this indicator to get a sense of how it creates pivot (or swing) points
Bar Classification:
Up-Bar (direction: 'up'): Higher High and Higher Low (HH/HL)
Down-Bar (direction: 'down'): Lower High and Lower Low (LH/LL)
Outside-Bar (generates 2 directions):
Green: 'down' then 'up'
Red: 'up' then 'down'
Inside-Bar: No direction generated (HL/LH)
Swing Line Logic
The swing line continues in the current direction until n opposite directions are detected.
n is the "n-direction" parameter (commonly set to 2, so 2 consecutive opposite direction is needed to turn the swing)
When n opposing directions occur, the swing turns, creating a pivot point
Inside bar is ignored, so e.g up-bar -> inside-bar -> up-bar generates "up", "up" direction
A top pivot is formed when the swing turns down
A bottom pivot is formed when it turns up
Note: This swing logic is inherently lagging — it only confirms tops/bottoms after the fact
This swing structure gives the system a clear and noise-resistant way to identify pivot points (swing-points)

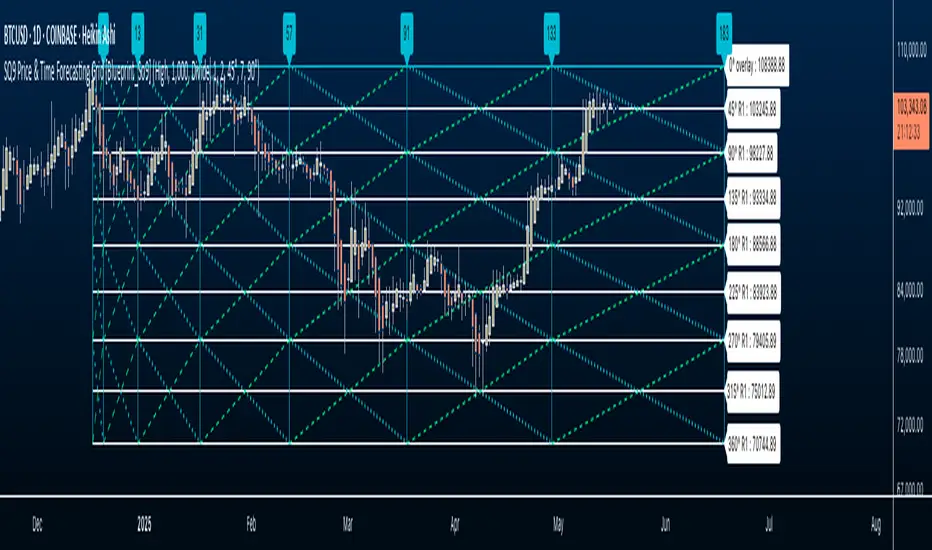
Square of Nine Price & Time Forecasting Grid📐 Square of Nine Price and Time Forecasting Grid
Adapted and Interpreted by Javonnii | Inspired by Patrick Mikula
The So9 Price and Time Forecasting Grid is a self-contained forecasting grid that allows traders to visually forecast levels in both price and time, using only Square of Nine calculations.
This indicator dynamically generates an expandable grid of angles, levels, and timeline based on the placement of a single anchor point, typically from a significant high or low. It requires no manual drawing or external tools.
🔍 How It Works:
The So9 Price and Time Forecasting Grid uses Square of Nine calculation and rotational logic to project price levels, time intervals, and internal angular structure from a single anchor point.
Once applied to the chart, the grid self-generates:
• Price levels using 360° degree Square of Nine intervals
• Timeline projections using Square of Nine progression intervals
• Diagonal and cardinal cross angles that dynamically propagate from the anchor
• Granular diagonal angle control, letting you refine internal grid resolution for tighter price structural analysis in relation to the forecasting grid.
⚙️ Setup Instructions
1. Select a Significant Pivot:
After loading the indicator, you’ll be prompted to select a significant high or low on your chart. This serves as the anchor point for the entire grid.
2. Price Grid Auto-Population:
Once anchored, Square of Nine price levels will automatically populate on the chart. These levels reflect Dynamic Square of Nine intervals from the anchor using rotational math.
3. Scale to Fit Your Instrument:
Use the provided UI settings to scale the grid to fit your instrument’s price structure. This ensures the levels align with actual historical price.
4. Engage Timelines:
Activate the timeline progression feature to generate forward-projected time intervals using Square of Nine-based timing logic. The entire grid can be extended up to 500 bars ahead on any timeframe.
5. Add Diagonal Angles:
Select which Square of Nine angle resolution you’d like to overlay from either the cardinal cross or diagonal cross based on Square of Nine geometry. This will populate diagonal levels within the grid, creating a full structural grid.
6. Customize Visuals:
You can toggle or hide price levels, timelines, or diagonal angles independently.
The entire grid can also be color-coded and customized to match your charting preferences.
All elements are plotted automatically. There is no manual drawing or calculation required. You can toggle the components on or off based on your workflow:
• Hide price levels if you just want time lines.
• Focus on angles without price levels.
• Use timeline progression independently.
📘 Attribution and Permission
This tool is inspired by concepts from "The Definitive Guide to Forecasting Using W.D. Gann’s Square of Nine" by Patrick Mikula.
The indicator reflects my personal adaptation and implementation of these forecasting principles within TradingView.
I have asked for and received permission from Patrick Mikula to share and publish tools derived from his work.
This applies to this script and to any other indicators I’ve developed that incorporate or build upon his material.
Documentation of this permission is available upon request.
Credit and respect to Patrick Mikula for his contributions to Gann-based research and for granting me the opportunity to share these tools with others.
ABC Market stage judgmentABC Stage Judgment Indicators · Introduction
Core ideology
The market situation is divided into three stages:
Zone B (Low Volatility Accumulation): Extremely low volatility, no trend, institutions accumulate chips.
Zone A (oscillation zone): The volatility has rebounded but there is no unilateral trend, suitable for short-term high selling and low buying.
Zone C (Trend Explosion): The volatility has significantly expanded and the trend is strong, making it profitable to follow the position.
Core Indicators
Volatility measurement
Bollinger Bands Width (BBWidth): 20 cycle moving average ± 2 σ bandwidth, reflecting relative volatility compression/release;
ATR (Average True Volatility): measures the absolute intensity of price volatility.
Trend Strength
ADX (Average Trend Index): measures the strength of a trend (without distinguishing direction),
ADX<20 → No trend (Zone B/A)
ADX>25 → Significant trend (Zone C)
Stage division logic
Zone B: Both BWidth and ATR are less than the set multiple of their respective historical means, and ADX is less than the threshold → "quiet bottoming out";
Zone C: ADX>threshold, and BBWidth or ATR>set multiple of their respective historical means, trading volume amplification → "trend takeoff";
Zone A: Time periods that do not belong to B/C are all classified as oscillation zones.
Optional enhanced filtering
Direction confirmation (+DI/- DI): avoid going against the trend;
Multi cycle verification (4H): in line with the trend of large-scale;
Momentum filtering (ROC/MACD/RSI): ensuring kinetic energy support;
ATR slope: Confirm the release of fluctuations;
Breakthrough Confirmation: Enter only after the breakthrough is confirmed at the closing level.
These filters are turned off by default and can be selected with one click for different scenarios such as "high-level oscillation", "low-level bottoming", "planting trees in the middle", etc.
usage
Multi cycle switching: Built in "5-minute/1-hour" two main cycles for free switching;
Visualization: The background color and labels display the current Zone at a glance;
Alarm: Stage switching automatically triggers an Alert, which can be pushed through mobile phones/Telegram.

Yearly History Calendar-Aligned Price up to 10 Years)Overview
This indicator helps traders compare historical price patterns from the past 10 calendar years with the current price action. It overlays translucent lines (polylines) for each year’s price data on the same calendar dates, providing a visual reference for recurring trends. A dynamic table at the top of the chart summarizes the active years, their price sources, and history retention settings.
Key Features
Historical Projections
Displays price data from the last 10 years (e.g., January 5, 2023 vs. January 5, 2024).
Price Source Selection
Choose from Open, Low, High, Close, or HL2 ((High + Low)/2) for historical alignment.
The selected source is shown in the legend table.
Bulk Control Toggles
Show All Years : Display all 10 years simultaneously.
Keep History for All : Preserve historical lines on year transitions.
Hide History for All : Automatically delete old lines to update with current data.
Individual Year Settings
Toggle visibility for each year (-1 to -10) independently.
Customize color and line width for each year.
Control whether to keep or delete historical lines for specific years.
Visual Alignment Aids
Vertical lines mark yearly transitions for reference.
Polylines are semi-transparent for clarity.
Dynamic Legend Table
Shows active years, their price sources, and history status (On/Off).
Updates automatically when settings change.
How to Use
Configure Settings
Projection Years : Select how many years to display (1–10).
Price Source : Choose Open, Low, High, Close, or HL2 for historical alignment.
History Precision : Set granularity (Daily, 60m, or 15m).
Daily (D) is recommended for long-term analysis (covers 10 years).
60m/15m provides finer precision but may only cover 1–3 years due to data limits.
Adjust Visibility & History
Show Year -X : Enable/disable specific years for comparison.
Keep History for Year -X : Choose whether to retain historical lines or delete them on new year transitions.
Bulk Controls
Show All Years : Display all 10 years at once (overrides individual toggles).
Keep History for All / Hide History for All : Globally enable/disable history retention for all years.
Customize Appearance
Line Width : Adjust polyline thickness for better visibility.
Colors : Assign unique colors to each year for easy identification.
Interpret the Legend Table
The table shows:
Year : Label (e.g., "Year -1").
Source : The selected price type (e.g., "Close", "HL2").
Keep History : Indicates whether lines are preserved (On) or deleted (Off).
Tips for Optimal Use
Use Daily Timeframes for Long-Term Analysis :
Daily (1D) allows 10+ years of data. Smaller timeframes (60m/15m) may have limited historical coverage.
Compare Recurring Patterns :
Look for overlaps between historical polylines and current price to identify potential support/resistance levels.
Customize Colors & Widths :
Use contrasting colors for years you want to highlight. Adjust line widths to avoid clutter.
Leverage Global Toggles :
Enable Show All Years for a quick overview. Use Keep History for All to maintain continuity across transitions.
Example Workflow
Set Up :
Select Projection Years = 5.
Choose Price Source = Close.
Set History Precision = 1D for long-term data.
Customize :
Enable Show Year -1 to Show Year -5.
Assign distinct colors to each year.
Disable Keep History for All to ensure lines update on year transitions.
Analyze :
Observe how the 2023 close prices align with 2024’s price action.
Use vertical lines to identify yearly boundaries.
Common Questions
Why are some years missing?
Ensure the chart has sufficient historical data (e.g., daily charts cover 10 years, 60m/15m may only cover 1–3 years).
How do I update the data?
Adjust the Price Source or toggle years/history settings. The legend table updates automatically.

Range + VWAP + Gann Levels + ZL AMA + Gann Square Num# Multi-Strategy Market Analysis Indicator
## Overview
This comprehensive indicator combines several powerful technical analysis tools to help traders identify potential price movements, market trends, and key support/resistance levels. By integrating price range prediction, volume-weighted averages, adaptive moving averages, and Gann-based mathematical levels, this indicator provides a complete toolkit for market analysis.
## Components & How They Work
### 1. Range Calculator
**What it does:** Calculates the expected price range based on current volatility, useful for predicting potential price movements during a specific time period.
**How it works:**
- Uses the current price level and VIX (Volatility Index) to estimate how far the price might move in a given number of days
- Applies the square root of time principle (volatility grows with the square root of time)
- Displays upper and lower bounds of the expected price range
- Shows the calculation details in a convenient table
**How to use it:**
- Enter the current price level, VIX value, and number of days
- red line indicates potential resistance
- green line indicates potential support
- Useful for options trading, setting stop-loss levels, or preparing for upcoming market events
### 2. Gann Square Numbers
**What it does:** Identifies mathematically significant price levels based on square numbers.
**How it works:**
- Takes the square root of the current price
- Calculates the next 5 square numbers above the current price (upper levels)
- Calculates the 5 square numbers below the current price (lower levels)
- Draws these levels as horizontal lines on the chart
**How to use it:**
- Pink lines (upper levels) show potential resistance levels
- Blue lines (lower levels) show potential support levels
- These mathematical levels often coincide with significant market reactions
- Based on W.D. Gann's theory that price tends to respect mathematical square numbers
### 3. Zero Lag Adaptive Moving Average (AMA)
Bullish Scenario
Bearish Scenario
**What it does:** Provides a dynamic moving average that adapts to changing market conditions, reducing lag during trends while filtering noise during sideways markets.
**How it works:**
- Calculates an "Efficiency Ratio" that measures the directional movement relative to volatility
- Adjusts the smoothing factor based on market efficiency
- Uses a faster smoothing factor during trending markets and slower smoothing during sideways markets
- Background color changes to indicate the trend direction (green for uptrend, red for downtrend)
**How to use it:**
- When price is above the AMA line with green background: Strong uptrend
- When price is below the AMA line with red background: Strong downtrend
- Helpful for trend identification and potential entry/exit points
### 4. Gann Stepline Levels
**What it does:** Creates dynamic support and resistance levels based on multiple SMAs (Simple Moving Averages) of different lengths.
**How it works:**
- Calculates two key dynamic levels:
- Gann 50% Level: Average of 90 and 144-period SMAs
- Gann Level: Average of six different SMAs (90, 144, 180, 216, 240, 288)
- These levels adjust automatically as the market evolves
**How to use it:**
- Blue line (Gann 50% Level) acts as dynamic support in uptrends and resistance in downtrends
- Orange line (Gann Level) serves as a longer-term trend indicator
- Price interaction with these levels often indicates potential reversal or continuation points
### 5. Anchored VWAP (Volume-Weighted Average Price)
**What it does:** Shows the average price weighted by volume starting from a specific anchor point.
**How it works:**
- Calculates the average price weighted by volume from a chosen anchor period (Session, Day, Week, Month)
- Resets calculations at the beginning of each new period
- Shows where the current price is relative to the average trading price
**How to use it:**
- Price above VWAP: Bullish bias, buyers are in control
- Price below VWAP: Bearish bias, sellers are in control
- VWAP often acts as dynamic support/resistance level
- Institutional traders often use VWAP for order execution
## Key Benefits
- **Comprehensive Analysis:** Combines volatility-based, trend-following, volume-weighted, and mathematical approaches
- **Multi-timeframe Perspective:** Different components operate on various timeframes for a complete market view
- **Visual Clarity:** Color-coded lines and background help quickly identify market conditions
- **Customizable Components:** Range Calculator, VWAP, and Gann Square Numbers can be adjusted to fit your trading style
## How to Interpret When Used Together
- **Strong Trend Confirmation:** When AMA shows a trend and price respects the Gann Dynamic levels
- **Reversal Signals:** When price reaches the expected range bounds and encounters a Gann Square Number
- **High-Probability Zones:** Areas where multiple components show support/resistance at similar levels
- **Volatility Assessment:** Compare the expected range from the Range Calculator with the actual price movement
This indicator combines statistical, trend-following, and mathematical approaches to market analysis, providing traders with a well-rounded view of market conditions and potential price movements.

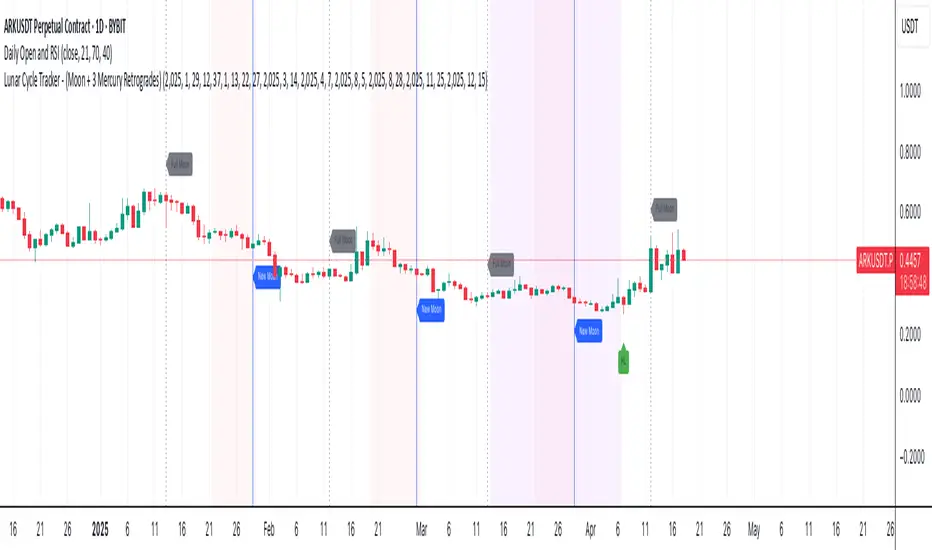
Lunar Cycle Tracker - (Moon + 3 Mercury Retrogrades)This script overlays the lunar and Mercury retrograde cycles directly onto your chart, helping traders visualize natural timing intervals that may influence market behavior.
Key Features:
🌑 New Moon & Full Moon Markers:
Vertical lines and labels indicate new and full moon events each month. You can fully customize their colors.
🌗 Last Quarter Moon Fill:
A soft pink background highlights the last quarter moon phase (from 7.4 days after the full moon to the next new moon).
🪐 Three Mercury Retrograde Zones:
Highlight up to three retrograde periods per year with customizable date inputs and background color. Great for spotting potential reversal or volatility windows.
Customization:
Moon event dates and colors
Manual input for Mercury retrograde periods (year, month, day)
Full compatibility with all timeframes (1H, 4H, daily, etc.)
Great for astro-cycle traders, Gann-based analysts, or anyone who respects time symmetry in the markets.
Fully customizable & works across all timeframes.
This tool was created by AngelArt as part of a larger astro-market model using lunar timing and planetary retrogrades for cycle-based market analysis.
Gann Percentage of High & Low Prices for Options - Keanu_RiTzThis Indicator is based on the text from Chapter 4 "Percentage of High & Low Prices" page number "30" from the book "WD Gann 45 years in Wall Street".
This Indicator is to be used on Intraday Timeframes and only on Options Charts (CALL & PUT) and not on any other chart.
The following is the text from that page :-
One of the greatest discoveries I ever made was how to figure the percentage of high and low prices on the averages and individual stocks.
The percentages of extreme high and low levels indicate future resistance levels.
There is a relation between every low price to some future high price and a percentage of the low price indicates what levels to expect the next high price.
At this price you can sell out long stocks and sell short with a limited risk.
The extreme high price or any minor tops are related to future bottoms er low levels.
The percentage of the high price tells where to expect low prices in the future and gives you resistance levels where you can buy with a limited risk.
The most important resistance level is 50% of any high or low price.
Second in importance is 100% on the lowest selling price on the averages or individual stocks.
You must also use 200%, 300%, 400%, 500%, 600% or more, depending upon the price and the Time Periods from High and Low.
Third in importance is 25% of the Lowest price or the Highest price.
Fourth in importance is 121/2% of the extreme Low or extreme High price.
Fifth in importance is 61/4% of the Highest price, but this is only to be used when the averages or individual stocks are selling at very high levels.
Sixth in importance is 33 1/3 and 66 2/3%. These percentages should be calculated and watched for resistance next after 25% and after 50%.
You should always have percentage tables made up on the Industrial Averages and on the individual stocks you trade in in order to know where these important resistance levels are located.
Description :
It plots the Intraday % levels from the highest high and lowest low of that day.
The calculation of these levels is based on the text from Chapter 4 "Percentage of High & Low Prices" page number "30" from the book "WD Gann 45 years in Wall Street".
I developed this indicator to see if those percentages work on Options prices or not,
and from my observation I found that it works wonderfully in Options as well.
These % levels work like magic and act as great Dynamic Support and Resistance levels.
Don't trust my words blindly and see for yourself.
This indicator is for educational and research purpose only.
It does not provide any BUY/SELL signals.

Gann LV Price/Time (EN)Gann LV Price/Time
This indicator is based on William Gann’s methods, the Law of Vibration, and classic wave analysis. Unlike traditional Gann tools, it employs adaptive trend analysis, combining angular acceleration, price-to-time ratio, and resonance zones. This allows for more precise identification of key support and resistance levels and enhances the ability to forecast potential trend reversals.
🔹 Key Features
✔ Customizable key points (A, B, C) – the user selects three significant points that form the basis of the analysis.
✔ Price calculation methods – the option to consider candle wicks, candle bodies, or an average price.
✔ Automatic trend structure analysis – the indicator determines whether the market is in an impulse or corrective phase.
✔ Support and resistance level forecasting – based on Gann’s Law of Vibration, making calculations dynamic.
✔ Identification of time-based reversal zones – key time cycles that influence trends are analyzed.
✔ Price resonance zones – special areas where the price reaches maximum sensitivity and may reverse direction.
✔ Market noise filtering – intelligent smoothing and volatility adaptation techniques are applied.
🔹 How Does the Indicator Work?
1️⃣ Defining Key Points A, B, C
These points serve as the foundation of the analysis, helping to determine trend direction and potential reversal zones.
2️⃣ Angular Acceleration Analysis
The indicator assesses whether the angle between points is accelerating or decelerating, allowing traders to identify trend strength and potential turning points.
3️⃣ Detection of Price Resonance Zones
Every market has its own natural vibration frequencies—moments when the price is most susceptible to trend shifts. The indicator analyzes these patterns and identifies key levels where reversals may occur.
4️⃣ Identification of Time-Based Trend Reversal Zones
Time cycles play a crucial role in price movements. By analyzing market rhythm patterns, the indicator forecasts probable trend reversal points, providing additional confirmation for trading decisions.
🔹 What Are Price Resonance Zones?
Resonance zones are areas on the chart where the price encounters an "invisible barrier" based on Gann’s Law of Vibration. These zones form when natural price and time rhythms align, creating an effect similar to acoustic or mechanical resonance.
Within these zones:
Trends slow down or accelerate.
There is a high probability of a reversal.
Key support and resistance levels become stronger.
The indicator automatically identifies these intersections, helping traders find optimal entry and exit points.
🔹 Where to Apply It?
✔ For identifying entry and exit points – helps detect the most probable trend reversal zones.
✔ For market cycle analysis – understanding market rhythms enables more accurate forecasting.
✔ For filtering false breakouts – resonance zones can confirm or invalidate potential breakouts.
📌 Important: This indicator does not guarantee profits; it serves as a supportive tool for comprehensive technical analysis.

Original Gann Swing Chart Rules [AlgoFuego]🔵 Original Gann Swing Chart Rules
An advanced indicator built on W.D. Gann’s original rules, enhanced with innovative mechanical trend-following methods.
🔹 Description
This indicator functions by balancing short-term adaptability with long-term trend analysis.
The indicator incorporates Gann’s principles alongside mechanical trend-following techniques to offer a structured method for analyzing trends and detecting potential market reversals.
Golden Rule: Non-trend bars are excluded from analysis, and each new bar is compared with the previous trend bar, it highlights significant swing points with greater clarity.
🔸 The core concept behind the golden rule on which this indicator is built.
The person watching the tide coming, wanting to pinpoint the exact spot that signals the high tide, places a stick in the sand at the points where the incoming waves reach until the stick reaches a position where the waves no longer rise, and eventually recedes enough to show that the tide has shifted.
This method is effective for monitoring and identifying tides and floods in the stock market.
🔸Rule 1: The trend bar is everything.
→It is a bar that forms a new high, low, or both.
🔸Rule 2: The professional traders track new highs and lows.
🔸Rule 3: The hidden bar is nothing.
→It is a bar that does not form a new high, low, or both.
🔸Rule 4: The sea has a wavy nature, and the market as well.
🔸Rule 5: The slope is the immediate direction of the swing.
Downward slope
→The downslope is the descending slope of a swing, shows a decline, reflecting a bearish price trend.
Upward slope
→The upslope is the ascending slope of a swing, shows an incline, reflecting a bullish price trend.
🔸Rule 6: The start and end of the movement are the swing points.
→The lowest or highest price of the last bar in the direction of the slope represents the swing point after the slopes direction changes.
Valley
→It is the lowest price of the last bar in a downslope before the market turns to a upslope.
End=> Downward slope and Start=> Upward slope
Peak
→It is the highest price of the last bar in a upslope before the market turns to an downslope.
End=> Upward slope and Start=> Downward slope
🔸Rule 7: The Golden Rule: Ignore all no-trend bars and compare the new bar with the previous trend bar.
→Applying the golden rule in upward slope
→Applying the golden rule in downward slope
🔸 Related content: Personal words of W.D Gann from the book Wall Street Stock Selector.
→"This was only one month's reaction the same as March 1925. The market held in a dull narrow range for about 2 months while accumulation was taking place and in June the main trend turned up again."
→The beginning of the main trend and the formation of the Valley.
→The beginning of the main trend and the formation of the Peak.
🔸 Rule 8: The Closing Price of the Bar to Understand Movement Direction.
Sequence is important
→ Downward bar
→ Upward bar
🔸 Outside Bar Rules
→Explanation of rules and calculations.
🔸 How does a trend start?
Upward trend
Trend change from Downward to Upward.
Prices must take out the nearest 'Peak' and the Trend was previously Downward.
A breakout above the previous peak signals a bullish reversal.
→ Model 1 - Dropping Valley Reversal
The market forms a dropping valley, followed by a breakout above the previous peak.
→ Model 2 - Equal Valley Reversal
The market forms an equal valley, followed by a breakout above the previous peak.
→ Model 3 - Rising Valley Reversal
The market forms a rising valley, followed by a breakout above the previous peak.
Downward trend
Trend change from Upward to Downward.
Prices must take out the nearest ‘Valley' and the Trend was previously Upward.
A breakdown below the previous valley signals a bearish reversal.
→ Model 1 - Rising Peak Reversal
The market forms a rising peak, followed by a breakdown below the previous valley.
→ Model 2 - Equal Peak Reversal
The market forms an equal peak, followed by a breakdown below the previous valley.
→ Model 3 - Dropping Peak Reversal
The market forms a dropping peak, followed by a breakdown below the previous valley.
🔸 The fractal nature of markets
Rising wave
→ The rising wave is the entire bull market between turning points
High point : When the Main trend turns from upward to downward, the peak of the primary trend is formed.
Dropping wave
→ The Dropping wave is the entire bear market between turning points.
Low point : When the Main trend turns from downward to upward, the primary trend valley is formed.
Fractal nature application.
Everything in one picture.
🔹 Features
Strict adherence to the rules: Follows the Original Gann Swing Chart Rules to detect swing points.
Fractal analysis: Uses trend bars and fractal analysis to identify swing points.
Robust functionality: Engineered to handle complex market conditions with advanced logic.
Custom alerts: Alerts for peak/valley completion, main and primary trend reversals & continuations.
Golden rule application: Filters out non-trend bars by comparing only with the last trend bar.
Reversal & trend detection: Applies eight outside bar rules to detect trend reversals and continuations.
Dynamic customization: Fully customizable settings.
🔹 Settings overview
Fine-tune the indicator to match your unique trading strategy by adjusting trend settings, customizing alerts, and modifying visualization options.
1. Main trend settings
Hide/Show Main trend options: Instantly hide all main trend options (alerts remain separate).
Main trendline display & alerts: Toggle trendline visibility and set alerts for peaks and valleys.
Trendline customization: Adjust styles, colors, and slopes for upward/downward trends.
Peaks & Valleys markers: Show/hide points and customize their color and size.
Opposite Main trend turning points: Enable alerts and modify style, width, color, and offset.
Breakout/Breakdown points: Set alerts and customize their appearance.
2. Primary trend settings
Hide/Show primary trend options: Instantly hide all primary trend options (alerts remain separate).
Primary trendline display & alerts: Toggle trendline visibility and set alerts for peaks and valleys.
Trendline customization: Adjust styles, colors, and slopes for upward/downward trends.
Peaks & Valleys markers: Show/hide points and customize their color and size.
Opposite primary trend turning points: Enable alerts and modify style, width, color, and offset.
Breakout/Breakdown points: Set alerts and customize their appearance.
3. Additional options
Tooltips display: Control tooltip visibility for labels and languages.
Candle/Bar coloring: Customize candle and bar colors based on algorithm-selected trends.
🔸 Additional features
🔹Custom reading of bars.
The arrow represents the direction of the slope, the dot is the type of trend, and the line is the closing price.
🔹 Advanced Moving Average Activator
The Advanced Moving Average Activator, this setting calculates the average closing prices of trend bars only, which are the only bars considered by Gann.
The advantage of this method is that it helps avoid hidden bars that are not accounted for, making the difference more evident in a ranging market. The values are updated only when new highs or lows occur.
Additionally, you can set alerts when the price closes above or below the moving average.
🔹 Bar Counter
After a trend change, you can see exactly when the shift occurred and customize the type of trend you want to track.
For example, by conducting your own research on the assets you trade, based on historical data, you might discover valuable insights, such as the primary trend possibly lasting longer than 20 bars!
You can use these insights to refine your trading strategy and make more data-driven decisions.
🔹 How to use
Step 1: Configure the settings and choose your trading approach
Adjust the indicator settings to match your trading style and market conditions.
Effectively using the indicator starts with selecting your preferred trading style.
You can trade in alignment with the primary trend, capitalize on market reversals, or take advantage of breakouts.
Trading with the primary trend: Best for traders who prefer longer-term positions with higher stability.
Trading reversals: Ideal for those looking to enter at potential turning points but requires additional confirmation.
Trading breakouts: Suitable for traders targeting strong price movements after key level breakouts.
Adapting to market volatility: Monitor changing volatility and adjust your strategy accordingly for optimal results.
Step 2: Analyze the chart
Apply the indicator to your TradingView chart and interpret swing signals for informed decisions.
Carefully study the chart patterns to detect subtle signals.
Check if similar signals worked well in past market conditions.
Use multi-timeframe analysis for a broader perspective.
Step 3: Trade with the primary trend
Utilize trend direction to align trades with prevailing market movements.
Always trade in the direction of the primary trend.
Confirm the trend direction using multiple indicators or by relying on the primary trend as confirmation!.
Avoid trading against strong market momentum.
Step 4: Identify entry signals
Use indicator signals to identify ideal trade entry points.
Look for confirmation before entering a trade.
Wait for clear signals to avoid false entries.
Practice on a demo account to build confidence in your entry strategy.
Step 5: Apply risk management
Define stop-loss and take-profit levels to protect your capital effectively.
Set stop-loss orders at strategic levels to limit potential losses.
Risk only a small percentage of your capital per trade.
Adjust risk levels based on your overall portfolio performance.
Step 6: Confirm with trend analysis
Validate trends using additional indicators for a higher probability of success.
Use complementary tools to confirm trend direction.
Monitor trend changes to adjust your strategy promptly.
Keep an eye on volume indicators for added confirmation.
Step 7: Execute the trade
Enter trades based on confirmed signals and predefined strategy rules.
Ensure all your criteria are met before executing a trade.
Stay disciplined and stick to your strategy.
Review market conditions right before execution.
Step 8: Monitor the trade
Track trade performance and make adjustments as necessary.
Keep an eye on market conditions throughout the trade.
Be ready to adjust your strategy if unexpected events occur.
Use trailing stops to secure profits while allowing for gains.
Step 9: Implement exit strategy
Close trades strategically based on your pre-established exit plan.
Plan your exit strategy in advance and adhere to it.
Consider partial exits to secure profits along the way.
Avoid emotional decisions when closing trades.
Step 10: Review performance
Analyze past trades to continuously refine and improve your strategy.
Regularly review and document your trades for insights.
Identify patterns in both your successes and mistakes.
Update your strategy based on comprehensive performance reviews.
🔹 Disclosure
While this script is useful and provides insight into market tops, bottoms, and trend trading, it's critical to understand that past performance is not necessarily indicative of future results and there are many more factors that go into being a profitable trader.

Rev & Line - CoffeeKillerRev & Line - CoffeeKiller Indicator Guide
🔔 Warning: This Indicator Repaints 🔔 This indicator uses real-time calculations that may change based on future price action. As a result, signals (such as arrows, lines, or color changes) **can and will repaint** — meaning they may appear, disappear, or shift after a candle closes.
**Do not rely on this tool alone for live trading decisions.** Use with caution and always confirm with non-repainting tools or additional analysis.(This indicator is designed to show me the full length of the trend and because of this there can be a smaller movement inside of the trend movement)
Welcome traders! This guide will walk you through the Rev & Line indicator, a sophisticated technical analysis tool developed by CoffeeKiller that combines multiple methodologies to identify market pivots, trends, and potential reversal points.
Core Components
1. ZigZag Analysis
- Dynamic pivot detection using ATR (Average True Range)
- Customizable sensitivity through ATR Reversal Factor
- Color-coded trend lines (green for upward, red for downward)
- Optional vertical lines at pivot points
- Real-time pivot point analysis
2. Donchian Channel Integration
- Traditional upper, lower, and middle bands
- Customizable length and displacement
- Channel-based entry signals
- Dynamic market structure visualization
3. Marker Lines System
- Dynamic support/resistance level tracking
- Pivot-based reset mechanism
- Optional fill zones between markers
- Percentage position tracking within range
4. Signal Generation System
- Confluence between ZigZag pivots and Donchian channels
- Up/down arrow visualization
- Alert system
Main Features
ZigZag Settings
- ATR Reversal Factor: Controls pivot sensitivity (default 3.2)
- Customizable line appearance:
Width control (default: 3)
Color selection (green for uptrend, red for downtrend)
Vertical line options at pivot points
Maximum vertical lines display limit
- Hide repainted option for more reliable signals
Donchian Channel Configuration
- Optional channel visibility toggle
- Length parameter for lookback period (default: 20)
- Displace option for time offset
- Bubble offset for visual placement
Marker Lines System
- High/low/middle marker lines with step-line visualization
- Dotted line projections for future reference
- Pivot-based reset mechanism
- Color-coded percentage position display
Signal Generation
- Triangle markers for signals
- Combined ZigZag and Donchian confluence
- Alert system for notifications
Visual Elements
1. Pivot Lines
- Green: Upward price movements
- Red: Downward price movements
- Customizable line width
- Optional vertical pivot markers with style options:
Solid lines for confirmed pivots
Dashed lines for older pivots
Dotted lines for most recent pivots
2. Donchian Channels
- Upper band (red): Resistance level
- Lower band (green): Support level
- Middle band (yellow): Median price line
- Customizable display options
3. Marker Lines
- High marker line (magenta): Tracks highest open price
- Low marker line (cyan): Tracks lowest open price
- Middle marker line (blue): 50% level between high/low
- Dotted line extensions for future price projections
4. Position Tracking
- Percentage position display within marker range
- Real-time calculations from 0% to 100%
- Label system for visual reference
Trading Applications
1. Trend Following
- Enter on confirmed ZigZag pivot points
- Use Donchian channel boundaries as targets
- Trail stops using marker lines
- Monitor for confluence between systems
2. Counter-Trend Trading
- Trade bounces from marker lines
- Use pivot confirmation for entry timing
- Set stops based on recent pivot points
- Target the opposite marker line
3. Range Trading
- Use high/low marker lines to define range
- Trade bounces between upper and lower markers
- Consider middle marker for range midpoint
- Monitor percentage position within range
4. Breakout Trading
- Enter on breaks above/below marker lines
- Confirm with Donchian channel breakouts
- Use ZigZag pivot confirmations
- Wait for arrow signals for additional confirmation
Optimization Guide
1. ZigZag Parameters
- Higher ATR Factor: Less sensitive, major moves only
- Lower ATR Factor: More sensitive, catches minor moves
- Adjust line width for chart visibility
- Balance vertical line count for clarity
2. Donchian Channel Settings
- Longer length: Smoother channels, fewer false signals
- Shorter length: More responsive, but potentially noisier
- Displacement: Offset for historical reference
- Consider timeframe when setting parameters
3. Marker Line Configuration
- Enable/disable based on trading style
- Toggle middle line for additional reference
- Adjust colors for visual clarity
- Enable/disable labels as needed
4. Signal Generation
- Use "Hide repainted" option for more reliable signals
- Combine ZigZag and Donchian signals for confirmation
- Set alerts based on confirmed pivot points
- Balance sensitivity with reliability
Best Practices
1. Signal Confirmation
- Wait for confirmed pivot points
- Check for Donchian channel interactions
- Confirm with price action
- Look for arrow signals at pivot points
2. Risk Management
- Use recent pivot points for stop placement
- Consider marker line boundaries for targets
- Don't trade against strong trends
- Wait for clear confluence between systems
3. Setup Optimization
- Start with default settings
- Adjust based on timeframe
- Fine-tune ATR sensitivity
- Match settings to trading style
Advanced Features
1. Alert System
- Customizable arrow alerts
- Pivot point notifications
- Text message alerts with ticker information
- Once-per-bar frequency option
2. Pivot Detection Logic
The indicator uses a sophisticated state-based approach to detect pivots:
- State transitions between "uptrend," "downtrend," and "undefined"
- ATR-based reversal detection
- Minimum movement threshold for pivot confirmation
- Historical pivot tracking and labeling
3. Marker Line Reset Mechanism
- Marker lines reset based on pivot detection
- Dynamic support/resistance level adjustment
- Percentage position calculation within range
- Automatic updates as market structure changes
Remember:
- Combine multiple confirmation signals
- Use appropriate timeframe settings
- Monitor both ZigZag and Marker signals
- Pay attention to Donchian channel interactions
- Consider market volatility when trading
This indicator works best when:
- Used with proper risk management
- Combined with other technical tools
- Applied to appropriate timeframes
- Signals are confirmed by price action
**DISCLAIMER**: This indicator and its signals are intended solely for educational and informational purposes. They do not constitute financial advice. Trading involves significant risk of loss. Always conduct your own analysis and consult with financial professionals before making trading decisions.

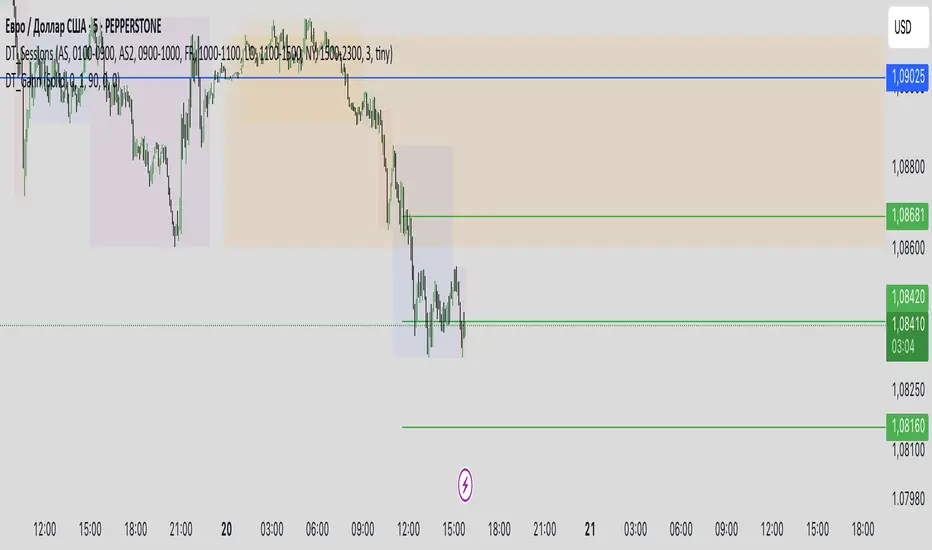
DT_GannDT_Gann - Combined Indicator Description
This TradingView indicator implements W.D. Gann's Square 9 concept with several visual enhancements to help traders identify key support and resistance levels. The indicator automatically adapts to different market types (forex or stocks) and includes the following features:
KEY FEATURES:
Support and resistance levels:
Automatically calculates and displays multiple support and resistance levels based on the Gann square theory of 9, with customizable colors (default green for support, red for resistance).
Day Opening Line:
Shows the day's opening price as a reference point, which serves as the base for all Gann calculations.
Previous 4H Range Box:
Displays a rectangular box showing the high-llow range of the previous day's last 4-hour candle, helping traders identify important price zones.
Vertical Time Lines:
Additional temporary vertical lines marking 4-hour intervals to help visualize potential reversal points.
Reject Mode:
Allows you to fine-tune support and resistance levels using percentage deviations.
CUSTOMIZATION OPTIONS:
Line Styles:
Select a solid, dashed, or dotted line.
Colors:
Adjust colors for support, resistance, daily open line, 4H rectangle and time lines.
Line Width:
Customize the thickness of all lines (1-5 pixels)
Opacity settings:
Control the transparency of various elements
Deviation settings:
Apply percentage adjustments to support and resistance levels
TECHNICAL IMPLEMENTATION:
Indicator:
- Automatically determines the appropriate point values depending on the instrument.
- Calculates Gann levels using the mathematical principle of Square 9.
- Finds the nearest support and resistance levels relative to the current price.
- Creates visualizations based on both charts and lines.
- Dynamically updates as price moves.
USAGE:
This indicator is especially useful for swing traders and day traders who follow Gann methods. The combination of price levels (support/resistance) and time markers (vertical lines) helps identify potential reversal zones where price and time align according to Gann principles.
The previous day's 4-hour rectangular frame often serves as an important reference zone that price can return to or respect.
The indicator works on all timeframes, but is most effective on charts from 15-minute to 4-hour charts, where time-based components provide the most value.
Price to Bar Ratio - Scale / Scales / ScalingPrice to Bar Ratio - Scaling
The Price to Bar Ratio - Scaling indicator for TradingView is designed for traders who utilize Gann-based techniques, Michael Jenkins methodologies, or geometric market analysis. It calculates the relationship between price movement and time (bars), providing a bar-to-price ratio that traders can use to align their charts with structured scaling methods.
Key Features:
• Geometry-Based Scaling – Designed for traders using market geometry, time/price balancing, or cycle analysis.
• Automatic Ratio Calculation – Computes a bar-to-price ratio based on price movement and time.
• Square & Rectangle Modes – Provides different scaling approaches to suit various analytical methods.
• Balanced Chart Structure – Helps maintain a proportional relationship between price and time.
• Customizable Inputs – Adjustable parameters for flexibility across different markets, assets, and timeframes.
How to Use:
1. Apply the Price to Bar Ratio - Scaling indicator to your TradingView chart.
2. Enable Magnet Mode in TradingView to help anchor points snap accurately to price levels.
3. Manually select your range using the four anchor points to define the area for calculation.
4. The indicator will generate a table displaying the calculated bar-to-price ratio.
5. Copy the recommended value from the table.
6. Open the chart settings in TradingView.
7. Locate the "Lock Price to Bar Ratio" input field.
8. Paste the copied ratio value into the input field and apply the changes.
9. Due to TradingView's limitations on the magnet option for anchor points, it is recommended to add a new instance of the indicator rather than dragging the anchor points to a new range. This prevents unwanted snapping behavior and ensures accurate recalculations.
Will be adding more formulas in the future.
Indicator in use:

Auto Gannbox by BULL┃NETThe B | N GABO (Auto Gannbox by BULL | NET)
indicator helps traders to draw a Gann Box with Angles and Arches automatically. Unlike the many other Gann indictors available at TradingView B | N GABO takes an objective approach to calculate the Price/Time ratio which is the most important part of drawing a Gann Box.
█ ⚠️ DISCLAIMER – READ BEFORE YOU USE ⚠️
█ CONCEPTS
William Delbert Gann used geometric constructions to divide time and price into proportionate parts to predict price development and areas of resistance and support. If you are new to Gann theories you should read about it on the internet.
W.D. Gann never revealed all details about his theory. One of those secrets it how he determined the essential 45° degree line which denotes the 1:1 ratio between price and time. Many people believe the 45° is due to the use of graph paper on which stock prices were drawn in the past. In my opinion, this theory fails precisely because of the price. Even back in time different stocks and commodities had different prices. So what should have been specified on the Y-axis?
Others believe there was no rule of construction at all and that Gann simply drew lines between pivot points. Gann was obsessed by Geometry. It makes no sense to think he had no plan. And if this would be true the Angles would be the result of how the graph paper has been manufactured.
Long story short, we don’t know exactly how he did it, and even studying his drawings leaves us guessing. I’m deeply interested in the objective assessment of facts. If something can’t be reproduced consistently, then it was just luck or coincidence. That’s why I’ve developed my own approach, combining objectivity, geometry, and time into a system that allows us to automatically determine a 45° line on the chart for any asset in any timeframe (see limitations section).
Think about the lifecycle of a tree: it’s planted, grows, may be struck by lightning, decays, and eventually vanishes. Apply this concept to the price of an asset. It starts at a low, rises to a peak, and then decreases to the next low. If we measure the time between the first low and the high, we get a ratio between duration and growth. By applying this ratio to a line starting at the high and moving in the opposite direction, we can determine whether the price is falling faster or slower than it took to rise.
By constructing a Gann Box around this line, with the 45° line as the anchor and adding other angles and arcs, we can get a better sense of how the price might develop over time. This interpretation draws inspiration from the principles of geometry and time-based analysis, and reflects my own unique take on market behavior.
The B | N GABO indicator uses meaningful pivot points on the chart to determine cycles. This is an objective approach that takes momentum into account. Similar to a tree, there are times of slower growth or accelerated decay. The pivot levels are based on the time frame. For example, when looking at a weekly chart, a cycle lasting at least 3 months would be considered meaningful. Therefore, the indicator uses Level 10 pivot points (a high with 10 lower highs or a low with 10 higher lows on each side) on a weekly chart. Instead of doing this automatically, you can set the pivot level manually. (See limitations section)
█ FEATURES
As with all my indicators B | N GABO his highly customizable.
— PIVOPOINT OPTIONS
The most important setting is how pivot points get calculated. By default the pivot level is selected automatically according to the timeframe of the chart.
Level 12 for 1 Hour Timeframe (minimum cycle of 25 hours or round about 3 trading days at the NYSE)
Level 15 for 4 Hours Timeframe (minimum cycle of 64 hours or round about 10 trading days at the NYSE)
Level 10 for any other Timeframe below 1 Day
Level 21 for Daily Timeframe (minimum cycle of 43 Trading days or round about 9 weeks)
Level 10 for any other Timeframe below Weekly
Level 6 for Weekly Timeframe and above
● Pivot Selection
You can switch to manual selection if you want or need to use other pivot level settings.
● Manual Length
The number you enter determines the amount of higher/lower bars needed to form a pivot point form a Low or High. Keep the limitations in mind (see limitations section)
● Display Pivotpoints
By default each calculated pivot point is marked on the chart as GH (Gann High) or GL (Gann Low). You can disable the display if you prefer a clean chart.
● Label
● Active
● Removed
● Size
If you display pivot points you can set the background color of the pivot label, the text color for active and removed pivot points and the size.
A removed pivot point shows pivot points that haven been superseded by a later pivot point in the same direction. Although removed pivot points can never become an anchor for a Gann Box they can tell you something about price momentum.
— GANN BOX OPTIONS
● Enable GANN
By default the active Gann Box is displayed on the chart. If you want to work with the pivot points only i.e. while testing the combination of indicators you can disable drawing the Gann Box.
● Show Info
By default you see the following informational labels around the Gann Box:
63.75° Angle (1x2), 45° Angle, 26.25° Angle (2x1) for better orientation
The current pivot length which is the level you set in the pivot point options or which has been selected automatically.
The Price/Bar ratio which you can use in the chart settings to fix the ratio. This will give you a perfect square.
Disable the display if you don’t need it or if you want a cleaner chart.
● Label
● Size
● Text
Label background color, label size and text color are used across all available labels.
● Time/Price Line
● Style
● Width
This settings define the appearance of the price (horizontal) and time (vertical) lines which define the squares the Gann Box is built with.
— GANN ANGLE OPTIONS
● Angle Line
● Style
● Width
Like with the Price/Time lines above you can fully customize the Angle lines drawn in the Gann Box. Select a line color, style and width to your likings.
● Angle Checkboxes
By default the 1, 2, 4 and 8 relation angles are drawn. The 1 to 1 (45°) can’t be disabled. In addition you can enable the 1.5 and 3 relation angles. Relation is meant as time units per price units.
● Enable 45° Watch
By default the indicator will check whether the price is above or below the 45° angle and change its color accordingly. It is a quick way to tell you whether the rise or fall of momentum is accelerating compared to the time period (Gann Box) before.
● Above
● Below
● Style
● Width
Change the 45° line color separately for price above and below the line, style and width to your likings.
— GANN ARC OPTIONS
● Arc Line
● Style
● Width
Like with the Angle lines above you can fully customize the Arc lines drawn in the Gann Box. Select a line color, style and width to your likings.
● Enable ARC Cross Labels
By default the indicator displays the price at which the current bar would hit or cross an arc line. Disable it if you want a cleaner chart.
● Label
● Text
● Size
● Position
With this settings you customize the color of the label and text, it’s size and whether the label should be moved to the left. This settings apply to the Cross 45° Label as well.
— DISPLAY OPTIONS
● 2 Decimals
To streamline the appearance of prices they are set to display two decimals only. Numbers get rounded! However, trading currency pairs or crypto assets might need to display the full amount of decimals. In this case simply disable the setting “2 Decimals”.
● Enable TF Warning
-------------------------------------------------------
Disclaimer BullNet: The information provided in this document is for educational and informational purposes only and does not constitute financial, investment, or trading advice. Any use of the content is at your own risk. No liability is assumed for any losses or damages resulting from reliance on this information. Trading financial instruments involves significant risks, including the potential loss of all invested capital. There is no guarantee of profits or specific outcomes. Please conduct your own research and consult a professional financial advisor if needed.
Disclaimer TradingView: According to the www.tradingview.com
Copyright: 2025-BULLNET - All rights reserved.
Roadmap:
Version 1.0 03.03.2025

Double Numbered Triangle Chart Progression | RegressionThe Double-Numbered Triangle Progression | Regression Indicator enables forecasting of support and resistance levels by progressing or regressing on the Triangle Chart from a user-selected pivot price. The indicator also plots adjustable pivots on both the chart and the Triangle Price and Time Chart.
How to use to forecast support and resistance levels:
1. Select a Pivot Point: Set the correct price to the pivot by selecting High or Low in the indicator.
2. Set Price Increment: Choose a price increment to adjust the starting price on the Triangle Chart (e.g., 1 or -0.01).
3. Rotate to adjust the number of levels on the Triangle Chart.
4. Plot Levels: Choose the Left Edge, Center, or Right Edge of the Triangle Chart to plot support and resistance levels. These levels automatically expand or decrease depending on the number of levels in step 3. The selected angle's price values are applied to the chart with labels on both sides. The left labels represent the time variable, and the right labels indicate the price. The time variable is used in conjunction with my other indicator "Price and Longitude Angles." The same goes for the Double Numbered Square of Nine indicator.
5. Review Levels: Examine the plotted support and resistance levels with recent market pivots.
6. Identify Correlations: Find the Triangle edge or center that aligns with the most market pivots.
7. The indicator plots user-adjustable pivots on both candles/bars and shows their placement on the Triangle Chart in both Progression and Regression. This visualization helps users identify which angles the highs and lows favor from the selected pivot. Pivot levels' colors can be customized. The close price is plotted on the Triangle Chart in real time with a white background.
Each market has its tendencies, favoring specific angles from the Triangle Chart. The basic idea is to choose between the Left edge, Center, or Right edge of the Triangle to forecast support and resistance levels.
Settings:
Overview:
Example of Forecasting Support and resistance level using this indicator:
In the image above, I am regressing from the significant high at a rate of $-0.008 per cell as shown on the main info label. Based on the plotted pivots, I have chosen the right edge of the triangle as it aligns with these recent pivots. I have drawn a lime green vertical line to indicate that as we add layers to the triangle chart, we introduce support and resistance levels based on the identified angle that aligns with these early pivots from the high.
In the image below, I've moved forward in time to illustrate how the initial angle chosen based on the early pivots forecasted support and resistance levels on $DOGE. Do not expect the price to turn sharply at the levels the indicator generates. As P. Mikula mentions in his work, and I apply the same with the Triangle Chart, " The Square of Nine successfully defines market price swings but does not cause the market to form pivots. "
This indicator is inspired by the methodologies detailed by Patrick Mikula in his book, The Definitive Guide to Forecasting using W.D Gann's Square of Nine. I recommend checking it out. He also mentions another use case as a Triangle Price and Time chart in his book, Gann Scientific Method Unveiled, Volume 2, where you can use my open-source indicator "Price and Longitude Angle" alongside both the Doubled Numbered Square of Nine and this Triangle Chart indicator.
FYI, I am not affiliated with Patrick Mikula in any way.
Planned improvements include adding two more angles: Left Center column and Right Center column as additional options to select.
FYI: Please ensure you select the high when regressing from a high. Also, make sure to add enough layers on the Triangle to see all the pivots. Once you've identified an angle, you can hide the table to gain back space on the chart. Use rounding precision for lower prices.

Doubled Numbered Square of Nine Progression | RegressionThe Doubled Number Square of Nine Progression | Regression Indicator enables forecasting of support and resistance levels using the SQ9 progression or regression from a user-selected pivot price. The indicator also plots adjustable pivots on both the chart and the Square of Nine.
How to use to forecast support and resistance levels:
1. Select a Pivot Point: Choose a top or bottom pivot to use as the starting point. Select High or Low in the indicator to set the correct price to the pivot.
2. Set Price Increment or Decrement: Select a price increment to advance the starting price on the Square of Nine (for example 1 or -0.01).
3. Rotate to add or decrease the number of rungs on the Square on Nine: Rotate the Square of Nine and adjust the dimensions. The horizontal levels correlate to the rotation of the Square of Nine.
4. Plot Levels: Select a Square of Nine angle to plot the support and resistance levels based on the selected increments. These levels auto expand and decrease depending on the number of rotations in step 3. The price values from each of the selected diagonal or cardinal cross are applied to the chart with labels on both left and right. Left labels represent the cell the time variable and the right label is price.
5. Review Levels: Conduct a simple review of the plotted support and resistance levels in relation to recent market pivots.
6. Identify Correlations: Identify the Square of Nine cardinal cross or diagonal cross angle that correlates with the most market pivots.
7. The indicator plots user-adjustable pivots on both candles/bars and displays their placement on the Square of Nine in both Progression and Regression. The close price is plotted on the Square of Nine in real-time with a white background. This helps users identify which angles the highs and lows favor from the selected pivot. The pivot levels' colors can be adjusted.
Each market has its tendencies, favoring specific angles from the cardinal or diagonal cross. The basic idea is to choose between the diagonal cross and cardinal cross angles to forecast support and resistance levels.
Settings:
Overview:
Example on Forecasting Support and resistance level using this indicator:
In the image above, I'm progressing from the significant low at a rate of $200 per cell. Based on the plotted pivots, I've selected the 315-degree angle on the diagonal cross as it aligns with a few recent pivots. Now, I've drawn a vertical line to show that as we add rungs to the Square of Nine, we introduce support and resistance levels based on the identified angle that aligns with these early pivots from the low.
In the image below, I've moved forward in time to show how the initial angle selected based on the early pivot forecasted support and resistance levels around the high in BTC. Do not expect the price to turn sharply at the levels the indicator generates, but use it to help identify SQ9 levels that may form market turns. As P. Mikula mentions in his work, "The Square of Nine successfully defines market price swings but it does not make the market form pivots."
This indicator includes enhancements made to the Gann Square of Nine indicator originally created by @ThiagoSchmitz.
This indicator is inspired by the methodologies detailed by Patrick Mikula in his book " The Definitive Guide to Forecasting using W.D Gann's Square of Nine ." I recommend checking it out. He also mentions another use case as a Price and Time chart in his " Gann Scientific Method Unveiled, Volume 2 ." FYI, I am not affiliated with Patrick Mikula in any way.
Known Issues:
Close price plotted on the Square of Nine in Regression "from a high pivot" takes a current candle to close in order to be plotted. Progression works as expected.

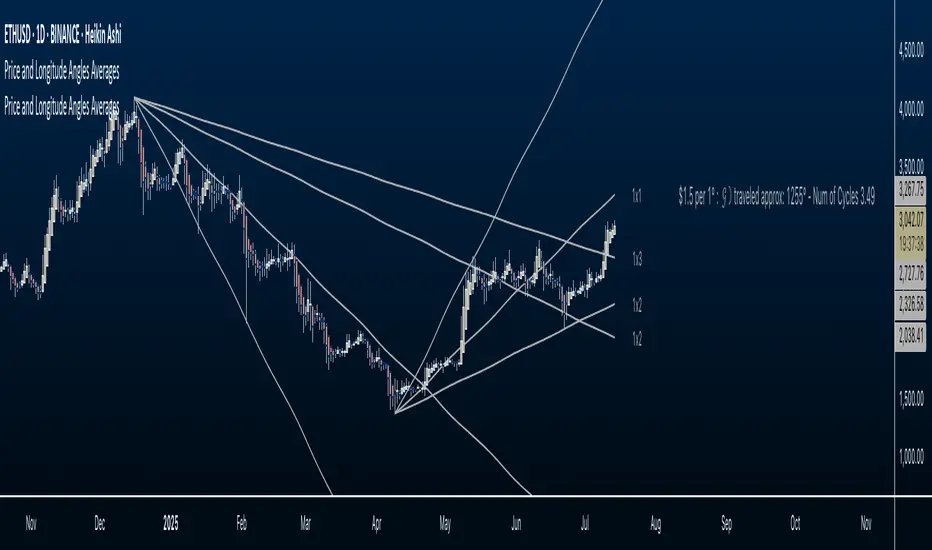
Price and Longitude Angles Planetary Price & Longitude Angles Indicator
This indicator plots planetary price and longitude angles starting from a user-selected date and time, offering a distinctive lens to explore the relationship between price and planetary timing. It supports both heliocentric and geocentric, enabling flexible and in-depth planetary analysis. The angles can be plotted across any time frame for maximum versatility.
How to Use
Once the indicator is loaded, you’ll be prompted to select a starting date and time for your analysis. From there, customize it as follows:
Select Planetary Options:
To plot the price and longitude for a single planet, choose the same planet in both dropdown menus.
To plot the average of two planets, select a different planet in each dropdown.
Set the Price Per Degree of Longitude: Adjust this value to define the scaling of the planetary angles relative to price.
Customize Fan Settings:
Toggle the mirroring of the fan on or off based on your needs.
Show or hide specific angle divisions to tailor the display to your preferences.
Display or conceal the information label that indicates the price per longitude and the number of degrees traveled.
This indicator is inspired by the methodologies of W.D. Gann and Patrick Mikula, expanding on concepts from Gann Scientific Method Unveiled, Volume 2. It was built using Astrolib by @BarefootJoey
I crafted this tool through dedication to support my own study of these ideas. I’m sharing it open-source not only to deepen my understanding and honor the work of Gann and Mikula, but also to invite collaboration. There’s always room for improvement—whether in functionality, accuracy, or design—and I hope others will join me in refining it. This is for those like me: eager to explore these concepts but lacking tools to experiment with. Let’s build on it together.
WD Gann: Vertical Lines for Predefined Days/Bars AgoThis Pine Script draws vertical lines on the chart at specific time intervals, inspired by WD Gann’s theories of time cycles . WD Gann, a famous trader, believed that market movements were influenced by predictable time cycles. This script enables traders to visualize these key time cycles on the chart by placing vertical lines at predefined intervals (in bars ago), helping to identify potential turning points in the market.
The time intervals used in this script are inspired by Gann’s work, as well as astrological and numerological principles , which many traders believe influence market behavior . You can customize which time intervals (such as 3, 7, 9, 21, etc.) you want to track by enabling or disabling specific vertical lines on the chart.
Key Features:
Time Cycles Based on Gann’s Theory: Draws vertical lines at significant time intervals such as 3, 7, 9, 21, 27 bars ago, which are commonly used by Gann traders.
Astrological & Numerological Significance: The predefined intervals also align with key numerological and astrological values, allowing for a broader perspective on market cycles.
Customizable Intervals: You can choose which time intervals to display by enabling or disabling checkboxes for each cycle, allowing flexibility in chart analysis.
Visual Labels: Each vertical line is labeled with its corresponding "bars ago" value, providing clear reference points for the selected time cycles.
What Users Can Do:
Track and analyze market movements based on time cycles that are significant to Gann’s theory, as well as numerological and astrological influences.
Enable or disable vertical lines for specific cycles, like the 3-bar cycle, 9-bar cycle, or 365-bar cycle, depending on the intervals that align with your trading strategy.
Combine with other technical analysis tools and Gann techniques (e.g., Gann Angles, Gann Fans, or Square of Nine) for a more comprehensive trading approach.
This tool is designed for traders who believe in the power of time cycles to influence market behavior, and is especially useful for predicting turning points or key price movements based on these cycles.

WD Gann: Close Price X Bars Ago with Line or Candle PlotThis indicator is inspired by the principles of WD Gann, a legendary trader known for his groundbreaking methods in time and price analysis. It helps traders track the close price of a security from X bars ago, a technique that is often used to identify key price levels in relation to past price movements. This concept is essential for Gann’s market theories, which emphasize the relationship between time and price.
WD Gann’s analysis often revolved around specific numbers that he considered significant, many of which correspond to squared numbers (e.g., 1, 4, 9, 16, 25, 36, 49, 64, 81, 100, 121, 144, 169, 196, 225, 256, 289, 324, 361, 400, 441, 484, 529, 576, 625, 676, 729, 784, 841, 900, 961, 1024, 1089, 1156, 1225, 1296, 1369, 1444, 1521, 1600, 1681, 1764, 1849, 1936). These numbers are believed to represent natural rhythms and cycles in the market. This indicator can help you explore how past price levels align with these significant numbers, potentially revealing key price zones that could act as support, resistance, or reversal points.
Key Features:
- Historical Close Price Calculation: The indicator calculates and displays the close price of a security from X bars ago (where X is customizable). This method aligns with Gann's focus on price relationships over specific time intervals, providing traders with valuable reference points to assess market conditions.
- Customizable Plot Type: You can choose between two plot types for visualizing the historical close price:
- Line Plot: A simple line that represents the close price from X bars ago, ideal for those who prefer a clean and continuous representation.
- Candle Plot: Displays the close price as a candlestick chart, providing a more detailed view with open, high, low, and close prices from X bars ago.
- Candle Color Coding: For the candle plot type, the script color-codes the candles. Green candles appear when the close price from X bars ago is higher than the open price, indicating bullish sentiment; red candles appear when the close is lower, indicating bearish sentiment. This color coding gives a quick visual cue to market sentiment.
- Customizable Number of Bars: You can adjust the number of bars (X) to look back, providing flexibility for analyzing different timeframes. Whether you're conducting short-term or long-term analysis, this input can be fine-tuned to suit your trading strategy.
- Gann Method Application: WD Gann's methods involved analyzing price action over specific time periods to predict future movements. This indicator offers traders a way to assess how the price of a security has behaved in the past in relation to a chosen time interval, a critical concept in Gann's theories.
How to Use:
1. Input Settings:
- Number of Bars (X): Choose the number of bars to look back (e.g., 100, 200, or any custom period).
- Plot Type: Select whether to display the data as a Line or Candles.
2. Interpretation:
- Using the Line plot, observe how the close price from X bars ago compares to the current market price.
- Using the Candles plot, analyze the full price action of the chosen bar from X bars ago, noting how the close price relates to the open, high, and low of that bar.
3. Gann Analysis: Integrate this indicator into your broader Gann-based analysis. By looking at past price levels and their relationship to significant squared numbers, traders can uncover potential key levels of support and resistance or even potential reversal points. The historical close price can act as a benchmark for predicting future market movements.
Suggestions on WD Gann's Emphasis in Trading:
WD Gann’s trading methods were rooted in several key principles that emphasized the relationship between time and price. These principles are vital to understanding how the "Close Price X Bars Ago" indicator fits into his overall analysis:
1. Time Cycles: Gann believed that markets move in cyclical patterns. By studying price levels from specific time intervals, traders can spot these cycles and predict future market behavior. This indicator allows you to see how the close price from X bars ago relates to current market conditions, helping to spot cyclical highs and lows.
2. Price and Time Squaring: A core concept in Gann’s theory is that certain price levels and time periods align, often marking significant reversal points. The squared numbers (e.g., 1, 4, 9, 16, 25, etc.) serve as potential key levels where price and time might "square" to create support or resistance. This indicator helps traders spot these historical price levels and their potential relevance to future price action.
3. Geometric Angles: Gann used angles (like the 45-degree angle) to predict market movements, with the belief that prices move at specific geometric angles over time. This indicator gives traders a reference for past price levels, which could align with key angles, helping traders predict future price movement based on Gann's geometry.
4. Numerology and Key Intervals: Gann paid particular attention to numbers that held significance, including squared numbers and numbers related to the Fibonacci sequence. This indicator allows traders to analyze price levels based on these key numbers, which can help in identifying potential turning points in the market.
5. Support and Resistance Levels: Gann’s methods often involved identifying levels of support and resistance based on past price action. By tracking the close price from X bars ago, traders can identify past support and resistance levels that may become significant again in future market conditions.
Perfect for:
Traders using WD Gann’s methods, such as Gann angles, time cycles, and price theory.
Analysts who focus on historical price levels to predict future price action.
Those who rely on numerology and geometric principles in their trading strategies.
By integrating this indicator into your trading strategy, you gain a powerful tool for analyzing market cycles and price movements in relation to key time intervals. The ability to track and compare the historical close price to significant numbers—like Gann’s squared numbers—can provide valuable insights into potential support, resistance, and reversal points.
Disclaimer:
This indicator is based on the methods and principles of WD Gann and is for educational purposes only. It is not intended as financial advice. Trading involves significant risk, and you should not trade with money that you cannot afford to lose. Past performance is not indicative of future results. The use of this indicator is at your own discretion and risk. Always do your own research and consider consulting a licensed financial advisor before making any investment decisions.

Gann Square of 9Understanding the Gann Square of 9
Delve into the fascinating realm of W.D. Gann’s Square of 9, a tool that has intrigued traders for generations. As we explore the insights behind this unique structure, we’ll show you how our Gann Square of 9 Indicator can become a valuable asset in your trading toolkit.
The History of the Gann Square of 9
The story behind the Gann Square of 9 is as fascinating as the man who created it. W.D. Gann, a pioneering trader from the early 20th century, introduced a method that highlighted the connection between time and price. Rooted in ancient mathematics and geometry, Gann’s theory suggests that financial markets follow cyclical patterns, which are captured in the design of the Square of 9.
Core Principles of the Gann Square of 9
At its heart, the Gann Square of 9 is based on a numerical system that spirals outward from a central point. This unique arrangement allows traders to identify potential support and resistance levels in the market. Each number represents a possible pivot point, indicating shifts in market direction, aligned with Gann’s time-price equilibrium theory.
Applying the Gann Square in Market Analysis
The strength of the Gann Square of 9 lies in its ability to predict key moments in the market where significant price movements may occur. By utilizing our Gann Square of 9 Indicator, traders can easily pinpoint these crucial points, applying Gann’s principles to anticipate both market highs and lows. This section will guide you through practical applications of the Gann Square for making both short-term and long-term trading decisions.
Market Timing with the Gann Square of 9 Indicator
Unlock the potential of market timing and price prediction using our Gann Square of 9 Indicator. This versatile tool brings Gann’s trading insights into the modern world of finance. Here, you’ll find a detailed walkthrough on how to use the indicator to enhance your trading strategies.
Step-by-Step Guide
Input the Source Price: Open, High, Low, Close on specific Timeframe.
Set the Pip Value: Adjust the pip value according to the scale of your trades. The pip value helps define the precision of the price levels the calculator will generate.
Analyze Results: The generated grid displays a central value (your input price) surrounded by numbers representing possible support and resistance levels.
Use the Support and Resistance Levels: Below the grid, you’ll find specific support and resistance points. These are key price levels that can help you plan your trading strategy, such as entry or exit points.
Apply Gann's Trading Entries: At the bottom, suggested long and short trade entries, with targets and stop-loss levels, giving you essential tools for managing risk effectively.
By following these steps, you can effectively incorporate Gann’s time-tested techniques into modern market analysis. Our Gann Square of 9 Indicator simplifies complex calculations while offering powerful insights, helping you make informed trading decisions rooted in one of market analysis’s most influential theories.
Whether you’re new to Gann’s approach or a seasoned trader, this indicator is designed to provide valuable insights aligned with Gann’s original concepts while delivering a seamless user experience for today’s traders. With just a few clicks, you can transform market data into a geometric pattern of time and price, setting the stage for strategic trading based on the cyclical nature of financial markets.

Gann Levels 360
This indicator plots a series of horizontal lines on a chart based on pre-defined levels and the current market price. These levels are believed to be significant for potential support and resistance zones according to the Gann trading methodology.
This code defines a custom indicator that plots a set of Gann levels and dynamically adjusts them based on the current market price. Users can change the line color through the input option.

Historical Swing High-Low Gann IndicatorThe Historical Swing High-Low Gann Indicator is a powerful tool designed to track and visualize key market swing points over time. This indicator identifies significant swing highs and lows within a specified time frame and draws connecting lines between these points, allowing traders to observe the natural ebb and flow of the market.
What sets this indicator apart is its ability to maintain all previously drawn swing lines, creating a comprehensive historical view of market movements. Additionally, the indicator projects Gann-style lines from the most recent swing highs and lows, providing traders with potential future support and resistance levels based on the geometric progression of price action.
Features:
Swing Detection: Automatically detects significant swing highs and lows over a user-defined period (default is 3 hours).
Persistent Historical Lines: Keeps all previously drawn lines, offering a complete visual history of the market's swing points.
Gann-Style Projections: Draws forward-looking lines from the latest swing points to help predict possible future market levels.
Customizable Parameters: Allows users to adjust the swing detection period to suit different trading styles and time frames.
This indicator is ideal for traders who rely on price action, support and resistance levels, and Gann theory for their analysis. Whether used in isolation or as part of a broader strategy, the Historical Swing High-Low Gann Indicator provides valuable insights into the market's behavior over time.
