Bearish Breakaway Dual Session-FVGInspired by the FVG Concept:
This indicator is built on the Fair Value Gap (FVG) concept, with a focus on Consolidated FVG. Unlike traditional FVGs, this version only works within a defined session (e.g., ETH 18:00–17:00 or RTH 09:30–16:00).
See the Figure below as an example:
Bearish consolidated FVG & Bearish breakaway candle
Begins when a new intraday high is printed. After that, the indicator searches for the 1st bearish breakaway candle, which must have its high below the low of the intraday high candle. Any candles in between are part of the consolidated FVG zone. Once the 1st breakaway forms, the indicator will shades the candle’s range (high to low). Then it will use this candle as an anchor to search for the 2nd, 3rd, etc. breakaways until the session ends.
Session Reset: Occurs at session close.
Repaint Behavior:
If a new intraday (or intra-session) high forms, earlier breakaway patterns are wiped, and the system restarts from the new low.
Counter:
A session-based counter at the top of the chart displays how many bullish consolidated FVGs have formed.
Settings
• Session Setup:
Choose ETH, RTH, or custom session. The indicator is designed for CME futures in New York timezone, but can be adjusted for other markets.
If nothing appears on your chart, check if you loaded it during an inactive session (e.g., weekend/Friday night).
• Max Zones to Show:
Default = 3 (recommended). You can increase, but 3 zones are usually most useful.
• Timeframe:
Best on 1m, 5m, or 15m. (If session range is big, try higher time frame)
Usage:
See this figure as an example
1. Avoid Trading in Wrong Direction
• No Bearish breakaway = No Short trade.
• Prevents the temptation to countertrade in strong uptrends.
2. Catch the Trend Reversal
• When a bearish breakaway appears after an intraday high, it signals a potential reversal.
• You will need adjust position sizing, watch out liquidity hunt, and place stop loss.
• Best entries of your preferred choices: (this is your own trading edge)
Retest
Breakout
Engulf
MA cross over
Whatever your favorite approach
• Reversal signal is the strongest when price stays within/below the breakaway candle’s
range. Weak if it breaks above.
3. Higher Timeframe Confirmation
• 1m can give false reversals if new lows keep forming.
• 5m often provides cleaner signals and avoids premature reversals.
Summary
This indicator offers 3 main advantages:
1. Prevents wrong-direction trades.
2. Confirms trend entry after reversal signals.
3. Filters false positives using higher timeframes.
Failed example:
Usually happen if you are countering a strong trend too early and using 1m time frame
Last Mention:
The indicator is only used for bearish side trading.
Fvg

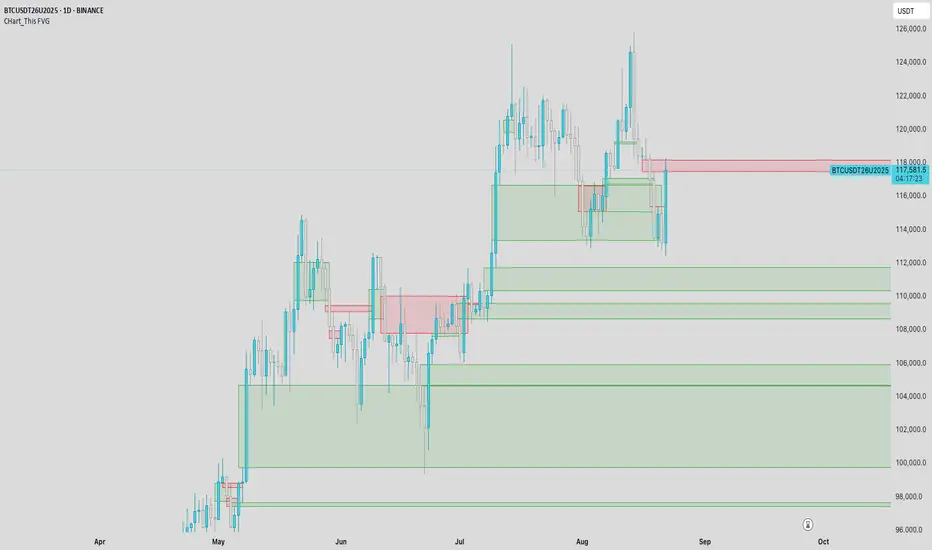
CHart_This FVGThis script will work on any time frame, and auto plots the classic ICT "fair value gaps", or imbalances, that result from a three candle formation wherein the middle candle body extends beyond the highs and lows of the end candles, leaving no overlap of the first and last candle wicks. Bullish imbalances are green, and bearish are red. Plotted zones will automatically close once a candle closure fully violates the imbalance zone with a close beyond its borders.
IFVG by Toño# IFVG by Toño - Pine Script Indicator
## Overview
This Pine Script indicator identifies and visualizes **Fair Value Gaps (FVG)** and **Inverted Fair Value Gaps (IFVG)** on trading charts. It provides advanced analysis of price inefficiencies and their subsequent inversions when mitigated.
## Key Features
### 1. Fair Value Gap (FVG) Detection
- **Bullish FVG**: Detected when `low > high ` (gap between current low and high of 2 bars ago)
- **Bearish FVG**: Detected when `high < low ` (gap between current high and low of 2 bars ago)
- Visual representation using colored rectangles (green for bullish, red for bearish)
### 2. Inverted Fair Value Gap (IFVG) Creation
- **IFVG Formation**: When a FVG gets mitigated (price fills the gap with candle body), an IFVG is created
- **Color Inversion**: The IFVG takes the opposite color of the original FVG
- Mitigated bullish FVG → Creates red (bearish) IFVG
- Mitigated bearish FVG → Creates green (bullish) IFVG
- **Mitigation Logic**: Uses only candle body (not wicks) to determine when a FVG is filled
### 3. Customizable Display Options
- **Show Normal FVG**: Toggle visibility of regular Fair Value Gaps
- **Show IFVG**: Toggle visibility of Inverted Fair Value Gaps
- **Smart FVG Display**: Even when "Show Normal FVG" is disabled, FVGs that are part of IFVGs remain visible
- **Extension Control**: Option to extend FVGs until they are mitigated
### 4. IFVG Extension Methods
- **Full Cross Method**: IFVG remains active until price completely crosses through it (including wicks)
- **Number of Bars Method**: IFVG remains active for a specified number of bars (1-100)
### 5. Visual Mitigation Signals
- **Cross Markers**: Shows X-shaped markers when IFVGs are mitigated
- Green cross above bar: Bearish IFVG mitigated
- Red cross below bar: Bullish IFVG mitigated
### 6. Comprehensive Alert System
- **IFVG Formation Alerts**: Notifications when new IFVGs are created
- **IFVG Mitigation Alerts**: Notifications when IFVGs are filled/mitigated
- **Separate Controls**: Individual toggles for bullish and bearish IFVG alerts
## How It Works
### Step-by-Step Process:
1. **FVG Detection**: Script continuously scans for 3-bar patterns that create price gaps
2. **FVG Tracking**: Each FVG is stored with its coordinates, type, and status
3. **Mitigation Monitoring**: Script watches for candle bodies that fill the FVG
4. **IFVG Creation**: Upon mitigation, creates an IFVG with opposite polarity at the same location
5. **IFVG Management**: Tracks and extends IFVGs according to chosen method
6. **Visual Updates**: Dynamically updates colors and visibility based on user settings
## Use Cases
- **Support/Resistance Analysis**: IFVGs often act as strong support/resistance levels
- **Market Structure Understanding**: Helps identify how market inefficiencies get filled and reversed
- **Entry/Exit Timing**: Can be used to time entries around IFVG formations or mitigations
- **Confluence Analysis**: Combine with other technical analysis tools for stronger signals
## Configuration Parameters
- **Colors**: Customizable colors for bullish/bearish FVGs and IFVGs
- **Extension**: Choose how long to display gaps on the chart
- **Alerts**: Full control over notification preferences
- **Visual Clarity**: Options to show/hide different gap types for cleaner charts
## Technical Specifications
- **Pine Script Version**: 5
- **Overlay**: True (displays directly on price chart)
- **Max Boxes**: 500 (supports up to 500 simultaneous gaps)
- **Performance**: Optimized array management for smooth operation
This indicator is particularly valuable for traders who use **Smart Money Concepts (SMC)** and **Inner Circle Trader (ICT)** methodologies, as it provides clear visualization of how institutional order flow creates and fills market inefficiencies.

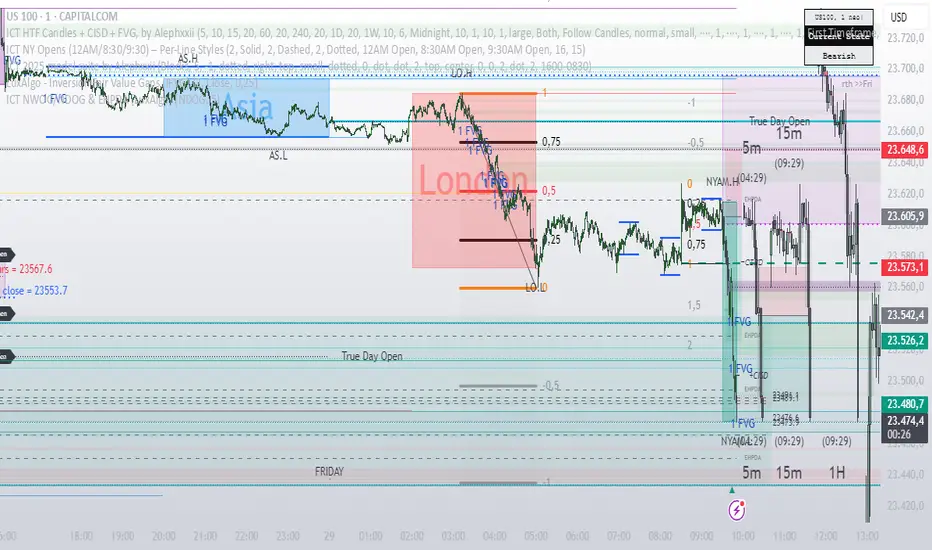
ICT HTF Candles + CISD + FVG, by AlephxxiiICT HTF Candles + CISD + FVG
A practical, friendly overlay for ICT-style trading
This indicator gives you three things at once—right on your chart:
HTF Candles Panel (context):
Compact candles from higher timeframes (e.g., 5m, 15m, 1H, 4H, 1D, 1W) appear to the right of price so you always see the higher-timeframe story without switching charts. It includes labels, remaining time for the current HTF candle, and optional open/high/low/close reference lines.
CISD Levels (bias flips):
Automatically plots +CISD and -CISD lines. When price closes above +CISD, the indicator considers bullish delivery. When price closes below -CISD, it considers bearish delivery. An on-chart table (optional) shows the current bias at a glance.
FVG (Fair Value Gaps):
Highlights inefficiency zones (gaps) on your current timeframe and/or a selected higher timeframe. You can choose to mark a gap “filled” when price hits the midpoint (optional).
Quick start (2 minutes)
Add to chart and keep your normal trading timeframe (e.g., 1–5m).
In settings → HTF 1..6, pick the higher timeframes you want to see (e.g., 5m, 15m, 1H, 4H, 1D, 1W).
Turn on FVG (current, HTF or both).
Watch +CISD / -CISD lines and the Current State table.
Close above +CISD → Bullish bias
Close below -CISD → Bearish bias
Trade with the bias and use FVGs as areas to refine entries or targets.
How to read it (the simple way)
Bias (CISD):
Bullish once price closes above the active +CISD level.
Bearish once price closes below the active -CISD level.
The small table (if enabled) says Bullish or Bearish right now.
HTF panel:
Shows higher-timeframe candles next to your current chart.
Labels show the timeframe (e.g., 1H) and a countdown for the current candle.
Optional traces draw HTF Open/High/Low/Close levels—great “magnets” for price.
FVGs:
Shaded boxes = potential inefficiency areas.
If Midpoint Fill is on, a touch of the midline counts as filled.
You can display current TF, HTF, or both.
Suggested workflow (popular ICT-style intraday)
Define bias with CISD
Only look for longs if Bullish, shorts if Bearish.
Check HTF context
Are you trading into a large HTF FVG or key HTF O/H/L/C level? That can be a target or a headwind.
Refine entries with FVGs
On your entry TF (1–5m), use fresh FVGs in the direction of the bias. Avoid fading straight into big HTF imbalances.
Key settings you’ll actually use
HTF 1..6: toggle each strip, select timeframe, and how many candles to show.
Style & layout: adjust offset, spacing, and width of the right-side panels.
Labels & timers: show/hide HTF name and remaining time; place labels at Top/Bottom/Both.
Custom daily open (NY): set the 1D candle to start at Midnight, 08:30, or 09:30 (America/New_York).
Trace lines: optional HTF O/H/L/C lines (style, width, anchor TF).
FVG module (extra): choose Current TF / HTF / Both, enable Midpoint Fill, auto-delete on fill, and show timeframe labels.
CISD lines: customize color, style (solid/dotted/dashed), thickness, and forward extension.
Table: enable/disable and choose its position.
Alerts
When a CISD completes, the script fires an alert (e.g., “Bullish CISD Formed” or “Bearish CISD Formed”).
Tip: Set your TradingView alert once on the indicator, then choose the alert message you want to receive.
Notes & limitations (read me)
“VI” label: The “Volume Imbalance” option marks price imbalances (body non-overlap). It does not read volume data.
Timezone: Daily logic and timers use America/New_York, which aligns with US indices/equities and common ICT practice.
Performance: This tool draws many boxes/lines/labels. If your chart feels heavy, reduce the number of HTFs or candles shown, or narrow panel width.
Repainting: HTF panels are designed to avoid future leakage; FVG logic follows standard 3-bar checks. As usual, wait for candle closes for confirmations.
Level cleanup: If Keep old CISD levels is OFF (default), the script keeps only the current active CISD to reduce clutter.
Bullish Breakaway Dual Session-Publish-Consolidated FVG
Inspired by the FVG Concept:
This indicator is built on the Fair Value Gap (FVG) concept, with a focus on Consolidated FVG. Unlike traditional FVGs, this version only works within a defined session (e.g., ETH 18:00–17:00 or RTH 09:30–16:00).
Bullish consolidated FVG & Bullish breakaway candle
Begins when a new intraday low is printed. After that, the indicator searches for the 1st bullish breakaway candle, which must have its low above the high of the intraday low candle. Any candles in between are part of the consolidated FVG zone. Once the 1st breakaway forms, the indicator will shades the candle’s range (high to low). Then it will use this candle as an anchor to search for the 2nd, 3rd, etc. breakaways until the session ends.
Session Reset: Occurs at session close.
Repaint Behavior:
If a new intraday (or intra-session) low forms, earlier breakaway patterns are wiped, and the system restarts from the new low.
Counter:
A session-based counter at the top of the chart displays how many bullish consolidated FVGs have formed.
Settings
• Session Setup:
Choose ETH, RTH, or custom session. The indicator is designed for CME futures in New York timezone, but can be adjusted for other markets.
If nothing appears on your chart, check if you loaded it during an inactive session (e.g., weekend/Friday night).
• Max Zones to Show:
Default = 3 (recommended). You can increase, but 3 zones are usually most useful.
• Timeframe:
Best on 1m, 5m, or 15m. (If session range is big, try higher time frame)
Usage
1. Avoid Trading in Wrong Direction
• No bullish breakaway = No long trade.
• Prevents the temptation to countertrade in strong downtrends.
2. Catch the Trend Reversal
• When a bullish breakaway appears after an intraday low, it signals a potential reversal.
• You will need adjust position sizing, watch out liquidity hunt, and place stop loss.
• Best entries of your preferred choices: (this is your own trading edge)
Retest
Breakout
Engulf
MA cross over
Whatever your favorite approach
• Reversal signal is the strongest when price stays within/above the breakaway candle’s
range. Weak if it breaks below.
3. Higher Timeframe Confirmation
• 1m can give false reversals if new lows keep forming.
• 5m often provides cleaner signals and avoids premature reversals.
Failed Trade Example:
This indicator will repaint if a new intraday session low is updated. So it is possible to have a failed trade. Here is an example from the same session in 1m chart. However, if you enter the trade later at another bullish breakaway candle signal. The loss can be mitigated by the profit.
Therefore you should use smaller position size for your 1st trade. You should also considering using 5m chart to avoid 1m bull trap. In this example, if you use 5m chart, you can totally avoid this failed trade.
If you enter the trade, you will see the intraday low is stop loss hunted. You can also see the 1st bullish breakaway candle is super weak. There are a lot of candles below the breakaway candle low, so it is very possible to fail.
In the next chart, you can see the failed traded get stop loss hunted. However you can enter another trade with huge profit to win back the loss from the 1st trade if you follow the rule.
Summary
This indicator offers 3 main advantages:
1. Prevents wrong-direction trades.
2. Confirms trend entry after reversal signals.
3. Filters false positives using higher timeframes.
How to sharp your edge:
1. ⏳Extreme patience⏳: Do not guess the bottom during a downtrend before a confirmed bullish breakaway candle. If you get caught, have the courage to cut loss. This is literally the most important usage of this indicator. Again, this is the most important rule of this indicator and actually the hardest rule to follow.
2. 🛎Better Entry🛎: After a confirmed bullish breakaway, you will always have a good opportunity to enter the trade using established trading technique. Your edge will come from the position size, draw down, stop loss placement, risk/reward ratio.
3. ✂Cut loss fast✂: If you enter a trade according to the rule, but you are still not making profit for a period of time, and the price is below the low of the breakaway candle. It is very likely you may hit stop loss soon (intraday session low). It won't be a bad idea to cut loss before stop loss hit.
4. 🔂Reentry with confidence after stop loss🔂: a stop loss will not invalidate the indicator. If you see a second chance to reenter, you should still follow the trade guide and rule.
5. 🕔Time frame matter🕔: try 1m, 3m, 5m, 10m, 15m time frame. Over time, you should know what time frame work best for you and the market. Higher time frame will reduce the noise of false positive trade, but it comes with a higher stop loss placement and less max profit, however it may come with a lower draw down. Time frame will matter depending on the range of the session. If the session range is small (<0.5%), lower time frame is good. If session range is big (>1%), 5m time frame is better. Remember to wait for candle to close, if you use higher time frame.
Last Mention:
The indicator is only used for bullish side trading.

Fair Value Gap Suite Adrian V1.0.0Brief description
The “FVG Suite” identifies fair value gaps across multiple time units, evaluates them with a displacement score, optionally filters them according to market structure events (BOS/CHOCH), and provides context-based alerts for first touch, partial and full fills, and invalidation. The aim is to show only high-quality imbalances and trade them based on rules.
What makes the script unique (originality/added value)
Displacement score: Strength of the impulse movement as a combination of (body/ATR, range/ATR, volume Z-score).
MTF aggregator: FVGs from higher timeframes are collected, ranked, and displayed as zones on the active chart (including overlap clustering).
Structure context: Optionally, only FVGs after confirmed BOS/CHOCH in the trend direction, including premium/discount evaluation relative to the HTF range.
Adaptive invalidation: FVG expires after candles, opposing BOS or defined time (e.g., end of session).
Session/instrument filter: Time window (e.g., NY/LDN), minimum tick size, ATR-based minimum gap.
Smart fill logic: Distinguishes between first touch, partial fill (≥ %), full fill (100%); alarms per event.
Statistics overlay (optional): Hit rate/expectancy per TF & session for fine-tuning the filters.
How it works (conceptually)
FVG definition (3-candle pattern): Bullish if High < Low (bearish analog). Size = gap span in points.
Quality score:Score = w1*(|Body|/ATR) + w2*(Range/ATR) + w3*(Volume-Z), normalized to 0–100.
MTF scan: List of higher TFs: (customizable). Findings are merged, ranked, and displayed as zones with priority (color/opacity).
Context filter: Only FVGs that emerge after BOS/CHOCH in the direction of the current trend; optional exclusion in premium/discount areas.
Invalidation & alerts: A zone is considered active until the invalidation rule takes effect. Alerts are triggered upon: initial contact, partial/full filling, invalidation.
Important inputs
Min. FVG size: × ATRor ticks/points
Min. displacement score: (0–100)
MTF list:
BOS/CHOCH filter: On/Off (Lookback candles)
Session filter: NY/LDN/Asia (local time, weekend toggle)
Invalidation: maxBars = , Opposite BOS = On/Off, Session End = On/Off
Fill definitions: Partial fill ≥ % of the gap; Full fill = 100%
Overlay options: Zone color/transparency, HTF label, statistics overlay On/Off
Alerts (names & triggers)
FVG Suite – First Touch: Price touches an active FVG zone for the first time.
FVG Suite – Partial Fill: Partial fill ≥ configured threshold.
FVG Suite – Full Fill: Gap completely filled.
FVG Suite – Invalidated: Zone invalidated by rules. (Alert message contains: symbol, TF of the zone, direction, score, size, trigger rule.)
Use (best practices)
Trade in the trend direction with BOS/CHOCH filter; target counter-imbalances/liquidity pools.
Use session filters to avoid news spikes/illiquid periods.
Calibrate parameters for each market/TF (ATR/volume profiles differ).
Limitations
Structure labels can be reevaluated for new highs/lows (repainting of labels, not of FVG finds).
Spreads/news can generate “pseudo fills.”
Backtests/statistics are sample-dependent; no guarantee of results.
Changelog
v1.0 – First release (score model, MTF aggregator, BOS/CHOCH filter, fill alerts).
Credits
FVG concept: public ICT/SMC literature (general idea). Implementation/scoring, MTF ranking, smart fill logic: own development.
Note/disclaimer
No financial advice. For educational purposes only. Trading involves high risk; use stop losses and a fixed risk budget.
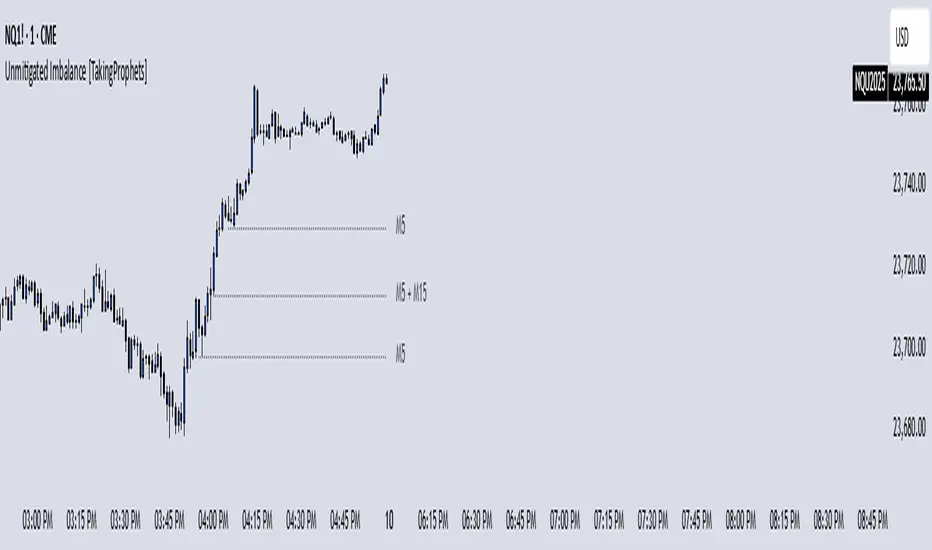
Unmitigated Imbalances [TakingProphets] (High Timeframe)Unmitigated Imbalances
Unmitigated Imbalance is designed to automatically detect and display active Fair Value Gaps (FVGs) across multiple higher timeframes and your current chart. It only keeps the ones that remain unmitigated, helping you clearly see where price has “unfinished business” and potential liquidity draw areas. The tool extends these levels forward until they are tagged according to your chosen mitigation criteria, then removes them automatically.
The indicator uses the classic 3-bar FVG structure:
– Bearish FVG forms when the low of the third candle back is above the high of the first candle.
– Bullish FVG forms when the high of the third candle back is below the low of the first candle.
– Each detected gap must meet a minimum size threshold, which is determined automatically from the Sensitivity setting and adjusted for the symbol type.
Higher timeframes (up to 4) can be plotted simultaneously with your current chart’s gaps. The script merges overlapping levels from different timeframes into one clean label, showing all the contributing timeframes together (for example: M15 + H1 + H4). This makes it easy to spot high-confluence levels without cluttering your chart.
Key features
– Multi-timeframe detection: up to 4 custom HTFs plus your current chart.
– Automatic gap size filtering based on chosen Sensitivity (High, Medium, Low).
– Choice of Wick or Close-based mitigation logic.
– Lookback control: 1 Day, 1 Week, 1 Month, or Max.
– Combined labels for overlapping gaps with clear timeframe tags.
– Separate color and style settings for each timeframe’s bullish and bearish gaps.
– Labels can be positioned Left, Right, or Center Above for maximum clarity.
– Automatic line extension until mitigation or until they exceed the lookback period.
How to use
Select your desired higher timeframes in the HTF1–HTF4 settings.
Choose the Sensitivity level to control the minimum gap size detected.
Decide on Wick or Close mitigation according to your trading rules.
Use the Lookback setting to limit how far back the script checks for gaps.
Watch for levels where multiple timeframe labels are stacked — these can carry greater significance.
Incorporate the levels into your existing strategy, using them as context rather than entry signals.
Practical notes
– Current timeframe gaps reset each trading day to keep the chart relevant to intraday bias.
– Higher timeframe gaps remain until mitigated or until the lookback period expires.
– Large lookback periods with multiple HTFs can increase chart load — adjust settings as needed.
– This indicator is a mapping and context tool, not a signal generator. Always apply it alongside your own analysis.
Multi Timeframe Fair Value Gap Indicator ProMulti Timeframe Fair Value Gap Indicator Pro | MTF FVG Imbalance Zones | Institutional Supply Demand Levels
🎯 The Most Comprehensive Multi-Timeframe Fair Value Gap (FVG) Indicator on TradingView
Transform Your Trading with Institutional-Grade Multi-Timeframe FVG Analysis
Keywords: Multi Timeframe Indicator, MTF FVG, Fair Value Gap, Imbalance Zones, Supply and Demand, Institutional Trading, Order Flow Imbalance, Price Inefficiency, Smart Money Concepts, ICT Concepts, Volume Imbalance, Liquidity Voids, Multi Timeframe Analysis
📊 WHAT IS THIS INDICATOR?
The Multi Timeframe Fair Value Gap Indicator Pro is the most advanced FVG detection system on TradingView, designed to identify high-probability institutional supply and demand zones across multiple timeframes simultaneously. This professional-grade tool automatically detects Fair Value Gaps (FVGs), also known as imbalance zones, liquidity voids, or inefficiency gaps - the exact areas where institutional traders enter and exit positions.
🔍 What Are Fair Value Gaps (FVGs)?
Fair Value Gaps are three-candle price formations that create imbalances in the market structure. These gaps represent areas where buying or selling was so aggressive that price moved too quickly, leaving behind an inefficient zone that price often returns to "fill" or "mitigate." Professional traders use these zones as high-probability entry points.
Bullish FVG: When the low of candle 3 is higher than the high of candle 1
Bearish FVG: When the high of candle 3 is lower than the low of candle 1
⚡ KEY FEATURES
📈 Multi-Timeframe Analysis (MTF)
- 12 Timeframes Simultaneously: 1m, 3m, 5m, 15m, 30m, 45m, 1H, 2H, 3H, 4H, Daily, Weekly
- Real-Time Detection: Instantly identifies FVGs as they form across all selected timeframes
- Customizable Timeframe Selection: Choose which timeframes to display based on your trading style
- Higher Timeframe Confluence: See when multiple timeframes align for stronger signals
🎨 Three Professional Visual Themes
1. Dark Intergalactic: Futuristic neon colors with high contrast for dark mode traders
2. Light Minimal: Clean, professional appearance for traditional charting
3. Pro Modern: Low-saturation colors for extended screen time comfort
📊 Advanced FVG Dashboard
- Live FVG Counter: Real-time count of active bullish and bearish gaps
- Total Zone Tracking: Monitor all active imbalance zones at a glance
- Theme-Adaptive Display: Dashboard automatically adjusts to your selected visual theme
- Strategic Positioning: Optimally placed to not interfere with price action
🔧 Smart Zone Management
- Dynamic Zone Updates: FVG boxes automatically adjust when price touches them
- Mitigation Detection: Visual feedback when zones are tested or filled
- Color-Coded Status: Instantly see untested vs tested zones
- Extended Projection: Option to extend boxes to the right for future reference
- Timeframe Labels: Optional labels showing which timeframe each FVG originated from
💡 Intelligent Features
- Automatic Zone Cleanup: Removes fully mitigated FVGs to keep charts clean
- Touch-Based Level Adjustment: Zones adapt to partial fills
- Maximum Box Management: Optimized to handle 500 simultaneous FVG zones
- Performance Optimized: Efficient code ensures smooth operation even with multiple timeframes
🎯 TRADING APPLICATIONS
Day Trading & Scalping
- Use 1m, 3m, 5m FVGs for quick scalp entries
- Combine with higher timeframe FVGs for directional bias
- Perfect for futures (ES, NQ, MNQ), forex, and crypto scalping
Swing Trading
- Focus on 1H, 4H, and Daily FVGs for swing positions
- Identify major support/resistance zones
- Plan entries at untested higher timeframe gaps
Position Trading
- Utilize Daily and Weekly FVGs for long-term positions
- Identify institutional accumulation/distribution zones
- Major reversal points at significant imbalance areas
Multi-Timeframe Confluence Trading
- Stack multiple timeframe FVGs for high-probability zones
- Confirm entries when lower and higher timeframe FVGs align
- Professional edge through timeframe confluence
📚 HOW TO USE THIS INDICATOR
Step 1: Add to Your Chart
Click "Add to Favorites" and apply to any trading instrument - works on all markets including stocks, forex, crypto, futures, and indices.
Step 2: Configure Your Timeframes
In settings, select which timeframes you want to monitor. Day traders might focus on 1m-15m, while swing traders might use 1H-Weekly.
Step 3: Choose Your Visual Theme
Select from three professional themes based on your preference and trading environment.
Step 4: Identify Trading Opportunities
For Long Entries:
- Look for Bullish FVGs (green/cyan zones)
- Wait for price to return to untested zones
- Enter when price shows rejection from the FVG zone
- Higher timeframe FVGs provide stronger support
For Short Entries:
- Look for Bearish FVGs (red/pink zones)
- Wait for price to return to untested zones
- Enter when price shows rejection from the FVG zone
- Higher timeframe FVGs provide stronger resistance
Step 5: Manage Risk
- Place stops beyond the FVG zone
- Use partially filled FVGs as trailing stop levels
- Exit when opposite FVGs form (reversal signal)
🏆 WHY THIS IS THE BEST MTF FVG INDICATOR
✅ Most Comprehensive
- More timeframes than any other FVG indicator
- Advanced features not found elsewhere
- Professional-grade visual presentation
✅ Institutional-Grade
- Based on smart money concepts (SMC)
- ICT (Inner Circle Trader) methodology compatible
- Used by professional prop traders
✅ User-Friendly
- Clean, intuitive interface
- Detailed tooltips and descriptions
- Works out-of-the-box with optimal defaults
✅ Continuously Updated
- Regular improvements and optimizations
- Community feedback incorporated
- Professional development by PineProfits
🔥 PERFECT FOR
- Scalpers seeking quick FVG fills
- Day Traders using multi-timeframe analysis
- Swing Traders identifying major zones
- ICT/SMC Traders following smart money
- Prop Firm Traders needing reliable setups
- Algorithmic Traders building systematic strategies
- Technical Analysts studying market structure
- All Experience Levels from beginners to professionals
💎 ADVANCED TIPS
1. Confluence is Key: The strongest signals occur when multiple timeframe FVGs align at the same price level
2. Fresh vs Tested: Untested FVGs (original color) are stronger than tested ones (gray/muted color)
3. Time of Day: FVGs formed during high-volume sessions (London/NY) are more reliable
4. Trend Alignment: Trade FVGs in the direction of the higher timeframe trend for best results
5. Volume Confirmation: Combine with volume indicators for enhanced reliability
📈 INDICATOR SETTINGS
Visual Settings
- Visual Theme: Choose between Dark Intergalactic, Light Minimal, or Pro Modern
- Show Branding: Toggle PineProfits branding on/off
General Settings
- Move box levels with price touch: Dynamically adjust FVG zones
- Change box color with price touch: Visual feedback for tested zones
- Extend boxes to the right: Project zones into the future
- Plot Timeframe Label: Show origin timeframe on each FVG
- Show FVG Dashboard: Toggle the summary dashboard
Timeframe Selection
Select any combination of 12 available timeframes (1m to Weekly)
🚀 GET STARTED NOW
1. Click "Add to Favorites" to save this indicator
2. Apply to your chart - works on any instrument
3. Join thousands of traders already using this professional tool
4. Follow PineProfits for more institutional-grade indicators
⚖️ DISCLAIMER
This indicator is for educational and informational purposes only. It should not be considered financial advice. Always do your own research and practice proper risk management. Past performance does not guarantee future results. Trade responsibly.
© PineProfits - Professional Trading Tools for Modern Markets
If you find this indicator valuable, please leave a like and comment. Your support helps me create more professional-grade tools for the TradingView community!

ICT Confirmed FVG Indicator ICT FVG Indicator (Confirmed by Swings)
Summary
This indicator is designed to identify high-probability Fair Value Gaps (FVGs) by confirming them with market structure. It filters out random imbalances and only highlights the FVGs that are created at the same time as a confirmed ICT Swing High or Swing Low.
The core principle is to connect price imbalances directly to significant shifts in market structure, providing a cleaner and more powerful signal.
What It Does
Identifies Swing Points: Automatically detects and draws confirmed swing highs (resistance) and swing lows (support) on your chart based on the settings you choose.
Finds Fair Value Gaps: It scans the chart for the classic 3-candle FVG pattern (also known as a BISI or SIBI).
Confirms FVGs with Swings: This is the most important feature. The indicator will only draw an FVG box if one of the three candles that created the FVG is also a confirmed swing point. This ensures you are only seeing imbalances that are directly related to a break in market structure.
Invalidates Old FVGs: To keep the chart clean, the indicator will automatically remove an FVG box after the price has fully passed through it a certain number of times (customizable in the settings).
Settings Explained
ICT Swings Settings
Left/Right Strength: Controls the sensitivity of the swing detection. Higher numbers require a more significant, obvious swing point to be confirmed. Lower numbers will identify more minor swings.
Max Swing Lines: Sets the maximum number of swing high and swing low lines to display on the chart at one time.
Swing High/Low Color: Customize the color of the swing point lines.
FVG Settings
Show Bullish/Bearish FVG: Use these checkboxes to turn the bullish (green) or bearish (red) FVG boxes on or off.
Bullish/Bearish FVG Color: Customize the color of the FVG boxes.
FVG Invalidation Threshold: This sets how many times the price can fully close on the other side of an FVG before the box is automatically removed.
Max Active FVGs to Show: Sets the maximum number of FVG boxes to keep on the chart to prevent clutter.
Key Features
High-Probability Signals: Filters out noise by focusing only on FVGs that are confirmed by a shift in market structure.
Clean Visuals: Automatically draws and removes swing lines and FVG boxes to keep your chart uncluttered.
Fully Customizable: Adjust the sensitivity of the swing detection and the appearance of the FVGs to fit your trading style.
Pure ICT Concepts: Built strictly on the principles of Inner Circle Trader for a method-consistent analysis.

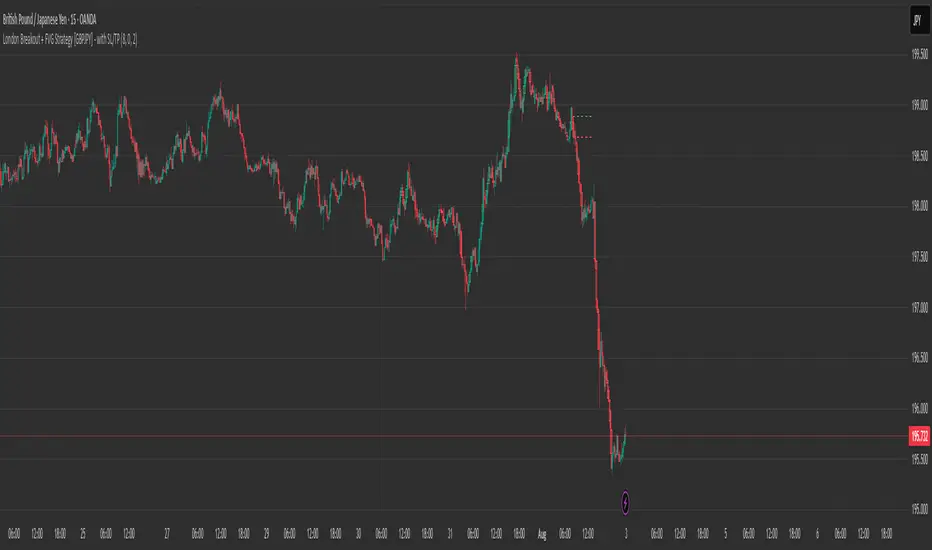
London Breakout + FVG Strategy [GBPJPY] - with SL/TPMarks the London open high and low on 15 min time frame, ads fvg on 5 min for orders
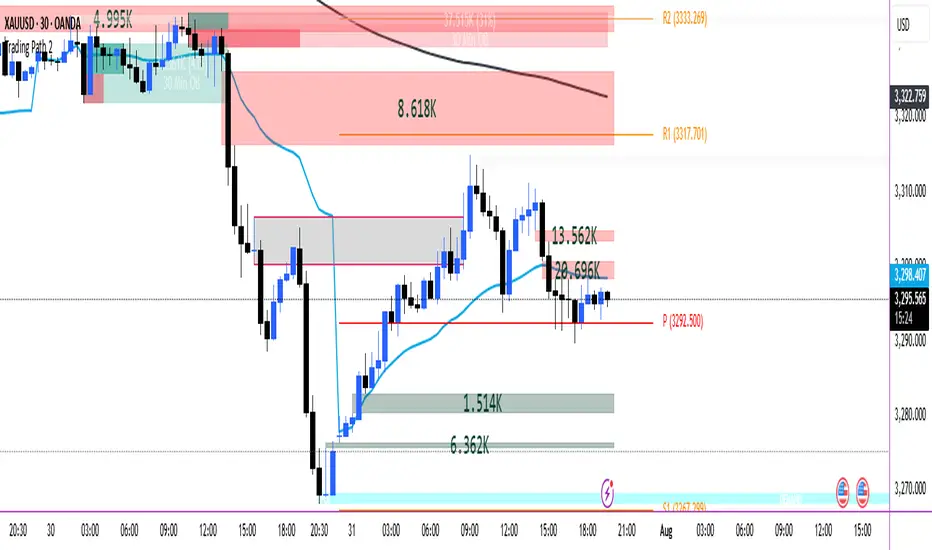
Trading Path
Below indicator are combined in them.
POI
VOLUME FVG
ORDER BLOCKS
VWAP
200 EMA HIGH
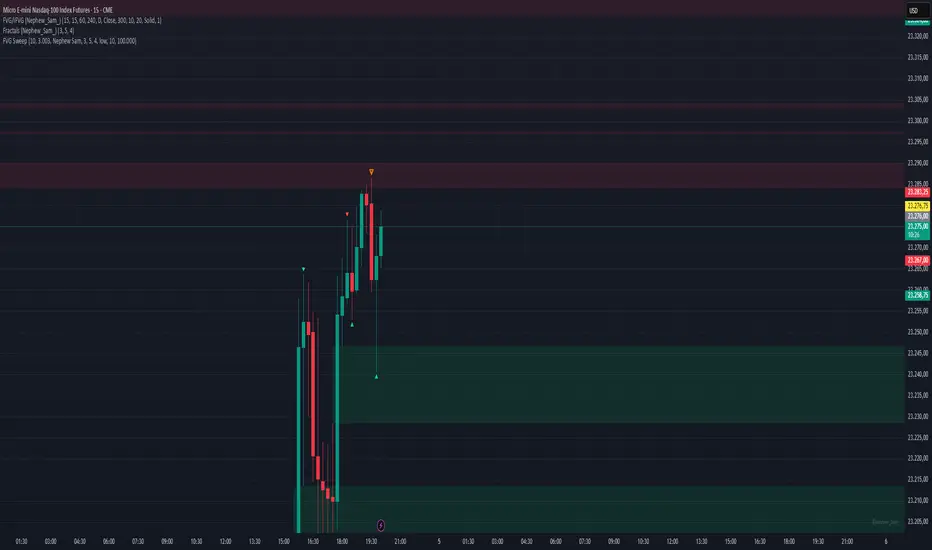
PIVOT
NativeLenSA CISD w/1st 5m FVG5m CISD + FVG Indicator which works best on 5m TimeFrame, with the concept of 5m Liquidity sweeps of the previous highs/lows and the next candle closing below/above the opening price of candle that swept the highs/lows.
A line marking +CISD or -CISD will show as soon as the CISD is created, and a first 5m Fair Value Gap will also be displayed. This is advantageous for an extra confluence and re-entry.
The indicator also provides the trader with:
i. The flexibility of allowing to only show Bearish, Bullish or both Bearish and Bullish CISD + FVG,
ii. Showing only London Session, New York Session, or both London and New York Sessions' CISD & FVG,
iii. Option of hiding/showing 5m CISD+FVG on time frames greater than 5m,
iv. Adjustable:
(a) Look back bars (max=300),
(b) CISD line length,
(c) FVG line length,
v. Customizable Bearish and Bullish CISD line colors.
I hope you find value in this indicator, and convenient for time when trading, no CISD markups needed

Mirror US10YThis TradingView script is designed to automatically detect the asset you are viewing (stock, commodity, or crypto) and, if it matches a long list of supported tickers, overlays a "mirror" subchart. This subchart plots the price action of a related pair—typically the asset divided by the US 10-Year Treasury yield (US10Y), or another relevant macro or sector index. The script also detects and visualizes "Imbalance Fair Value Gaps" (IFVGs) on the subchart, and can trigger alerts when these gaps are filled.
1. Automatic Subchart Detection
The script first checks which symbol you are viewing.
If it matches a list of supported stocks or commodities (e.g., NVDA, TSLA, GOLD), it sets a corresponding subchart pair (e.g., NVDA/US20Y, GOLD/US10Y).
If it’s a crypto asset, it checks both the exchange and the symbol, and sets a subchart like BINANCE:ADAUSDT/US10Y.
If a match is found, it enables plotting for the subchart.
2. Subchart Data Fetching
Once a subchart is selected, the script fetches its OHLCV data (open, high, low, close) and a 200-period ATR (Average True Range) using request.security.
It then plots the subchart’s candlesticks in white (bullish) or red (bearish).
3. IFVG (Imbalance Fair Value Gap) Detection
The script defines custom types and arrays to track bullish and bearish IFVGs and their "invalidation" (when the gap is filled).
It detects IFVGs by looking for price gaps between the current and previous candles, filtered by ATR to avoid noise.
When a gap is detected, it is stored in an array with its coordinates and direction.
4. IFVG Management and Visualization
The script manages the lifecycle of each IFVG: it tracks when a gap is filled (invalidated) and moves it to a separate array.
It draws colored boxes and dashed lines on the chart to visualize the last few IFVGs, using green for bullish and red for bearish.
When a gap is filled, it places a label (▲ or ▼) at the fill point.
5. Alerts
The script sets up two alert conditions: one for a bullish IFVG fill, and one for a bearish IFVG fill.
These can be used to trigger TradingView alerts for trading signals.
6. Debugging and Info Labels
The script displays labels on the chart showing the detected ticker and the subpair being plotted, for clarity.
This indicator is even more reliable when combined with the Mirror 2 indicator, which shows the same system but mostly with the BTC pair in crypto.
Both the Mirror US10Y and Mirror 2 also allow you to see the main inverse pairs in stocks.

FVG-Bully BearsFVG-Bully Bears Indicator
The FVG-Bully Bears indicator is a powerful tool designed to identify Fair Value Gaps (FVGs) on your TradingView charts. FVGs are price gaps that occur when the market moves sharply, leaving areas where little to no trading activity took place. These gaps often act as key support or resistance zones, making them valuable for traders looking to spot potential reversal or continuation points.
This indicator highlights Bullish FVGs (potential support zones) and Bearish FVGs (potential resistance zones) with customizable boxes and labels, helping you visualize these critical price levels with ease.
Features
Bullish and Bearish FVGs: Detects gaps where price has left untested areas, marking bullish (green) and bearish (red) FVGs.
Customizable Display: Choose to show or hide bullish/bearish FVGs, adjust colors, and control box visibility.
FVG Labels: Optional labels on each FVG box to clearly identify bullish or bearish gaps, with adjustable text size.
Delete Filled FVGs: Automatically removes FVGs once price revisits and fills the gap, keeping your chart clean.
Box Extension: Extend FVG boxes into the future (up to 100 bars) to track unfilled gaps over time.
Performance Optimization: Limits the number of displayed FVG boxes (default: 50) to ensure smooth chart performance.
How It Works
Bullish FVG: Identified when the high of a candle two bars ago is lower than the low of the current candle, indicating a sharp upward move.
Bearish FVG: Identified when the low of a candle two bars ago is higher than the high of the current candle, indicating a sharp downward move.
FVGs are drawn as colored boxes (green for bullish, red for bearish) and can include labels for easy identification.
If enabled, filled FVGs (where price revisits the gap) are deleted to reduce chart clutter.
Settings
FVG Settings
Show Bullish FVGs: Enable/disable bullish FVG boxes (default: enabled).
Show Bearish FVGs: Enable/disable bearish FVG boxes (default: enabled).
Bullish FVG Color: Customize the color and transparency of bullish FVG boxes (default: light green).
Bearish FVG Color: Customize the color and transparency of bearish FVG boxes (default: light red).
Max FVG Boxes: Set the maximum number of FVG boxes displayed (default: 50, range: 1–500).
Extend FVG Boxes (Bars): Extend FVG boxes into the future by a specified number of bars (default: 8, range: 0–100).
Show FVG Labels: Enable/disable text labels on FVG boxes (default: enabled).
Label Size: Choose the size of FVG labels (options: Tiny, Small, Normal, Large, Huge; default: Small).
Delete Filled FVGs: Automatically remove FVGs when price fills the gap (default: enabled).
How to Use
Add the FVG-Bully Bears indicator to your TradingView chart.
Customize the settings to match your trading style (e.g., adjust colors, toggle labels, or change box extensions).
Watch for green (bullish) and red (bearish) FVG boxes:
Bullish FVGs: Potential support zones where price may bounce or consolidate.
Bearish FVGs: Potential resistance zones where price may reverse or stall.
Use FVGs in combination with other indicators (e.g., support/resistance, trendlines) for better trade decisions.
If “Delete Filled FVGs” is enabled, filled gaps will disappear, keeping your chart focused on active FVGs.
Ideal For
Swing Traders: Identify key price zones for entries or exits.
Day Traders: Spot intraday support/resistance levels created by rapid price moves.
Price Action Traders: Use FVGs to confirm market structure and potential reversal points.
Notes
For best performance, keep “Max FVG Boxes” at a reasonable value (e.g., 50) to avoid chart lag.
FVGs are most effective on lower timeframes (e.g., 5m, 15m, 1H) but can be used on any timeframe.
Combine with other tools like volume or trend indicators for a complete trading strategy.
Enjoy trading with FVG-Bully Bears and take advantage of Fair Valu

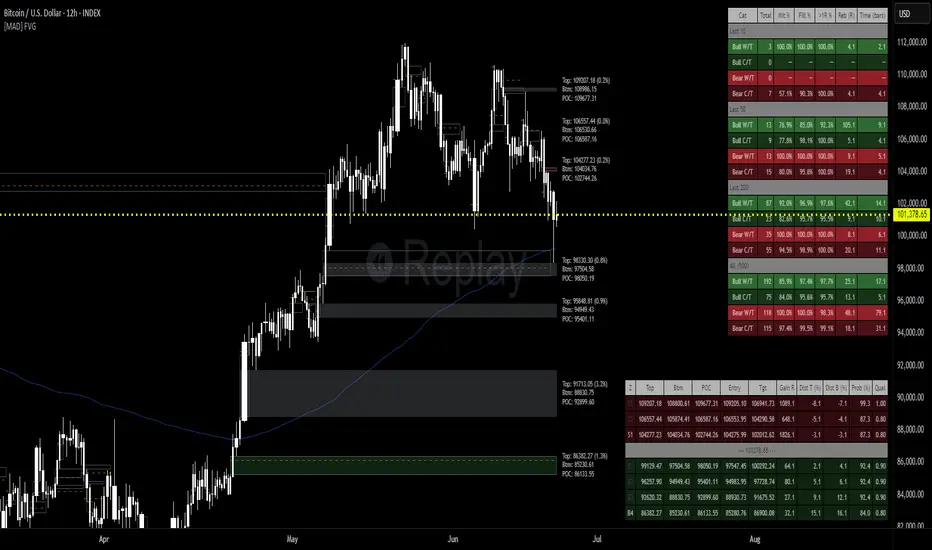
[MAD] FVG with LTF-POC/TPOOverview
The Fair Value Gap (FVG) Detector is a precision tool designed to automatically identify, draw, and track market inefficiencies. These gaps, also known as imbalances, often act as powerful magnets for future price action.
This indicator handles the entire lifecycle of an FVG: from its creation and extension, to the moment it is first touched, and through its entire mitigation process. To add an even deeper layer of analysis, it can now optionally plot two types of micro-analysis lines for the middle candle of the FVG pattern: a volume-based Point of Control (LTF-POC) and a time-based Time Price Opportunity (LTF-TPO). These high-precision lines pinpoint the most significant price levels within the imbalance itself.
By providing a clean and objective visualization of these critical price zones, the FVG Detector gives traders a clear framework for spotting high-probability setups and understanding how the market returns to areas of inefficiency to become balanced once again.
█ How It Works
The indicator’s logic is built on precise detection, dynamic visualization, and intelligent state tracking to provide a comprehensive view of market imbalances.
⚪ The FVG Detection Engine
At its core, the indicator uses a classic three-candle pattern to identify FVGs. This mechanical definition removes all subjectivity:
Bullish FVG: A gap is identified when the high of the first candle is lower than the low of the third candle. The space between these two prices creates the bullish FVG.
Bearish FVG: A gap is identified when the low of the first candle is higher than the high of the third candle. The space between these two prices creates the bearish FVG.
⚪ Dynamic Drawing and Mitigation
Once an FVG is detected, the indicator automatically draws a colored box to represent the gap. This box is then managed through its entire lifecycle:
Extension: If enabled, the FVG box extends forward in time with each new candle, acting as a visible, forward-looking zone of interest.
Partial Mitigation Trigger: The moment price first "touches" the gap, the box changes color to signal that it is no longer a fresh, unmitigated zone. The statistics table counts this as a "Partially Mitigated" event.
Shrinking FVG: As price moves further into the gap, the colored box dynamically shrinks, providing a real-time visual of how much of the imbalance has been filled.
Historical Outline: An optional secondary outline box is drawn to preserve the FVG's original size. This outline stops extending when the FVG is first touched, leaving a permanent historical marker.
⚪ Optional LTF Analysis for Added Precision
The indicator can look "inside" the FVG's middle candle to find its most significant price levels.
LTF-POC (Volume-Based): Using data from a lower timeframe, it analyzes the volume profile of the FVG-creating candle to find the single price level from the lower-timeframe bar with the highest trading volume.
LTF-TPO (Time-Based): It also identifies the Time Price Opportunity by dividing the candle's price range into distinct "bins." The script counts how many lower-timeframe price ticks occurred in each bin, and the TPO line is drawn at the center of the busiest bin.
Visual Confluence: These are drawn as distinct horizontal lines (defaulting to orange for POC and yellow for TPO) that extend and are managed alongside the FVG's historical outline, serving as precise levels of interest within the broader FVG zone.
█ Why This Indicator is Different
While many traders can spot FVGs manually, this indicator offers a significant edge through the possibility of the lowertimeframe analysis and showing the syntetic TPO or POCs for the relevant candles.
⚪ Automated and Objective
The market moves fast, and manually drawing FVGs is impractical and prone to error. This tool automates the entire process.
Never Miss a Gap: The detector impartially scans every three-candle sequence, ensuring no FVG is missed.
No Subjectivity: The rules for detection, mitigation, and LTF analysis are based on fixed mathematical models, removing subjective judgment.
Multi-Timeframe Clarity: The indicator works flawlessly on any timeframe, allowing you to maintain a consistent view of market structure.
⚪ Visualizing Market Memory
This tool does more than just draw boxes; it tells a story. Watching a box change color and shrink provides a visual of market dynamics in action. The optional historical outlines and LTF analysis lines build a "map" on your chart, showing where significant reactions and high-liquidity zones occurred in the past, which provides invaluable context for future price movements.
█ How to Use
⚪ Identifying High-Probability Zones
The primary use of the FVG Detector is to identify high-probability zones where price may react.
Entries: Unmitigated (fresh) FVGs can serve as powerful entry zones. Traders may look for price to return to a bullish FVG to take a long position, or to a bearish FVG to take a short position.
Targets: An FVG in your path can also act as a logical profit target. For example, if you are in a long position, you might take profit as price fills a nearby bearish FVG above you.
⚪ Confluence and Confirmation
FVGs are most powerful when they align with other forms of technical analysis. Look for FVGs that have "confluence" with:
Market Structure: A bullish FVG found at a key support level or after a bullish break of structure is a higher-probability setup.
Order Blocks: An FVG that overlaps with a bullish or bearish order block creates a very potent point of interest.
Premium/Discount Zones: FVGs found deep in a premium (for shorts) or discount (for longs) area of a trading range often yield strong reactions.
The LTF Lines (POC & TPO): Use these lines as a source of internal confluence. While the FVG gives you a zone, the POC and TPO give you precise levels within that zone. The POC shows where the highest volume was traded, while the TPO shows where price spent the most time. Confluence between these two lines can signal an extremely strong level.
█ Settings
Max Number of FVGs to Display: Controls how many active FVGs are kept on the chart to prevent clutter and maintain performance.
Extend Unmitigated FVGs: When enabled, FVG boxes will extend to the right until price touches them.
Show Bullish/Bearish FVGs: Toggles the visibility of bullish or bearish FVGs.
Show FVG Labels: Toggles the visibility of the "FVG" text labels.
Keep Mitigated Outlines: If checked, the historical outline box (and its associated POC/TPO lines) will remain on the chart even after the FVG is completely filled.
Show Statistics: Toggles the visibility of the statistics table, which tracks total, partly mitigated, and fully mitigated FVGs.
Show LTF-TPO (Time-Based): Toggles the calculation and display of the Time Price Opportunity line.
Show LTF-POC (Volume-Based): Toggles the calculation and display of the Point of Control line.
Use Custom LTF for Analysis: Check this to manually select a timeframe for the POC/TPO calculation. If unchecked, the script auto-selects a lower timeframe.
Lower Timeframe: The specific lower timeframe to use when the "Custom LTF" box is checked.
Magnifier (Bars per Slice): Controls how the script auto-selects a lower timeframe (higher number = lower timeframe). Only active when "Custom LTF" is unchecked.
█ The Logic Explained
This indicator uses a clear, rules-based system based on mathematical and conditional principles.
The 3-Candle FVG Pattern
The detection engine precisely identifies FVGs by comparing the price extremes of a three-candle sequence. For a bullish FVG, it confirms that the high of the first candle is strictly below the low of the third candle. For a bearish FVG, the low of the first candle must be strictly above the high of the third. This leaves an objective, unfilled gap in the market.
The Mitigation and Shrinking Process
Once an FVG is created, the indicator monitors it on every subsequent bar. The moment a candle's price action enters the FVG's zone, it's flagged as "partially mitigated," and its color changes. The script then continues to track how far price pushes into the gap, dynamically shrinking the box to visually represent the remaining imbalance.
Lower-Timeframe (LTF) Analysis Explained
To add precision, the indicator performs a micro-analysis of the middle candle of the FVG pattern. This is achieved by mathematically deconstructing that single candle using data from a smaller timeframe.
The lower timeframe is determined either manually or automatically via the Magnifier. The Magnifier works by dividing the chart's current timeframe. For example, on a 60-minute chart, a Magnifier of 60 tells the indicator to perform its analysis using 1-minute data (60÷60=1).
Once the LTF data is obtained, two calculations are performed:
LTF Point of Control (Volume-Based): This method seeks the price of maximum commitment. The indicator analyzes the volume of every single lower-timeframe bar within the main candle and identifies the one bar with the highest trading volume. The closing price of that specific high-volume bar is designated as the POC.
LTF Time Price Opportunity (Time-Based): This method finds the price where the market spent the most time trading. The process is a form of price distribution analysis:
The total price range (high to low) of the main candle is measured.
This range is divided into 40 equal price zones, or "bins". For a candle with a $2 range, each bin would represent a price slice of 5 cents
The indicator then counts how many of the lower-timeframe closing prices fall within each of the 40 bins.
The TPO line is drawn at the midpoint of the single bin that contained the most prices, representing the "busiest" price level.
Time-Based Drawing for Accuracy
To ensure perfect alignment across all historical data and chart reloads, all drawings are anchored to the precise timestamp of the bar, not its sequential position on the chart. This robust method guarantees that all zones remain fixed and accurate regardless of how much historical data is loaded.
█ Disclaimer
Investors are fully responsible for any investment decisions they make.
Have fun trading :-)
Fair Value MSThis indicator introduces rigid rules to familiar concepts to better capture and visualize Market Structure and Areas of Support and Resistance in a way that is both rule-based and reactive to market movements.
Typical "Market Structure" or "Zig-Zag" methods determine swing points based on fixed thresholds (length or percentage). While this does provide rigid structure, the results may be lagging or confusing due to the timing, since it is fixed to static parameters.
I believe the concept of Fair Value Gaps can solve this problem.
As you will notice, there are no length settings in this indicator.
> FVG Market Structure
Fair Value Gaps are a well known concept used to indicate directional intent, forming when price moves aggressively in one direction, leaving behind an imbalance between buyers and sellers. While the term FVG was popularized by ICT, the underlying concept predates them, known historically as imbalances, inefficiencies, or liquidity voids in institutional trading.
Note: For simplicity, in this indicator they'll be called FVGs.
By reading into this, we are able to clearly and rigidly define market structure simply by "looking" at the chart, using objective price events rather than subjective interpretation, or lengths.
By using FVGs to determine structure direction, the length, and speed of identification lies entirely on the market. If an FVG Down occurs immediately after a New Higher High forms, it is reasonable to assume there was a seller at that point, so the script would indicate a New Swing High.
The script is NOT stuck, waiting for a % retrace, or # bars to pass to identify it as such.
Sometimes the market is in a steady trend in a single direction and no FVGs form; therefore, no structure forms. -> Why would we try to impose structure on a clear trend?
Ultimately, the FVG Structure Method uses real reactions from the market to determine Market structure, and is not fixed to specific parameters.
As with other market structure indicators, "Market Structure Breaks" are still identifiable when price moves outside the most recent swing points.
These are helpful to indicate larger direction. In the following section you will see how these help us determine when we should start the search for an "Area of Interest (AOI)".
> Areas of Interest (AOIs)
"Area of Interest (AOI)" is a generalized term, and could refer to many types of zones you might recognize under different names. While the AOIs in this indicator are specialized in their own way, I have chosen to simply use the term "Area of Interest" because it’s more important to understand how they behave and why they exist than to focus on what they’re called.
The goal of an AOI is to point out reasonable areas where buyers or sellers may be staging, as is typical with support and resistance.
In order to reasonably identify these areas, we look for cause and effect relationships. When considering these relationships, it's easier to understand the placement of the points to define each zone.
(Buyer Examples)
Cause: Strong Buyers step in at Swing Low
Effect: Fair Value Gap Forms
Cause: Sustained Buying Pressure
Effect: Market Structure Breaks
In this example, The zone is drawn from the Swing Low, to the Bottom of the FVG closest to the swing point.
In theory, the participation at the swing point was strong and aggressive enough to create the FVG imbalance. Which then found acceptance and continued into a Market Structure Break. So with these AOIs, we are trying to locate the aggressive Buyers or Sellers which were positioned BEFORE the FVG.
These Zones are intended to act as areas to look for reactions from market participants, to judge where price may be going. When revisiting these zones, we look for a reaction or a break, to further provide us information to if the buyers or sellers are still there.
As seen in the screenshot above, The information we gain is not from the creation of these zones, but from the behavior we witness when these zones are revisited.
Technical Note: In this indicator, Market Structure Breaks are only considered when price closes outside the recent swing points. Wicks are not considered as confirmation, therefore are not used to detect structural breaks.
Inside each AOI you can optionally display a readout of the volume which accumulated during the time starting at the swing point and going until the closing bar of the FVG.
Note: We are counting volume until the closing bar of the FVG since the FVG is a 3 bar formation, and aggressive volume is required throughout to create the imbalance.
There are multiple FVGs that typically occur in a single direction, but we do not look to every single one to be indicative of structure, only the first FVG in the opposite direction of the previous direction (which is determined by previous FVGs)
You will probably notice, the AOIs do not form from the closest swing or FVG to the break, this is because we are targeting larger directional changes to draw these AOIs from.
Since they do not always happen perfectly every time, the AOI formation waits for an FVG to occur AND a Market structure break to happen. One without the other will result in no Zone displaying.
> Reflection Lines
While they may seem slightly redundant, Reflection Lines serve as reminders of previous support and resistance pivots. They are drawn at the same Pivots where and AOI is formed, and extend beyond the mitigation of the AOI.
These lines are often points of price to look for "Support Flips", a re-test pattern where price trades through previous support (or resistance) then returns to it and rejects, continuing into a larger move or trend.
Their namesake is based on the behavior of price, "reflecting" at these levels.
The Reflection lines are simple and change color based on price's location.
If price is above, we would typically look to a reflection line in with support in mind.
As a basic filter, these lines use an average price to determine their color, this way they will not change their color as frequently in choppy situations.
> Session Start/End Lines
For analysis purposes and trade review, it is helpful to analyze with context.
For that reason, I have implemented start and end session lines into the indicator, these are helpful when reviewing historical charts to not provide additional context.
By default, they are set to the NYSE Session, but can be changed to fit any needs.
These lines are not advanced, and simply draw a line as the chart passes the start and end of the sessions. It's very likely that you may need to adjust the session for your specific needs.
Note: The Timezone can be adjusted within the code if needed. By Default, the indicator uses "America/New_York" Timezone.
> Conclusion
If you’ve ever felt like your structure tools were confusing or lagging, drawing zones too late, or zones that simply don't make sense, this should feel like a breath of fresh air.
By removing arbitrary length settings and instead using FVGs to define structure and as a basis for AOIs, you're getting a more accurate look at what price is doing and where it's reacting from.
This indicator is rule-based, reactive, and aims to keep things logical without fluff or false confidence.
Enjoy!

Price Ranged FVG📌 Price Ranged FVG
Is a clean and efficient tool designed to detect Fair Value Gaps (FVGs) with adjustable filters and structural context. It’s especially useful for traders looking to filter out insignificant gaps and focus on high-probability areas, particularly around swing breaks or structural shifts.
🧠 What is a Fair Value Gap (FVG)?
A Fair Value Gap appears when there’s a price imbalance between candles — typically after a strong move — where the market skips over certain price levels without trading there. These zones can act as potential areas for price to return to (mean reversion), or serve as support/resistance depending on market structure.
🔍 FVG Detection Types
You can choose between three different detection modes under the "FVG Detection" input:
Same Type: Only detects FVGs where the last 3 candles are in the same direction (all bullish or all bearish).
All: Detects any FVG, regardless of candle direction.
Twin Close: Detects FVGs only when the last two candles are in the same direction and close accordingly — offering a stricter confirmation.
🎯 FVG % Filters
To filter out noise or insignificant gaps, this indicator includes:
Minimum FVG % Filter: Ignores FVGs smaller than your specified percentage of the current close.
Maximum FVG % Filter: Ignores overly large gaps that may be unreliable or caused by anomalies.
These filters help focus on relevant FVGs that are more likely to act as reaction zones.
🏛 Structural Context (Swing Highs and Lows)
The indicator plots swing highs and swing lows with dots to provide structure-based context:
Set Swing Strength to 3 for detecting internal structure (shorter-term moves).
Use a higher setting like 5 to focus on external structure (more significant highs/lows).
These levels can help you determine whether an FVG is forming within a consolidation, breakout, or key structural transition.
✅ Use Case (My Personal Workflow)
I personally use this indicator to:
Filter out weak or irrelevant FVGs using the % filters.
Watch for price interaction at swing breaks — especially when an FVG aligns with a break in internal or external structure.
Refine entry and exit planning in confluence with other tools or strategies.
⚠️ Disclaimer
This indicator is not financial advice. It is a technical analysis tool intended to support your own decision-making process. Always do your own research and risk management.

Logistic Regression ICT FVG🚀 OVERVIEW
Welcome to the Logistic Regression Fair Value Gap (FVG) System — a next-gen trading tool that blends precision gap detection with machine learning intelligence.
Unlike traditional FVG indicators, this one evolves with each bar of price action, scoring and filtering gaps based on real market behavior.
🔧 CORE FEATURES
✨ Smart Gap Detection
Automatically identifies bullish and bearish Fair Value Gaps using volatility-aware candle logic.
📊 Probability-Based Filtering
Uses logistic regression to assign each gap a confidence score (0 to 1), showing only high-probability setups.
🔁 Real-Time Retest Tracking
Continuously watches how price interacts with each gap to determine if it deserves respect.
📈 Multi-Factor Assessment
Evaluates RSI, MACD, and body size at gap formation to build a full context snapshot.
🧠 Self-Learning Engine
The logistic regression model updates on each bar using gradient descent, refining its predictions over time.
📢 Built-In Alerts
Get instant alerts when a gap forms, gets retested, or breaks.
🎨 Custom Display Options
Control the color of bullish/bearish zones, and toggle on/off probability labels for cleaner charts.
🚩 WHAT MAKES IT DIFFERENT
This isn’t just another box-drawing indicator.
While others mark every imbalance, this system thinks before it draws — using statistical modeling to filter out noise and prioritize high-impact zones.
By learning from how price behaves around gaps (not just how they form), it helps you trade only what matters — not what clutters.
⚙️ HOW IT WORKS
1️⃣ Detection
FVGs are identified using ATR-based thresholds and sharp wick imbalances.
2️⃣ Behavior Monitoring
Every gap is tracked — and if respected enough times, it becomes part of the elite training set.
3️⃣ Context Capture
Each new FVG logs RSI, MACD, and body size to provide a feature-rich context for prediction.
4️⃣ Prediction (Logistic Regression)
The model predicts how likely the gap is to be respected and assigns it a probability score.
5️⃣ Classification & Alerts
Gaps above the threshold are plotted with score labels, and alerts trigger for entry/respect/break.
⚙️ CONFIGURATION PANEL
🔧 System Inputs
• Max Retests – How many times a gap must be respected to train the model
• Prediction Threshold – Minimum score to show a gap on the chart
• Learning Rate – Controls how fast the model adapts (default: 0.009)
• Max FVG Lifetime – Expiration duration for unused gaps
• Show Historic Gaps – Show/hide expired or invalidated gaps
🎨 Visual Options
• Bullish/Bearish Colors – Set gap colors to fit your chart style
• Confidence Labels – Show probability scores next to FVGs
• Alert Toggles – Enable alerts for:
– New FVG detected
– FVG respected (entry)
– FVG invalidated (break)
💡 WHY LOGISTIC REGRESSION?
Traditional FVG tools rely on candle shapes.
This system relies on probability — by training on RSI, MACD, and price behavior, it predicts whether a gap will act as a true liquidity zone.
Logistic regression lets the system continuously adapt using new data, making it more accurate the longer it runs.
That means smarter signals, fewer false positives, and a clearer view of where real opportunities lie.

MTF FVG with Hit Counter HarmoniXTradeMain Purpose of the Indicator:
This indicator is designed to automatically identify Fair Value Gaps (FVG) across three different timeframes simultaneously. The primary goal is to display these key zones on the chart and provide detailed information about price interaction with these levels, enabling traders to make more informed decisions.
Key Features:
Multi-Timeframe FVG Identification:
By default, the indicator identifies and displays FVGs on the Weekly (W), Daily (D), and 4-Hour (240) timeframes.
Users can customize these timeframes in the settings to fit their preferences.
Detailed Hit Counter:
This indicator goes beyond simply showing FVGs; it accurately counts the number of times the price has touched each of the three key FVG levels:
Up: The top line of the FVG
Mid: The midline (equilibrium) of the FVG
Down: The bottom line of the FVG
This information is displayed in a clear label next to each FVG zone, helping traders assess the strength and validity of each level.
Extensive Customization:
Appearance: You can change the colors for bullish and bearish FVGs for each timeframe individually, modify the style of the main and mid lines, and adjust the label size.
Detection Logic: Users can define the minimum size of an FVG for detection based on a percentage or point value.
Mitigation Logic: Two methods are provided for FVG invalidation:
Percentage Mitigation: The FVG is considered mitigated after the price has penetrated it by a specific percentage (e.g., 50%).
Full Fill: The FVG remains valid until the price has completely filled the gap and closed beyond it.
Extend Lines Capability:
To prevent chart clutter and get a better view of future price action, you can extend the FVG lines and labels to the right by a specified number of bars, creating distance from the current candle.
How to Use This Indicator:
Identifying Support and Resistance Zones: FVG areas can act as strong support and resistance levels.
Confirming Entry Points: A price touch and reaction to one of the FVG levels (especially the midline) can be used as a confirmation for entering a trade.
Assessing Level Strength: The number of hits on each level (Up, Mid, Down) indicates which price point within the zone has been more attractive to the market. For example, repeated reactions to the top line of a bearish FVG might suggest strong selling pressure at that level.
Your Feedback for Improvement:
You are invited to use this indicator and share any suggestions, ideas for improvement, or reports of potential issues. Your feedback will be valuable for implementation in future versions.
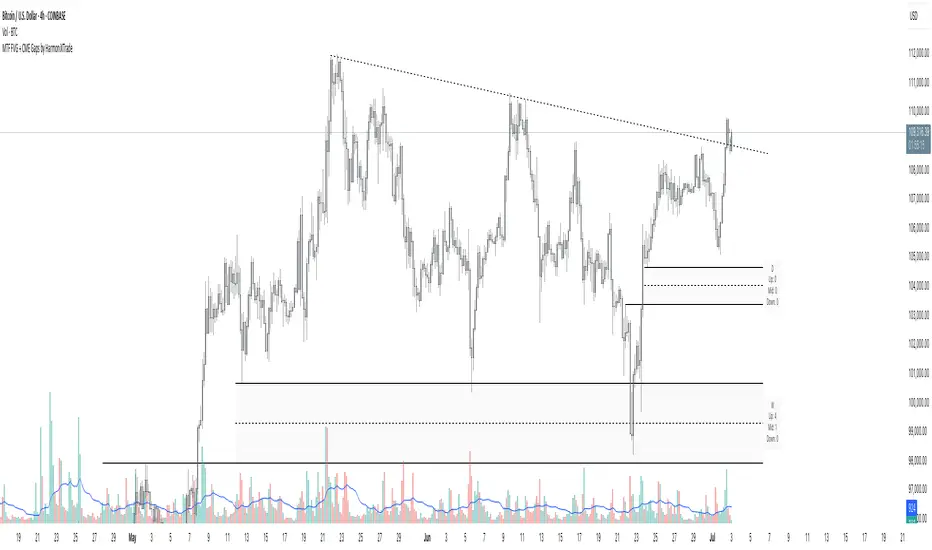
HyperFlowIntroduction
HyperFlow is a premium market structure and liquidity rotation model built around the principles of internal inefficiencies, tested imbalances, and delivery shifts. Drawing inspiration from ICT concepts, it provides a high-level framework for identifying smart money footprints and timing entries with precision.
Rather than forecasting direction, HyperFlow focuses on recognizing repeatable delivery behaviors — helping traders visually track liquidity shifts from internal ranges to external objectives with consistency.
Core Philosophy
Markets are governed by the logic of liquidity engineering — the search and destruction of internal inefficiencies (Fair Value Gaps), followed by continuations toward external liquidity.
Timeframes to use:
HTF -> LTF
5m -> 15s
15m -> 1m
1h -> 5m
4h -> 15m
Daily -> 1h
Weekly -> 4h
Monthly -> 1D
HyperFlow identifies these transitions by:
Detecting High Timeframe Fair Value Gaps (HTF FVGs) — structural imbalances created by displacement
Tracking Valid Tests of those FVGs — signaling willingness to respect internal structure
Filtering for Delivery Confirmations — only acting when price delivers with intent through reclaimed imbalances
Mapping Risk and Objective Zones — using recent swing structures to define stop and target logic rooted in market logic
All components are reactive, visual, and non-repainting — designed to highlight structure after it forms, not anticipate it prematurely.
Key Features
Internal Range Liquidity Zones: Cleanly marked HTF imbalances show where price may seek efficiency
Tested FVG Filtering: Signals only form on valid rebalances — we wait for proof, not potential
Shift in Delivery Conditions: Price must show intent to reclaim imbalance before any rotation is considered
Automatic Objective Mapping: Recent structural highs/lows are used to project stop and target zones automatically
Session Filters + Time Alignment: Restrict signals to high-probability hours or defined killzones
Minimal, High-Impact Visuals: Tested/untested FVGs are differentiated by transparency and tone, keeping your chart clean and focused
HyperFlow is built for:
Traders who understand price delivery theory
Analysts studying displacement → reversion → continuation
Those seeking higher timeframe bias alignment through tested structure
Users of ICT-based concepts who want a visual, rules-based companion
This is not a beginner's tool. It’s for those seeking repeatable execution through structure and refinement, not guesswork.
Terms and Conditions
Our charting tools are products provided for informational and educational purposes only and do not constitute financial, investment, or trading advice. Our charting tools are not designed to predict market movements or provide specific recommendations. Users should be aware that past performance is not indicative of future results and should not be relied upon for making financial decisions. By using our charting tools, the purchaser agrees that the seller and the creator are not responsible for any decisions made based on the information provided by these charting tools. The purchaser assumes full responsibility and liability for any actions taken and the consequences thereof, including any loss of money or investments that may occur as a result of using these products. Hence, by purchasing these charting tools, the customer accepts and acknowledges that the seller and the creator are not liable nor responsible for any unwanted outcome that arises from the development, the sale, or the use of these products. Finally, the purchaser indemnifies the seller from any and all liability. If the purchaser was invited through the Friends and Family Program, they acknowledge that the provided discount code only applies to the first initial purchase of any SMCapital product. The purchaser is therefore responsible for cancelling – or requesting to cancel – their subscription in the event that they do not wish to continue using the product at full retail price. If the purchaser no longer wishes to use the products, they must unsubscribe from the membership service, if applicable. We hold no reimbursement, refund, or chargeback policy. Once these Terms and Conditions are accepted by the Customer, before purchase, no reimbursements, refunds or chargebacks will be provided under any circumstances.
By continuing to use these charting tools, the user acknowledges and agrees to the Terms and Conditions outlined in this legal disclaimer.

FVG fill with immediate rebalance [LuciTech]The "FVG fill with immediate rebalance AKA Golden Arrow" indicator is designed to identify Fair Value Gaps (FVGs) and detect immediate rebalances to highlight potential trading opportunities. It uses colored boxes to mark FVGs and triangular markers to signal bullish or bearish setups, helping traders pinpoint key price levels where imbalances occur and price reactions are likely.
Key Features
FVG Detection: Spots bullish and bearish Fair Value Gaps based on price action, with customizable width settings.
Golden Arrow Signals: Displays triangular markers when price fills an FVG and immediately rebalances, indicating potential reversal or continuation zones.
Customizable Colors: Bullish FVGs appear in green and bearish FVGs in red by default, with options to tweak colors in the settings.
Time Filter: Allows signals to be restricted to a specific time window, highlighted by a background fill for clarity.
Alert System: Supports TradingView alerts for "Bullish Golden Arrow" and "Bearish Golden Arrow" signals to keep traders updated on setups.
How It Works
FVG Calculation: Analyzes gaps between candles to identify FVGs, with user-defined minimum width options (points, percentages, or ATR-based).
Signal Generation: Triggers a Golden Arrow signal when price fills the FVG and rebalances immediately, based on wick penetration and closing conditions.
Visual Aids:
Bullish FVGs are shown as green boxes, bearish FVGs as red boxes.
Upward triangles mark bullish signals, downward triangles mark bearish signals.
Time-Based Filtering: Optionally limits signals to specific hours, with a background fill showing the active period.
