Luminous Trend Wave [Pineify]```
Luminous Trend Wave - Hull MA Based Normalized Momentum Oscillator
The Luminous Trend Wave (Pineify) is a momentum oscillator designed to provide clear, responsive trend signals while minimizing the lag commonly associated with traditional momentum indicators. By combining Hull Moving Average (HMA) calculations with ATR-based normalization and hyperbolic tangent transformation, LTW delivers a bounded oscillator that works consistently across different assets and timeframes.
Key Features
Hull Moving Average foundation for reduced lag trend detection
ATR normalization for universal applicability across all markets
Bounded output range (-100 to +100) using mathematical tanh transformation
Dynamic gradient coloring that reflects momentum intensity
Built-in signal line for momentum confirmation
Automatic alerts for trend reversals and momentum shifts
How It Works
The indicator operates through a four-stage calculation process:
Trend Basis Calculation: The indicator first calculates a Hull Moving Average (HMA) of the closing price. HMA was chosen specifically because it provides significantly less lag compared to Simple or Exponential Moving Averages while maintaining smoothness. This allows the oscillator to respond quickly to genuine price movements.
Distance Measurement: The raw distance between the current close price and the HMA trend line is calculated. This distance represents how far price has deviated from its smoothed trend.
ATR Normalization: The distance is then divided by the Average True Range (ATR) over the same lookback period. This normalization step is crucial - it makes the oscillator readings comparable across different assets regardless of their price levels or typical volatility. A stock trading at $500 and one at $5 will produce equivalent readings when their relative movements are similar.
Tanh Transformation: Finally, the normalized value is passed through a hyperbolic tangent function scaled by a sensitivity multiplier. The mathematical formula (e^2x - 1) / (e^2x + 1) naturally bounds the output between -100 and +100, preventing extreme spikes while preserving the directional information.
Trading Ideas and Insights
Zero Line Crossovers: When the oscillator crosses above zero, it indicates a shift from bearish to bullish momentum. Conversely, crossing below zero signals bearish momentum. These crossovers can be used as entry triggers when confirmed by other analysis.
Overbought/Oversold Levels: Readings above +80 suggest overbought conditions where price has extended significantly above its trend. Readings below -80 indicate oversold conditions. These extremes often precede mean reversion moves.
Signal Line Divergence: When the main oscillator (histogram) is above the signal line, momentum is increasing. When below, momentum is decreasing. This relationship helps identify the strength of the current move.
Momentum Fading: The indicator automatically fades the color intensity when the oscillator value is closer to the signal line than to the extremes, visually indicating weakening momentum before potential reversals.
How Multiple Indicators Work Together
LTW integrates three distinct technical concepts into a cohesive system:
Hull MA + ATR Integration: The Hull Moving Average provides the trend direction while ATR provides the volatility context. Together, they answer not just "where is the trend?" but "how significant is the current deviation relative to normal market movement?"
Mathematical Bounding + Visual Mapping: The tanh transformation ensures readings stay within predictable bounds, while the gradient coloring maps these bounded values to intuitive visual feedback. Strong bullish readings appear in bright green, strong bearish in bright red, with smooth transitions between.
Oscillator + Signal Line System: Similar to MACD's relationship between the MACD line and signal line, LTW uses a WMA-smoothed signal line to filter noise and confirm momentum direction. The interplay between the faster oscillator and slower signal creates actionable crossover signals.
Unique Aspects
Universal Normalization: Unlike many oscillators that produce different reading ranges on different assets, LTW's ATR normalization ensures consistent interpretation whether trading forex, crypto, stocks, or commodities.
Sensitivity Control: The sensitivity parameter allows traders to adjust how aggressively the oscillator responds to price changes. Higher values make it more responsive (useful for scalping), while lower values smooth out noise (better for swing trading).
Visual Momentum Feedback: The gradient coloring and transparency adjustments provide immediate visual feedback about trend strength without requiring traders to interpret numerical values.
How to Use
Add the indicator to your chart - it displays in a separate pane below price.
Watch for zero line crossovers as primary trend signals. Bullish when crossing above, bearish when crossing below.
Use the ±80 levels as caution zones where reversals become more likely.
Monitor the relationship between the histogram and signal line - histogram above signal indicates strengthening momentum.
Pay attention to color intensity - faded colors indicate weakening momentum and potential reversal zones.
Set alerts for automated notifications on trend changes and momentum shifts.
Customization
Trend Lookback (default: 21): Controls the HMA period. Lower values increase responsiveness but may generate more false signals. Higher values provide smoother trends but with more lag.
Signal Smoothing (default: 5): Adjusts the WMA period for the signal line. Higher values create a slower signal line with fewer crossovers.
Sensitivity (default: 1.5): Multiplier for the tanh transformation. Increase for more reactive signals, decrease for smoother readings.
Colors: Fully customizable bullish and bearish colors to match your chart theme.
Gradients: Toggle gradient coloring on/off based on preference.
Conclusion
The Luminous Trend Wave indicator offers traders a mathematically sound approach to momentum analysis. By combining the low-lag properties of Hull Moving Average with ATR-based normalization and bounded output transformation, LTW provides consistent, interpretable signals across any market. The visual feedback system makes trend strength immediately apparent, while the signal line crossovers offer clear entry and exit timing. Whether used as a standalone tool or combined with price action analysis, LTW helps traders identify trend direction, momentum strength, and potential reversal zones with clarity.
```
Freeindicator

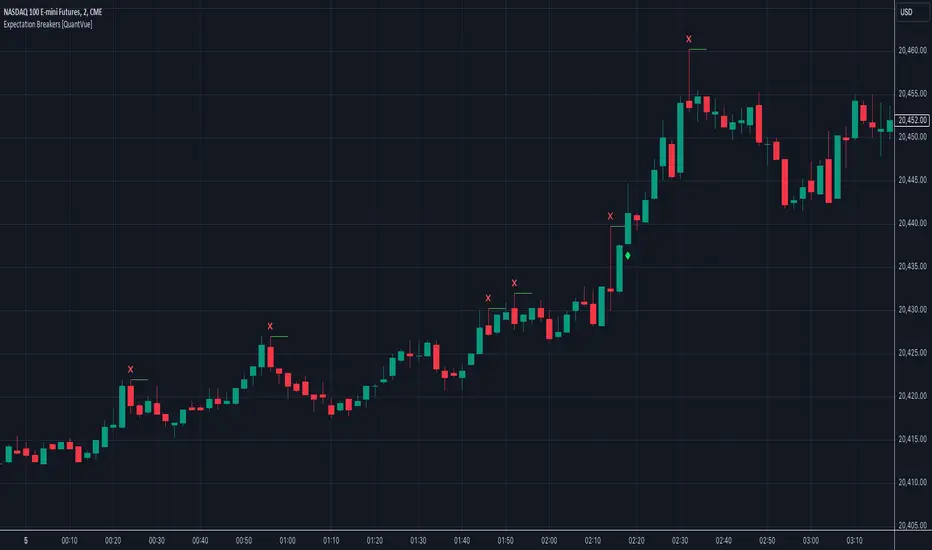
Expectation Breakers [QuantVue]In technical analysis, an "Expectation Breaker" refers to a market event where price action defies typical patterns and anticipated movements, signaling potential shifts in market sentiment and direction.
This indicator looks to take advantage of these opportunities by identifying 2 types of Expectation Breakers: Downside Reversal Buybacks and Upside Reversal Sellbacks.
Downside Reversal
A downside reversals occur when a stock reaches a new high for the user defined lookback period (65 bars by default), and then experiences a larger-than-average drop and closes near its lows. This usually indicates that the market has overextended itself. The expectation is that there will be 2-3 bars of significant selling, following the downside reversal.
However, a notable sign of strength is if the stock rebounds and closes above the downside reversal bar's high within 1-3 bars. This is known as a Downside Reversal Buyback. A rapid recovery following a downside reversal is a powerful bullish indicator, breaking the expectation of lower prices. The quicker price recovers from a downside reversal, the more meaningful it is. Such a swift rebound suggests that the market's strength was underestimated, as downside reversals typically signal a short-term decline.
Upside Reversal
An upside reversal occurs when a stock reaches a new low for the user-defined lookback period (65 bars by default), and then experiences a larger-than-average rise and closes near its highs. This usually indicates that the market has overextended itself to the downside. The expectation is that there will be 2-3 bars of significant buying, following the upside reversal.
However, a notable sign of weakness is if the stock falls back and closes below the upside reversal bar's low within 1-3 bars. This is known as a Upside Reversal Sellback. A rapid fallback following an upside reversal is a powerful bearish indicator, breaking the expectation of higher prices. The quicker price falls back from an upside reversal, the more meaningful it is. Such a swift fallback suggests that the market's weakness was underestimated, as upside reversals typically signal a short-term rally.
The Expectation Breakers indicator identifies these opportunities by first identifying new highs and lows within a defined lookback period. It then compares the true range (TR), average true range (ATR), and closing range to confirm the significance of these reversals. The use of TR and ATR ensures that the reversals are substantial enough to indicate a genuine shift in market sentiment, helping to identify when price action breaks expectations.
Give this indicator a BOOST and COMMENT your thoughts below!
We hope you enjoy.
Cheers!
Relative Volume Candles [QuantVue]In the words of Dan Zanger, "Trying to trade without using volume is like trying to drive a few hundred miles without putting gas in your tank. Trying to trade without chart patterns is like leaving without having an idea how to get there!"
Volume tends to show up at the beginning and the end of trends. As a general rule, when a stock goes up on low volume, it's seen as negative because it means buyers aren't committed. When a stock goes down on low volume, it means that not many people are trying to sell it, which is positive.
The Relative Volume Candles indicator is based on the Zanger Volume Ratio and designed to help identify key volume patterns effortlessly, with color coded candles and wicks.
The indicator is designed to be used on charts less than 1 Day and calculates the average volume for the user selected lookback period at the given time of day. From there a ratio of the current volume vs the average volume is used to determine the candle’s colors.
The candles wicks are color coded based on whether or not the volume ratio is rising or falling.
So when is it most important to have volume? When prices break out of a consolidation pattern like a bull flag or cup and handle pattern, volume plays a role. When a stock moves out of a range, volume shows how committed buyers are to that move.
Note in order to see this indicator you will need to change the visual order. This is done by selecting the the 3 dots next to the indicator name, scrolling down to visual order and selecting bring to front.
Indicator Features
🔹Selectable candle colors
🔹Selectable ratio levels
🔹Custom lookback period***
***TradingView has a maximum 5,000 bar lookback for most plans. If you are on a lower time frame chart and you select a lookback period larger than 5,000 bars the indicator will not show and you will need to select a shorter lookback period or move to a higher time frame chart.
Give this indicator a BOOST and COMMENT your thoughts!
We hope you enjoy.
Cheers!

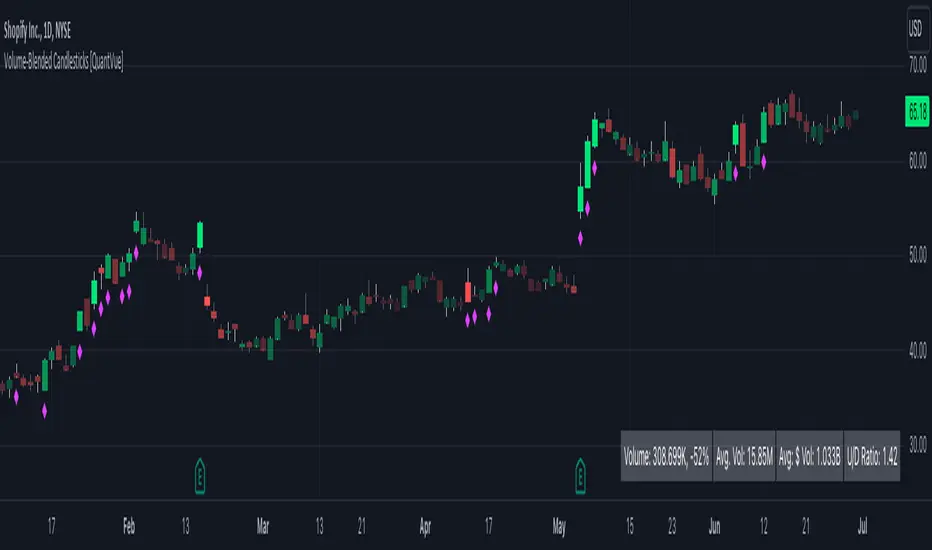
Volume-Blended Candlesticks [QuantVue]Introducing the Volume-Blended Candlestick Indicator, a powerful tool that seamlessly integrates volume information with candlesticks, providing you with a comprehensive view of market dynamics in a single glance.
The Volume-Blended Candlestick Indicator employs a unique approach of projecting volume totals by calculating the total volume traded per second and comparing it to the time left in the session as well as the historical average length selected by the user.
The indicator then dynamically adjusts the opacity of the candlestick colors based on the intensity of the projected volume. As volume intensifies, the candlestick colors become more pronounced, while low volume will cause colors to fade allowing you to visually perceive the level of buying or selling.
One of the standout features of the Volume-Blended Candlestick Indicator is its ability to identify pocket pivots. A pocket pivot is an up day with volume greater than any of the down days volume in the past 10 days. By highlighting these pocket pivots on your chart, the indicator helps you identify potential stealth accumulation.
In addition to blending volume with candlesticks and spotting pocket pivots, this versatile indicator provides you with an insightful table displaying key volume metrics. The table includes the average volume, average dollar volume, and the up-down volume ratio, allowing you to get a clear picture of buying and selling pressure.
Settings Include:
🔹Sensitivty Level: Normal, More, Less
🔹Volume MA Length
🔹Toggle Color based on previous close
🔹Show or hide volume info
🔹Chose candlestick colors
🔹Show or hide pocket pivots
🔹Show or hide volume info table
Don't hesitate to reach out with any questions or concerns.
We hope you enjoy!
Cheers.
Sup/Res Levels [QuantVue]Shows basic pivot point of support and resistance levels. Will show alerts for break of sup. or res. Allows for a volume filter for sup. res. breaks as well.
"B" means break of either a Sup. or Res. level with volume greater than the threshold.
"Bull/Bear Wick" means bullish/bearish candle on break.
Left - number of bars left hand side of the pivot .
Right - number of bars right hand side of the pivot .
Volume Thres. - the threshold value (%) for the Volume.
This indicator is useful to filter our insignificant breaks of sup. or res. Can help trader determine when to sit on their hands, or enter a trade.
