Gap Tracker Indicator v5Gap Tracker Indicator - Description
Purpose: The Gap Tracker identifies price gaps on charts and visualizes unfilled gap zones that may act as future support/resistance levels.
What it shows:
Gap zones as colored rectangles:
Red boxes = bearish gaps (price gapped down, leaving unfilled space above)
Green boxes = bullish gaps (price gapped up, leaving unfilled space below)
How gaps form:
A gap occurs when the opening price of one candle is significantly different from the closing price of the previous candle
Common after weekends, holidays, or major news events when markets are closed
Gaps create "empty" price zones with no trading activity
Trading significance:
Many traders believe gaps tend to "fill" eventually (price returns to the gap zone)
Unfilled gaps can act as magnetic levels - price often revisits them
Gap zones may provide support (bullish gaps) or resistance (bearish gaps)
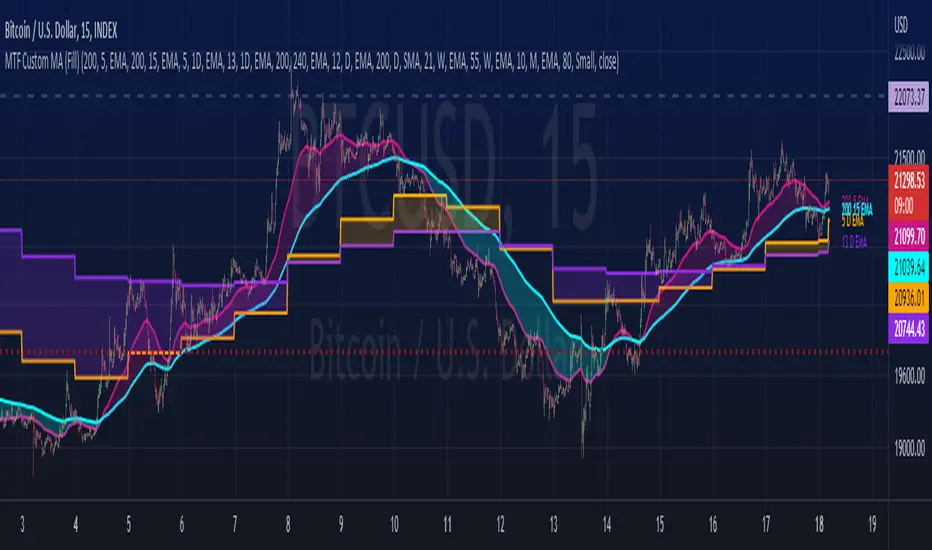
On your chart:
Multiple red boxes show unfilled bearish gaps where price gapped down
Green boxes show unfilled bullish gaps where price gapped up
The indicator tracks these zones until price fills them completely
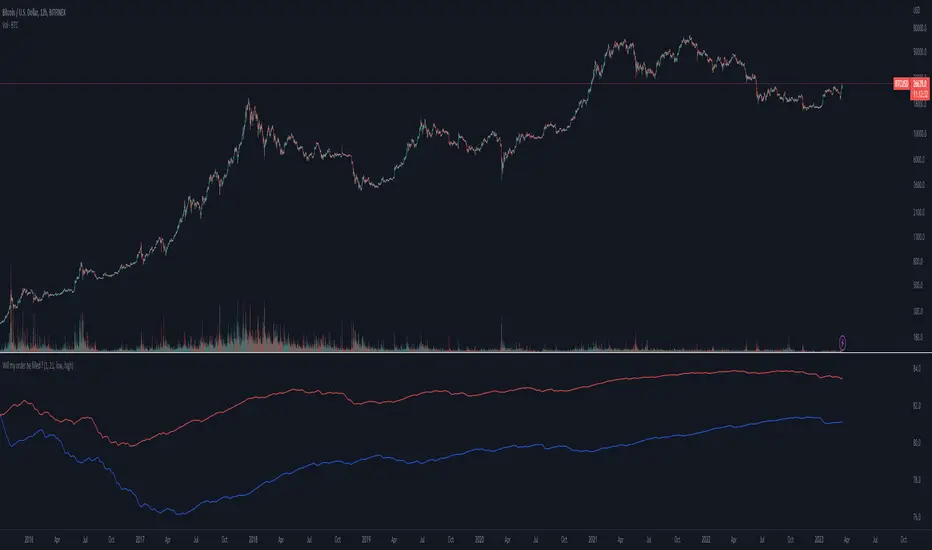
Right side shows "GAP TRACKER" panel with active gaps: Aktywne (2), Zamknięte (9), Zakres 7d (168)
Key insight: The concentration of unfilled gaps suggests potential magnetic zones where price may return for "gap fill" trades. Traders often use these levels for entries, exits, or stop placement.
Pine Script® 인디케이터