EMA Distance & Sector InfoThis indicator provides insights into price trends relative to Exponential Moving Averages (EMAs) and displays sector/industry information about the asset. Below is a detailed explanation of its purpose and what it is designed to achieve:
Purpose of the Code
The indicator offers two key functionalities:
1. Analyzing Price Distance from Multiple EMAs:
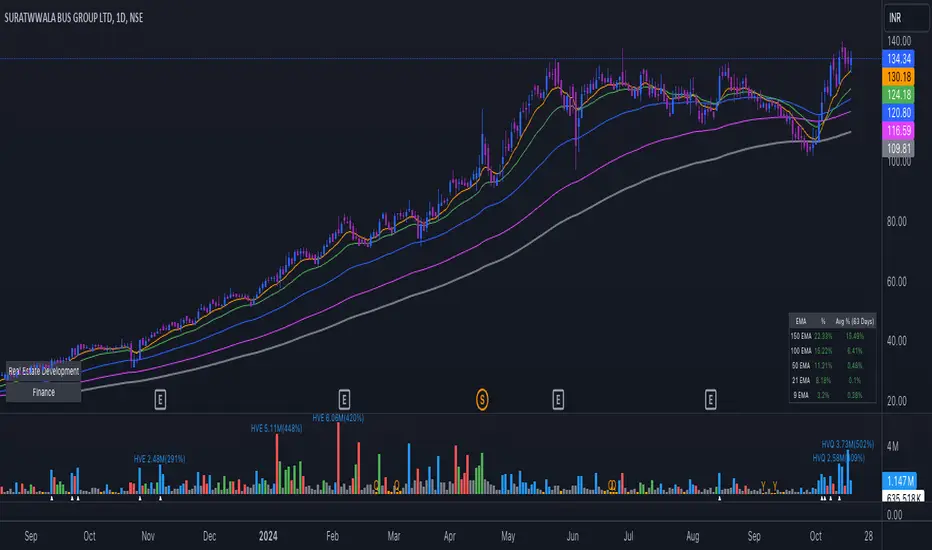
• Helps traders understand how far the current price is from key EMAs, expressed as a percentage.
• Calculates average percentage distances over a specified period (default: 63 days) to spot consistent trends or mean reversion opportunities.
• Useful for trend-following strategies, allowing the trader to see when the price is above or below important EMAs (e.g., 9, 21, 50, 100, and 150-period EMAs).
2. Displaying Asset Sector and Industry Information:
• Displays the sector and industry of the asset being analyzed (e.g., Technology, Consumer Goods).
• Provides additional context when evaluating performance across a specific sector or comparing an asset to its peers.
Who Would Use This Indicator?
This indicator is particularly helpful for:
1. Swing Traders and Positional Traders:
• They can use it to track whether the price is trading significantly above or below critical EMAs, which often signals overbought/oversold conditions or trend strength.
• The average percentage distances help to identify momentum shifts or pullback opportunities.
2. Sector/Industry-Focused Investors:
• Understanding an asset’s sector and industry helps investors gauge how the asset fits into the broader market context.
• This is valuable for sector rotation strategies, where investors shift funds between sectors based on performance trends.
How It Helps in Trading Decisions
1. Entry and Exit Points:
• If the price is far above an EMA (e.g., 21 EMA), it might indicate an overbought condition or a strong trend, while a negative percentage could signal a pullback or reversal opportunity.
• The average percentage distances smooth the fluctuations and reveal longer-term trends.
2. Contextual Information:
• Knowing the sector and industry is useful when analyzing trends. For example, if Technology stocks are doing well, and this asset belongs to that sector, it could indicate sector-wide momentum.
Summary of the Indicator’s Purpose
This code provides:
• EMA trend monitoring: Visualizes the price position relative to multiple EMAs and averages those distances for smoother insights.
• Sector and industry information: Adds valuable context for asset performance analysis.
• Decision-making support: Helps traders identify overbought/oversold levels and assess the asset within the broader market landscape.
In essence, this indicator is a multi-purpose tool that combines technical analysis (through EMA distances) with fundamental context (via sector/industry info), making it valuable for traders and investors aiming to time entries/exits or understand market behavior better.
Pine Script® 인디케이터