Full strategy AllinOne with risk management MACD RSI PSAR ATR MAHey, I am glad to present you one of the strategies where I put a lot of time in it.
This strategy can be adapted to all type of timecharts like scalping, daytrading or swing.
The context is the next one :
First we have the ATR to calculate our TP/SL points. At the same time we have another rule once we enter(we enter based on % risk from total equity, in this example 1%, at the same time, lowest ammount for this example is 0.1 lots, but can be modified to 0.01), so we can exit both by tp/sl points, or by losing 1% of our equity or winning 1% of our total equity. It's dinamic.
The strategy is made from
Trend direction :
PSAR
First confirmation point :
Crossover between 10EMA and Bollinger bands middle point
Second confirmation
MACD histogram
Third confirmation
RSI overbought/oversold levels
For entries : we check trend with psar, then once ema cross bb middle point, we confirm together with rsi level for overbought/oversold and macd histogram ( > 0 or <0).
We exit, when we have opposite sign, like from buy to sell or sell to buy, or when we reach tp/sl points, or when we reach % basaed equity points.
It can be changed to be fixed lots, or fixed tp/sl , you just have to uncomment the size from entries, and tp/sl lines.
At the same time, it has the possibility if one desires, to trade only concrete forex session like european, asian and so on for intraday trading.
Hope you enjoy it.
Let me know how it goes.
지수 이동 평균 (EMA)

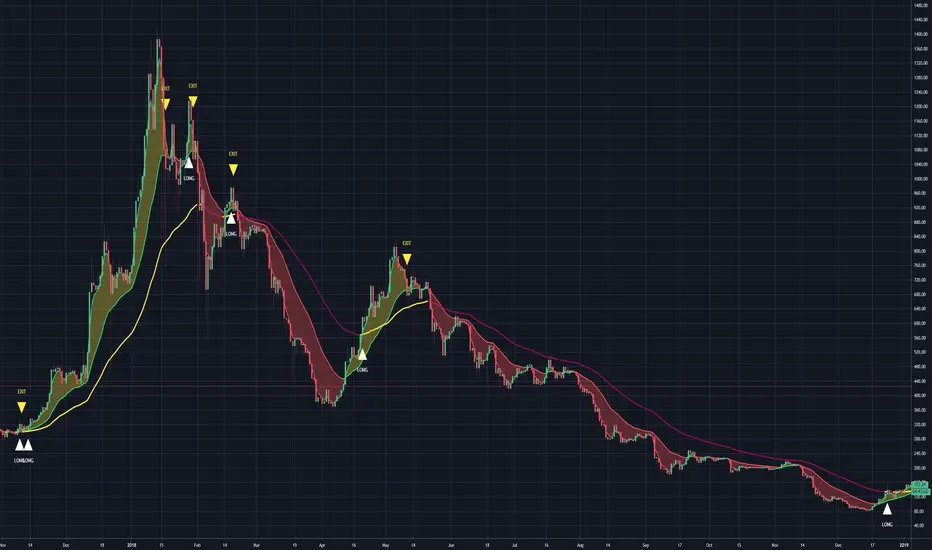
Arkaydeus Trend Strategy (by Arkaydeus) The Arkaydeus Trend Strategy uses a combination of a fast and slow EMA creating a trend ribbon but also introduces the following features:
A Big EMA to filter out buys which aren't following a higher level trend
A filter on only positive candles for entry
An entry only closing above a positive trending ribbon
A sideways noise threshold filter which is configurable to remove too many trades whilst ranging sideways
A toggled spike switch to exit trades on lows hitting threshold even if close doesn't
A % based trailing stop feature that is turned off by default
The indicator can be used as a trading strategy or you can switch trades off and just use the enter and exit points painted on the graph.
This strategy is designed for the larger Crypto assets ( BTC /ETH) and should be run on the daily time frame. It has been optimised for these and may not perform as well on other instruments.
It should not be used in heavily ranging markets which move sideways and is designed as a trend based long only strategy.
Mioone EMA XX v sEMA YYThe first EMA XX value (800) represents the basis of this graph. In addition, the current value of EMA YY (10) is subtracted and thus shows the trend of the coin.
Above zero = Bullish
Below zero = bearish
As a result, the graph shows us possible duration and transitions from bearish to bullish and vice versa
You can choose XX and YY in the configuration of the graph
Comment gladly to me if it works for you
greetings,
Mioone

RSPRO StrategyStrategy for RSPRO indicator
Based on resistance/support and bollinger band fluctuations this indicator also has filter with x bars after RSI overbought/oversell zones from settings.
There are two types of entries and signals: early (usually before trend changes) and main (when trend started to reverse)
Fits for BTC and any altcoins. And any assets. Good for both scalping and position trading (depends on timeframe that you use)
Best use it with big timeframes: 45 and 90min, 2 and 4 hours for position trading.
For scalping 5-30min timeframes are good too.
In Script settings you can specify:
1) RSI period, 14 by default.
2) Show early entries (squares), enabled by defaults.
3) Show main entries (triangles), enabled by defaults.
4) Enable/Disable filter to show main entries only after RSI overbought/oversell regions
Disabled by defaults and RSI is 67 for upper zone and 33 for lower zone.
You can also specify how many bars back before current bar this filter must do. It's 10 by default, you can vary it up to 90.
+With customisable start/end date, take profit and stop-loss.
This is invite only script. PM me if you want to test it.
Trading Technicals Strategy V1This strategy was developed in order to optimize 'bull' and 'bear' entry and exit signals based on a set of relatively basic but unique parameters, consisting of Exponential Moving Averages, candlestick formation, as well as data from the common RSI and MACD indicators.
Revisions should be expected as my goal with this strategy is to collect data by manipulating the existing entry and exit conditions in order to find the most successful results. I would like to optimize this strategy for a certain time period as well, as there are varying degrees of results between, say, the 5m chart and the 1h chart. I hope to revise this script when I have what I believe to be significantly improved results, and I would also consider the idea of publishing multiple strategies based on the code that works best for each time frame (V1 may work best for the 30m period, a future V2 may be best suited for the 45m period, etc.)
As of publishing this script, two significant points to note are:
1. There are no overnight holds - all positions are exited before market close
2. While you may see several instances in one day's time of the 'bull' signal rising, then returning to zero, a bullish position will not exit at zero, only - the position will remain active until a 'bear' position is signaled, at which point the 'bull' position will be closed and a 'bear' position will open. The same is true in the opposite scenario.
These points are of course subject to change throughout the optimization process. Lastly, my goal is not to look for the strategy that only yields the most profit, but the one that provides the most consistency in achieving those profits.

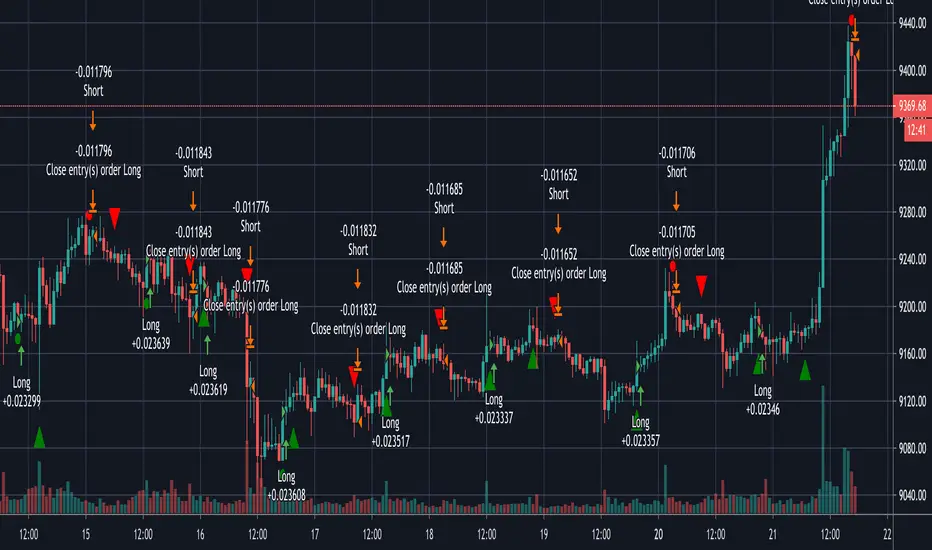
Strategy Smart Forex Buy Sell Signal by LukasHi, I just convert my Smart Forex Buy Sell Signal into strategy.
BUY and SELL signal base on Price action, RSI , and Correlation between Forex Major Pairs.
It's only work for Forex Major Pairs because I only took their data.
Included alert : Spec, Buy, Strong
Recommended to wait for double signal :
Spec Buy > Buy or Spec Sell > Sell
Buy > Strong Buy or Sell > Strong Sell
So execute after the second signal triggered.
On this strategy I exclude Spec Sell/Buy on strategy test.
I use simple Profit/Loss 200/100 and 5 pyramid, you can play around with the setting.
And to improve the odds, simply use my Currency Strength Indicator to pick what pairs to trade. Choose Strong Vs. Weakness to get maximal profit. It help me to stay away from ranging pairs.
Any feedback are welcome :)

Charl osci strategyTrade trend continuation and reversal on forex, stocks and commodities.
Strategy uses RSI, MFI and macd divergence along with EMA.
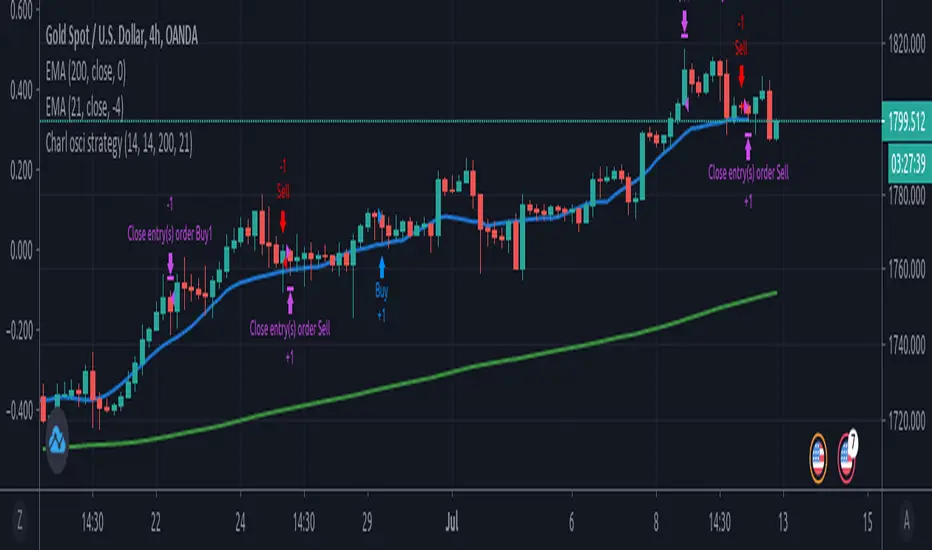
EMA Cross
Uses EMA crosses as a signal for entry.
Configurable first TP profit level
Stop moves up to entry after first TP
Option to use ROC and Price Gap as filters to entries
EMA Crossover StrategyEMA Crossover Strategy
This strategy will enter a long trade when the 21 EMA crosses over the 55 EMA and both EMAs and the close price are above the 200 EMA (long-term trend).
It will enter a short trade when the 21 EMA crosses under the 55 EMA and both EMAs and the close price are below the 200 EMA.
It will exit a long trade when the RSI crosses under from overbought and indicates that the uptrend could be coming to an end.
It will exit a short trade when the RSI crosses over from oversold and indicates that the downtrend could be coming to an end.
Backtesting shows that it works best on:
30 MIN:
SYMBOL - PROFIT FACTOR
AUDCAD - 1.126
EURJPY - 1.12
EURNZD - 1.04
EURUSD - 1.65
GBPAUD - 1.27
USDCAD - 1.08
1 HR:
SYMBOL - PROFIT FACTOR
CADJPY- 1.23
EURNZD- 1.166
GBPJPY- 1.23
GBPUSD- 1.282
NZDJPY- 1.246
USDCHF- 1.344
3 HR:
SYMBOL - PROFIT FACTOR
CADCHF- 1.975
EURGBP- 1.776
EURNZD- 1.911
GBPAUD- 1.364
GBPCHF- 1.311
USDJPY- 1.162
XAUUSD - 2.00
As always, this strategy does not guarantee you to achieve profits and you should always use confirmations before entering a trade.

Combination Parabolic MA/IIR/ALMA Strategy, and other goodies Okay, so this is a lot. It started mostly with me combining indicators and looking for ideal entry criteria.
It is also a collection of conditions, whether used or unused, for my current chosen "best" strategy. It is currently set how I like it, but it has changed with time, and will continue to do so. Within, there are variables that are unused, but offer some insight into the overall odds of a trade. They were, in fact, once used but fell out of favor. And all details for this strategy are within the comment header of the script.
As this evolves, I most certainly wont keep any future findings and hope for profit from my peers (yinz). Also, I'd like to give a sincere thanks to the people of TV for what I learned in a few month's time and their flexible membership plans. Basically, I'm just a mad scientist, but this monster's a masterpiece and folks here before me made many indirect contributions to it.
--------------------------
Okay guys, lastly and most importantly,
Each smack of the like button is a vote of your confidence in me, to my beautiful landladies, Celeste and Adele, that my rent will be caught up and that it won't always be a problem. Which, in my mind, makes me a graph. And they've got strong hands and don't sell the low. I more than respect that. Seriously. And I'm very grateful for their willingness to work with me, but the thing is that I didn't ask first; life just happens. But few are tolerant of others. And quite importantly, I truly believe that I will be successful one day, and that "thumbs-up" button is your vote of confidence. If you're not sure, then don't hit it yet. Maybe my scripts will boost your confidence in me :)
-------------------------
PS: And you know what? I'ma give a shout-out to Philakone for teaching me everything that I know about Elliot Wave . Absolutely. Two years ago, I would keep telling myself that one day I will put something in his gratuity wallet or pursue the paid courses. And, I still plan on it, because I'm grateful. And so also, to everybody else, I'm recommending him to learn from. because as a trader who might not know everything for free, you can certainly fill in the gaps with his altruistic offerings. And I'm betting that you will then feel more than inclined to buy the Udemy course.
"If wave 2 retraces a lot; number 4 will not". Repetition. Philakone didn't fix my memory but he sure did find a workaround, haha
Okay, everyone, Thanks!

Combination Parabolic MA/IIR/ALMA Strategy, with other goodiesOkay, so this is a lot. It started mostly with me combining indicators and looking for ideal entry criteria.
It is also a collection of conditions, whether used or unused, for my current chosen "best" strategy. It is currently set how I like it, but it has changed with time, and will continue to do so. Within, there are variables that are unused, but offer some insight into the overall odds of a trade. They were, in fact, once used but fell out of favor. And all details for this strategy are within the comment header of the script.
As this evolves, I most certainly wont keep any future findings and hope for profit from my peers (yinz). Also, I'd like to give a sincere thanks to the people of TV for what I learned in a few month's time and their flexible membership plans. Basically, I'm just a mad scientist, but this monster's a masterpiece and folks here before me made many indirect contributions to it.
--------------------------
Okay guys, lastly and most importantly,
Each smack of the like button is a vote of your confidence in me, to my beautiful landladies, Celeste and Adele, that my rent will be caught up and that it won't always be a problem. Which, in my mind, makes me a graph. And they've got strong hands and don't sell the low. I more than respect that. Seriously. And I'm very grateful for their willingness to work with me, but the thing is that I didn't ask first; life just happens. But few are tolerant of others. And quite importantly, I truly believe that I will be successful one day, and that "thumbs-up" button is your vote of confidence. If you're not sure, then don't hit it yet. Maybe my scripts will boost your confidence in me :)
-------------------------
PS: And you know what? I'ma give a shout-out to Philakone for teaching me everything that I know about Elliot Wave . Absolutely. Two years ago, I would keep telling myself that one day I will put something in his gratuity wallet or pursue the paid courses. And, I still plan on it, because I'm grateful. And so also, to everybody else, I'm recommending him to learn from. because as a trader who might not know everything for free, you can certainly fill in the gaps with his altruistic offerings. And I'm betting that you will then feel more than inclined to buy the Udemy course.
"If wave 2 retraces a lot; number 4 will not". Repetition. Philakone didn't fix my memory but he sure did find a workaround, haha
Okay, everyone, Thanks!

BB Keltner Squeeze StrategyShows all bollinger bands (solid lines) and keltner channels (dotted line) and will go long/short when a squeeze happens between bollinger bands and keltner channel and exit the positions once there is no more momentum

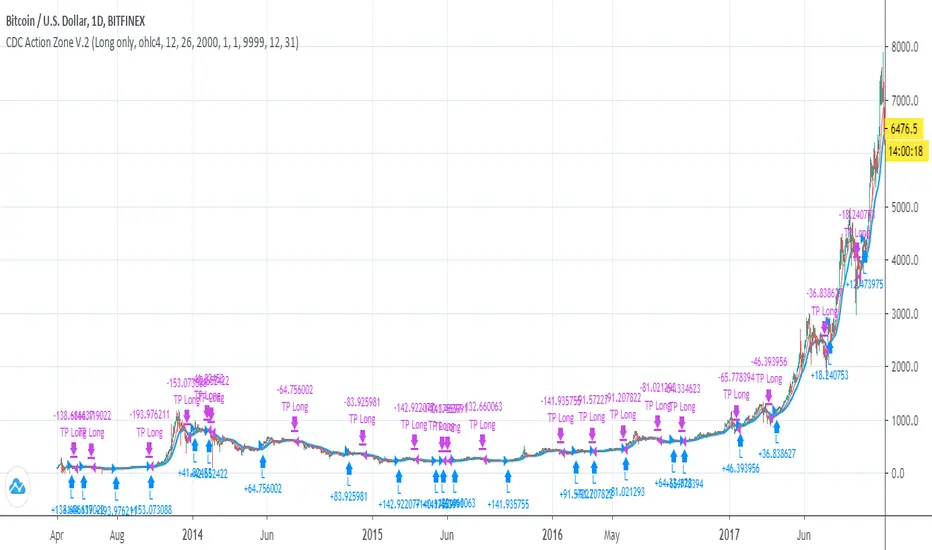
CDC Action Zone V.2 Strategy BacktestPublished for backtest purpose
All credit to : CDC Action Zone V.2 by piriya33
จัดทำขึ้นเพื่อการดูผล Backtest เขียวซื้อแดงขาย
ตัวสคริปท์มีการเพิ่ม
- Strategy Long/Short/Both // ปรับได้ใน Setting
- Back test range // ปรับได้ใน Setting
[Strategy] - EMA 10,20 59 with Profit DisplayedThis EA is still under construction !!
So for this EA is only based on the trend of the 3 EMA's
Buytrend = (ema1 and ema2 > ema3) and (ema1 and ema2 > ema3 )
We also change the Background depending on the trend.
bgcolor(Buytrend ? color.green : color.red,transp=70)
At this point I was wondering how much "profit" we would have made if this strategy was only based on the trend so I added the Labels to start/end close of that trend and then see how much profit in pip's we would have made.
Later I was wondering if I could get the total information on the trades and thats what the Label over the current candle is telling us. If that label is red we didn't made any profit and if its green we made som profit.
I also added a BuyProfit and a count buy/sells and a total Profit to see how that information clearly without opening the strategy tester.
NOTE this shows the profit in pip's
Next step is to implement a Buy/Sell Signal togheter with a Buy/SellSignalOUT signal.
Thats currently under development and you'll see some code being there already but as of now the orders are made from the trend signal not the Buy/Sell Signal.

McGinley Dynamic Indicator This is a strategy based on the Mcginley Dynamic Moving Average indicator, a type of moving average that was designed to track the market better than existing moving average indicators. It is a technical indicator that improves upon moving average lines by adjusting for shifts in market speed.
Moving averages used:
EMA: 21
EMA: 42
The chart used for the backtest was the Bovespa Futures Index ( WIN1! Continuous: current contract in front )

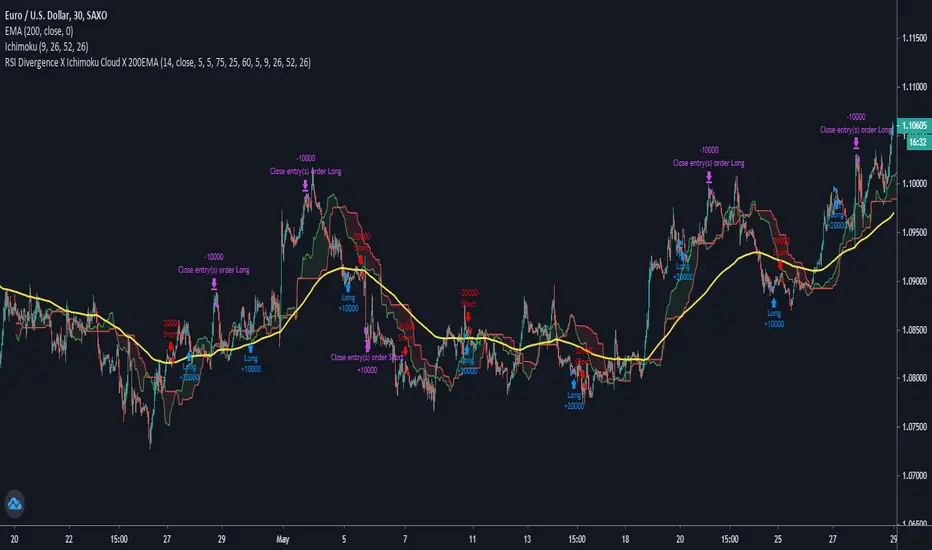
RSI Divergence X Ichimoku Cloud X 200EMAHi all,
This script is a combination of the RSI Divergence Strategy combined with Ichimoku Cloud and 200 EMA .
A long position is entered only when the RSI identifies a bullish divergence (either regular or hidden), and that the Ichimoku Cloud is above the 200 EMA . This is to ensure that there is a confirmation of a bullish trend before an entry.
Similarly, a short position is entered only when the RSI identified a bearish divergence (either regular or hidden), and that the Ichimoku Cloud is below the 200 EMA . This is to ensure that there is a confirmation of a bearish trend before an entry.
I find that this script works best on Intraday charts.
This is just a simple script I built on my third attempt of backtesting strategies on TradingView. Do give it a go and let me know if you guys have any feedback or comments about it. Happy trading!
MACD Bull Crossover and RSI Oversold 5 Candles Ago-Long StrategyHello everyone, I've been having a great time perfecting this strategy for a few weeks now. I finally feel like it's time to release it to the public and share what I have been working on.
This strategy only enters a long trade when the MACD crosses over the signal line and the RSI was oversold looking back 5 candles ago. The logic behind this is to wait for RSI to enter the oversold territory, and then when the market starts to recovery the MACD will crossover telling us the sell off is over.
This strategy will close once these 2 conditions are met.
1. MACD Histogram is above 0 and MACD crosses under the signal line.
2. RSI was overbought 5 previous candles ago.
In the strategies settings, you'll be able to enable visual stop-loss and profit levels and change those levels to what you like, enable up to 5 EMA'S,
ADDONS That Affect Strategy:
* Enable visual stop-loss and profit levels as soon as a buy signal is triggered.
* Modify stop-loss and profit levels.
* Modify RSI oversold and RSI overbought levels.
* Modify MACD Fast and Slow moving average.
ADDONS That Do Not Affect Strategy:
* Enable up to 5 EMA's. (This will not affect strategy, and is the only purpose is for people who like following EMA's.)
Thank you for taking the time to try my strategy. I hope you have the best success. I will be making a short strategy, and alerts for this strategy soon. Follow me for updates!

EMA(Rsi,length) Strategy onEMAのソースをRsi、期間をlenght(=デフォルトでは5)としたもの作成しました。
作成したものはデフォルトで黄色で表れております。
インジケーター上の緑色は、通常のRSIです
作成した際に参考にした足と通貨
5分足のUSDJPYとEURUSD
主にデイトレ目線で作っております。
デフォルト設定では
"EMAが75を上抜け、または25を下抜けた際に逆張りでエントリーをするもの"
として作成しております。
◎利確と損切りの幅ならびにインジケーター上の水平線は変更可能となっており、変更後はストラテジーテスターの各値も付随して自動変更します。
設定画面の各項目
RSI : 一般的なRSIの終値に対しての期間(デフォルトでは14)
Length : EMAでの期間をlengthとしております(デフォルトでは5)
up、downはインジケーター表示上のデフォルトでの75と25の水平線の位置
shortprofit,shortloss : ショートで入るとした場合の利確と損切りの長さ。(longprofit,longlossについても同様)
なおショートのポジションを持っている際にロングのポジションエントリーポイントに入った際は、持ってるショートのポジションは手仕舞いし、新たなロングのみポジションをもつようになっております。
免責事項ならびにお願い:上記の様に、各値、ならびにストラテジーテスターを設定しているつもりですが、プログラミングの入力ミスなどがある場合がございます。お知らせいただけますと幸いです。
また、投資をする際はご自身の責任と判断にて投資をなさるようお願いいたします。

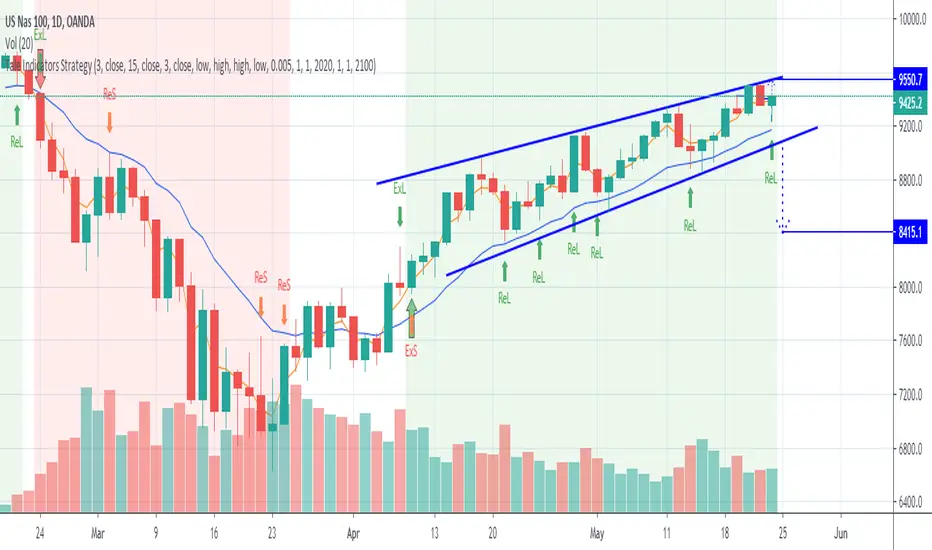
Tale Indicators StrategyThis script provides strategy from @JackBauer007 of the slowMA and fastMA crossovers to determine entry and exit conditions.
The default is set to 3EMA and 15EMA crossovers. With entry and exit for Long positions set to high and for Short positions set to low.
You can enable to run the strategy for a selected time-period to analyse the strategy on your instrument.
Credits to @ECHKAY and @JackBauer007 for their inputs and help
E.B. INVERSE CROSSING MOVING AVERAGE - RSIThis strategy uses the EMAs 10, 20 and 200.
When the EMA 10 is above EMA 100 and crossunder EMA 20, the strategy will buy the stock. The RSI must be under BuyLevel
When the EMA 10 is under EMA 100 and crossover EMA 20, the strategy will sell the stock. The RSI must be above SellLevel
When the RSI crossunder the BuyLevel, the Buy transaction will be closed.
When the RSI crossover the SellLevel, the Sell transaction will be closed.
If during a buy/sell transaction the EMA 10 crosses EMA 100, the transaction will be closed too.
You can adapt the EMA's value and RSI's value.
Just DM to me for access!!

E.B. INVERSE CROSSING MOVING AVERAGEThis strategy uses the EMAs 10, 20 and 200.
When the EMA 10 is above EMA 100 and crossunder EMA 20, the strategy will buy the stock.
When the EMA 10 is under EMA 100 and crossover EMA 20, the strategy will sell the stock.
If during a buy/sell transaction the EMA 10 crosses EMA 100, the transaction will be closed.
You can adapt the EMA's value.
Just DM to me for access!!

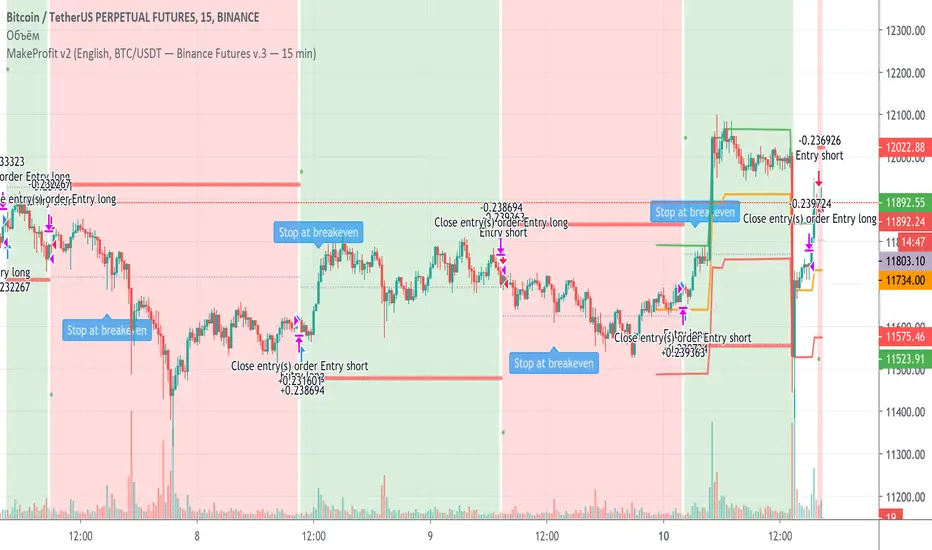
MakeProfit v2The Make Profit Club team has developed a new generation indicator that allows you to choose certain strategies calculated by us at a distance and simply enter a position based on our signals with our algorithms
Each partner who is trying to make money on the stock exchange shall from part of trust not only to us but to your head before you start earning.
We added the most popular strategies for Bitcoin and altcoins to the indicator, but we also didn't forget about currencies like EUR/USD and EUR/USD/RUB.
The indicator additionally works with scalpel levels, which you can buy back (as well as trade in the specified scalpel corridor).
Not only scalping strategies are included, but also trend trading. Let's say that the 45-minute strategy on bitcoin gave almost 700% of the profit for 45 weeks (1-4 hours and 1 day are also available).
For the most unintelligent, we have added entry levels, exit levels, levels where you can enter a trade if you do not have time for the signal, and many other features that you will not find anywhere else.
We will constantly add new strategies and improve our own.
You can get test access by contacting me.
Команда Make Profit Club разработала индикатор нового поколения, позволяющий выбрать определенные стратегии, просчитанные нами на дистанции и просто входить в позицию по нашим сигналам с нашими алгоритмами
Каждый партнер, который пытается заработать на бирже должен от части довериться не только нам, но и своей голове, прежде чем начать зарабатывать.
В индикатор мы добавили самые ходовые стратегии для Bitcoin и altcoins, но и не забыли про валюты по типу EUR/USD and EUR/USD/RUB.
Индикатор дополнительно работает со скальповыми уровнями, по которым вы сможете докупаться (а также торговать в указанном скальповом коридоре).
Включены не только скальповые стратегии, но и торговля по тренду. Допустим, стратегия по 45 минут на биткоине дала почти 700% прибыли за 45 недель (доступны еще и 1-4 часа, и 1 день).
Для самых несообразительных мы добавили уровни входа, уровни выхода, уровни, где можно зайти в сделку, если не успели по сигналу и еще очень много других функций, которых вы нигде не найдете.
Обратившись ко мне, вы можете получить тестовый доступ.
E.B. StrategyThis strategy use a custom indicator. When the green line cross above the level 6, it's going to sell the stock. When cross down -6, it's going to buy the stock. You can change the level's number to adapt it to any asset.
It works for US30, or any Dow's Futures . But you can adapt it to any market, FOREX/Crypto/Stocks.
Also it works better in 5/15 min chart, but you can adapt it to any resolution too.
We use EMA 100 and ADX 14 as a filter of the indicator.
EntryModel is the level to make Buy and Sell transactions.
ExitModel is the level to close transactions.
In TPandSL you can choose:
No -> if you want only buy and sell, without closing transactions.
Model -> you will use the ExitModel parameter to close transactions.
% -> if you want to use a percentage of TP and SL.
Volatility -> to adapt TP and SL with the volatility of the moment.
Pips -> if you want to use Pips to close transactions.
If you would like to have the access, just DM me!
