3xATR + EMA 260 + TP SL By NussaraStrategy backtest for 3X ATR + EMA 260
Exponential Moving Average
Moving averages smooth the price data to form a trend following indicator. They do not predict price direction, but rather define the current direction, though they lag due to being based on past prices. Despite this, moving averages help smooth price action and filter out the noise.
EMA=Price(t)×k+EMA(y)×(1−k)
where:
t=today
y=yesterday
N=number of days in EMA
k=2÷(N+1)
Average True Range
Average True Range ("ATR") was introduced by J. Welles Wilder in his 1978 book New Concepts In Technical Trading Systems. ATR is a measure of volatility for a stock or index
Calculation
ATR = (Previous ATR * (n - 1) + TR) / n
Where:
ATR = Average True Range
n = number of periods or bars
TR = True Range
The True Range for today is the greatest of the following:
Today's high minus today's low
The absolute value of today's high minus yesterday's close
The absolute value of today's low minus yesterday's close
3X ATR + EMA 260 Formula
1. ATR it indicates the market has a fluctuation. An indicator will check bar (High-Low) > 3 x ATR
2. EMA 260 identify the market uptrend or downtrend
- if condition (1) is true and the price closed above the EMA260 it’s an uptrend. An indicator will enter a long position.
- if condition (1) is true and the price closed below the EMA260 it’s a downtrend. An indicator will enter a short position.
Risk to Reward Ratio = 1:1.5
Stop loss = open price of entry position
This indicator is just a tool for technical analysis . It shouldn't be used as the only indication of trade because it causes you to lose your money. You should use other indicators to analyze together.
지수 이동 평균 (EMA)

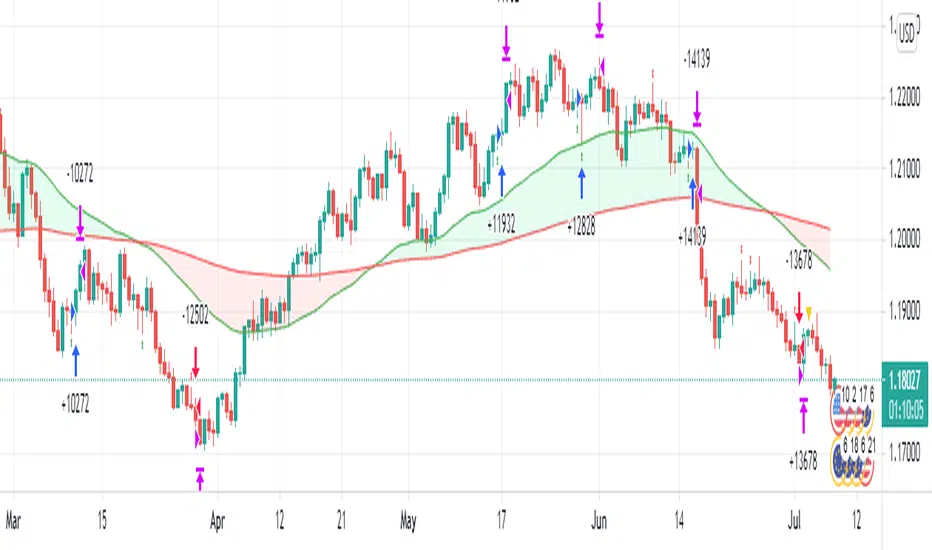
Vin's Playzone Strategy How it works
Playzone is a very simple system, utilizing just two exponential moving
averages. The 'Zones' in which different 'actions' should be taken is
highlighted with different colors on the chart. Calculations for the zones
are based on the relative position of price to the two EMA lines and the
relationship between the two EMAs
How to use
The basic method for using Playzone is to follow the green/red color.
Buy when bar closes in green.
Sell when bar closes in red.
Using it this way is safe but slow and is expected to have around 35-40%
accuracy, while yielding around 2-3 profit factors. The system works best
on larger time frames.
The more advanced method uses the zones to switch between different
trading system and biases, or in conjunction with other indicators.
example 1:
Buy when Yellow-Green and Bullish Divergence between price and RSI is visible,
if not Buy on Green and vise-versa
example 2:
Set up a long-biased grid and trade long only when actionzone is in green
change the bias to short when actionzone turns to te bearish side(red)
(Look at colors on a larger time frame)
"We let the market tell us what to do, Not to outguess what the market gonna do."

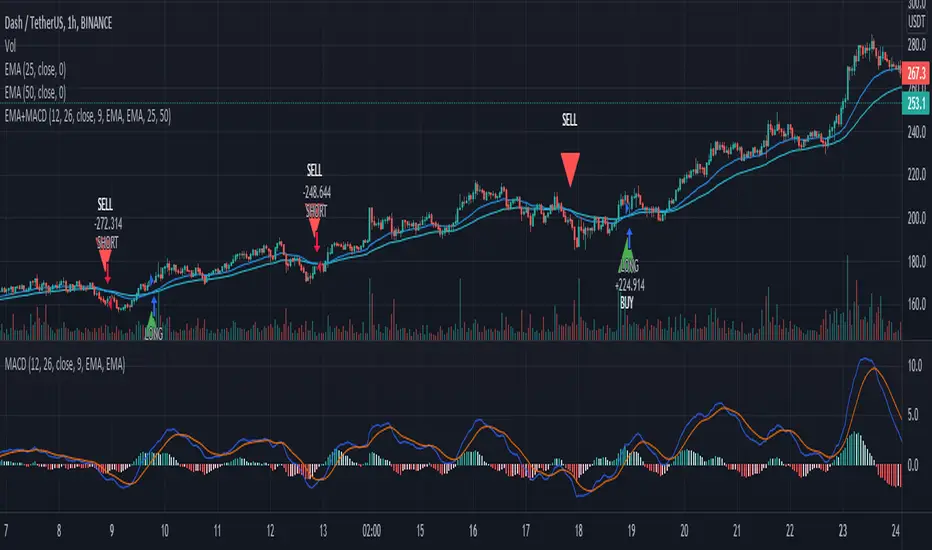
EMA+MACDA simple script using EMA 25 and EMA 50 with MACD. Enter long when EMA 25 crossover ema 50 and MACD line > 0, enter short when EMA 50 crossover ema 25 and MACD < 0
SSL Hybrid Exit Arrow StrategyBasic concept: Use the SSL Hybrid indicator's EXIT ARROWS to determine trade entry and exit points.
Rules:
Enter LONG trades on BLUE exit arrows
Enter SHORT trades on RED exit arrows
Uses up to 3 DCA orders for trade entry
Sets a stop loss
Does not set any take profit. Relies on opposing arrow to exit current position
When filters are set it affects opening of positions, but opposing arrow will always exit trades regardless of filtering options set
Additional filtering configuration:
If the SSL filter checkbox is checked, then LONG positions can only be opened when SSL1 is below the baseline lower and SHORT positions can only be opened when the SSL1 is above the baseline upper
If the QQE MOD checkbox is checked, then LONG positions can only be opened when QQE MOD histogram bars are BLUE and the QQE MOD line is ABOVE 0 and SHORT positions can only be opened when the QQE MOD histogram bars are RED and the QQE MOD line is BELOW 0
Both SSL and QQE MOD filters may be combined to give stricter filtering, however I find it often prevents entry to too many good trades

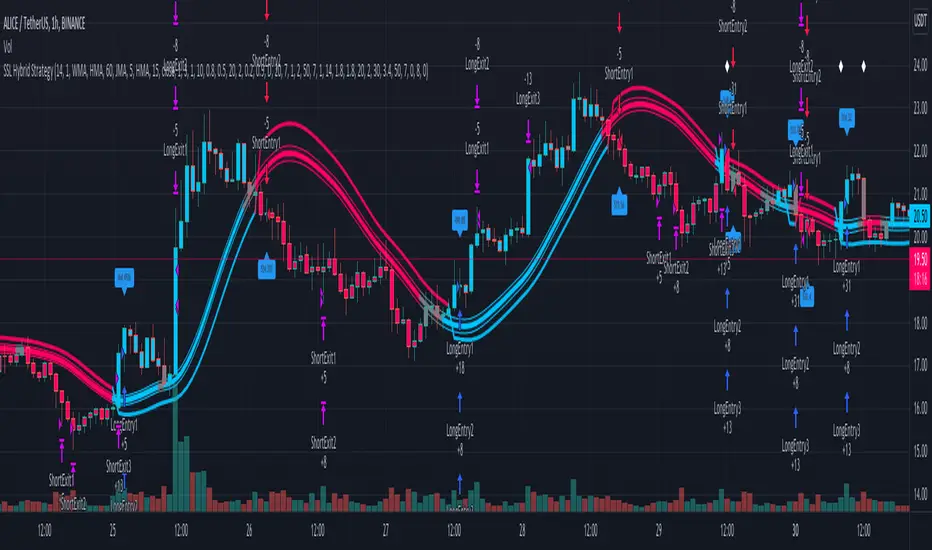
SSL Hybrid StrategyStrategy based on the SSL Hybrid indicator by Mihkel00
Designed for the purpose of back testing
Strategy:
Enters both long and short trades based on SSL1 crossing the baseline
Stop Loss calculated based on ATR multiplier
Option to allow moving of Stop Loss to break even on TP1
Option to turn off Stop Loss and Take Profit which will rely on indicator flip to exit from position
Take Profits configurable with up to 5 ATR multipliers and exits percentages (percentages calculated as percentages of original position size, eg. 100 tokens with 3 TPs of 20, 30, 50 would exit the same number of tokens on each TP)
Credits:
SSL Hybrid Mihkel00 www.tradingview.com
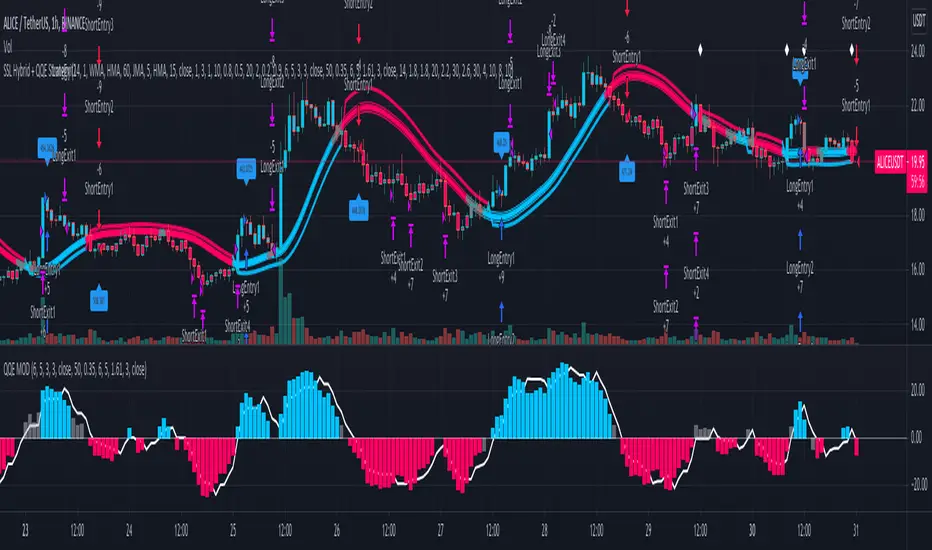
SSL Hybrid + QQE StrategySSL Hybrid strategy combining QQE MOD as trade entry filter.
Rules to enter LONG:
SSL1 is under lower baseline lower
QQE histogram bar is blue
QQE line is above 0
Rules to enter SHORT:
SSL1 is under above baseline upper
QQE histogram bar is red
QQE line is below 0
Long only EMA CROSS 8/50/200 BacktestImprove EMA CROSS 8/50/200 with adjustable Exit EMA Level, and can open trade only when above EMA200

Crypto Scalper Divergence Macd Psar Ema 200This is a very efficient crypto scalper adapted to very short timeframes, however it can be optimized for other timeframes and assests as well.
Its components are
MACD
P SAR
EMA 200
Risk management
Rules for entry:
For short : we have an uptrend on PSAR , histogram is positive (divergence MACD) and close of a candle is below EMA 200
For long : we dont have an uptrend on PSAR, histogram is negative(divergence MACD) and close of a candle is above EMA 200
Rules for exit:
We exit when we either find a reverse condition than the entry one, or based on stop loss/take profit that are calculated on % movements of the price.
If you have any questions, let me know !

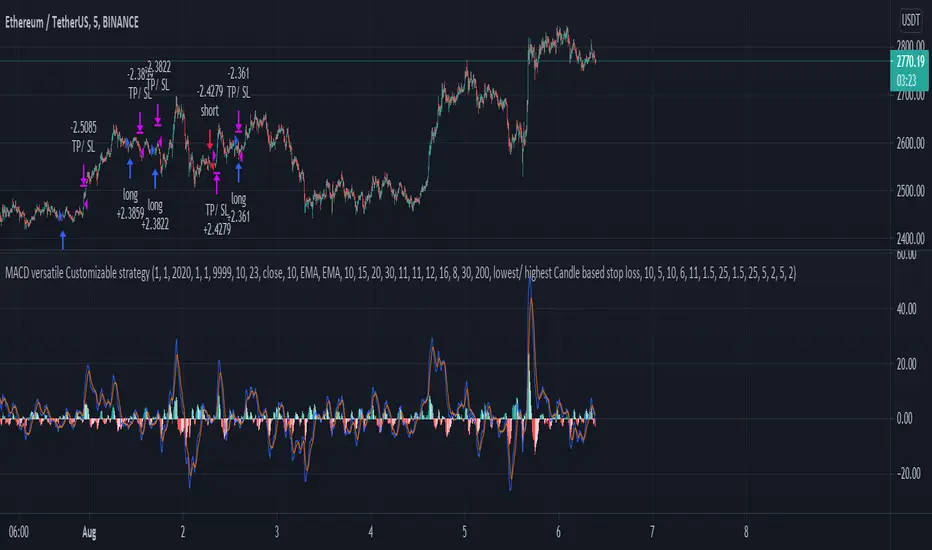
MACD, EMA, Know sure thing, Chopy Market StrategyHey there :)
This is the free version of the script. The following indicators / settings are missing:
- Support and resistance zones
- dynamic textboxes for alarms when using bots (3 Commas, Alertatron, etc.)
- a table showing the current position, indicators and other important information
With this script there is the possibility to completely customize the MACD . Starting with the MACD and signal line, the histogram and the color of the histogram.
Since the Pinecoders team has previously deleted the script, I will mention the fee settings in a bit more detail:
In this script a fee of 0.01% and a slipage of 15 was used. With each trade the total capital (100%) is used with a risk reward of 1 to 1.5.
The total capital, i.e. the risk, can be changed at any time under the "Settings" tab at "Equity".
I also added an EMA , the Know sure thing indicator and the Chopy Market indicator (by TradingRush) to the script to filter out bad trades.
The EMA:
Since the EMA is very reliable and shows whether there is an upward or downward trend, it should be used with the indicators in any case. It prevents long trades in downward movements and vice versa.
The KST Indicator:
The KST indicator has a similar movement as the MACD , but is by and large a bit more time delayed. It filters out false swings of the MACD and thus prevents bad trades.
The Chopy Market Indicator by Tradingrush:
The Chopy Market indicator, which was introduced by TradingRush in one of its videos, has the ability to detect sideways markets and block zones below this line for trades by means of a fixed value (the line).
To exit the trades, I added the following options:
ATR Exits. Exits based on past candles (lowest low, highest high).
Static exits based on set percentages.
In the next days I will create a tutorial for the script, just have a look on my profile.
If you have any questions about the script, let me know.

MACD, EMA, Know sure thing, Chopy Market - high adaptabilityHey there :)
This is the free version of the script. The following indicators / settings are missing:
- Support and resistance zones
- dynamic textboxes for alarms when using bots (3 Commas, Alertatron, etc.)
- a table showing the current position, indicators and other important information
With this script there is the possibility to completely customize the MACD . Starting with the MACD and signal line, the histogram and the color of the histogram.
Since the Pinecoders team has previously deleted the script, I will mention the fee settings in a bit more detail:
In this script a fee of 0.01% and a slipage of 15 was used. With each trade the total capital (100%) is used with a risk reward of 1 to 1.5.
The total capital, i.e. the risk, can be changed at any time under the "Settings" tab at "Equity".
I also added an EMA , the Know sure thing indicator and the Chopy Market indicator (by TradingRush) to the script to filter out bad trades.
The EMA:
Since the EMA is very reliable and shows whether there is an upward or downward trend, it should be used with the indicators in any case. It prevents long trades in downward movements and vice versa.
The KST Indicator:
The KST indicator has a similar movement as the MACD, but is by and large a bit more time delayed. It filters out false swings of the MACD and thus prevents bad trades.
The Chopy Market Indicator by Tradingrush:
The Chopy Market indicator, which was introduced by TradingRush in one of its videos, has the ability to detect sideways markets and block zones below this line for trades by means of a fixed value (the line).
To exit the trades, I added the following options:
ATR Exits. Exits based on past candles (lowest low, highest high).
Static exits based on set percentages.
In the next days I will create a tutorial for the script, just have a look on my profile.
If you have any questions about the script, let me know.
BTC Sentiment analysis RSI 2xEMAThis is a CRYPTO correlation strategy, which is using BTC sentiment with BITFINEX long and short ratios.
WIth them we are making from one side 2 RSI, one for long and another for short. And from another side, we are going to make multiple EMA's, using the ratios for long and short.
Rules for entry
For this scenario I created a long only strategy.
The long entry condition is : we have a crossover of the rsi long ratio with rsi short ratio and long ratio from BITFINEX is above the long EMA and short ratio from BITFINEX is below short EMA.
We exit when we get the opposite condition, in this case we have a crossunder of the rsi long ratio with rsi short ratio and long ratio from BITFINEX is below the long EMA and short ratio from BITFINEX is above short EMA.
If you have any questions, let me know !

RSI Hidden Divergence + Stochastic + 200 EMA @DaviddTechHey Traders,
This is my first strategy of many I hope. Inspired by a strategy I found on YouTube I wanted to see if it would work with a BOT strategy.
The idea is :
## LONG ##
* When the price is above 200 EMA take only LONG positions.
* Look for Bullish hidden divergence.
* Stochastic crossover to find our entry.
## SHORTS ##
* When the price is below 200 EMA take only SHORTpositions.
* Look for Bearish hidden divergence.
* Stochastic crossunder to find our entry.
You can used a fixed percentage, ATR, HH/LL or a FIB level to take profit.
Everything is very visual and can be connected easily to a bot.
I will be doing a video on HOW-TO setup in a couple of days.
## MUTLI LEVEL PROFITS ##
This will show you on backtest is you take profits at 3 levels however I have not tested on a BOT strategy.
NOTE : This is for educational purposes and please test on a paper account, as I said this is my first strategy.
I will be working and back testing new strategies every week.
- Made with ♥ @DaviddTech

EMA StrategyThis is a simple EMA cross strategy. This script was published by CaptJava. I added in the ability to check off a box and allow shorting, the ability to select a back testing date range and also the ability to enter the buy message and sell message in the properties. You then create the webhook alert and put only this in the message:
{{strategy.order.alert_message}}
That will pull in your alert message dynamically.
I may add more features to this over time.

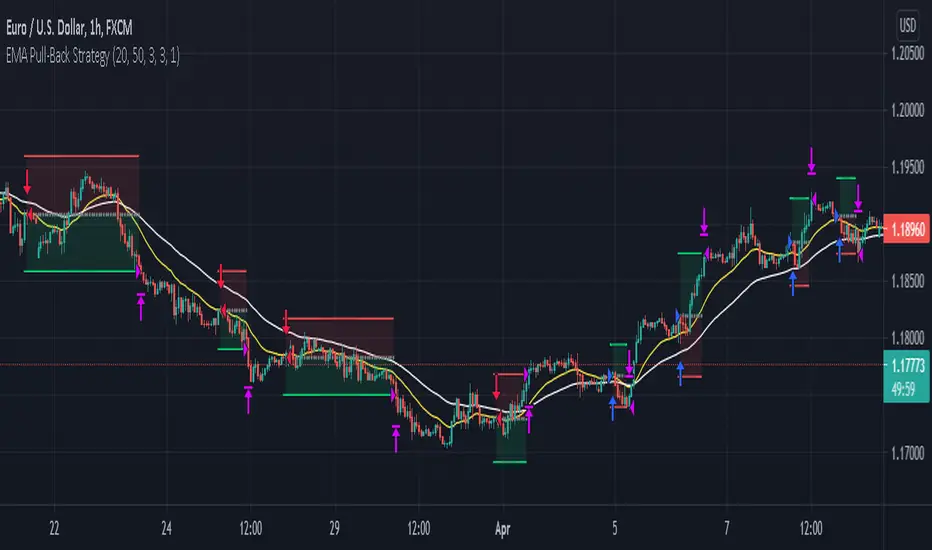
EMA Bounce StrategySimple strategy that checks for price bounces over an Exponential Moving Average. If the CLOSE of the candle bounces
back from having it's LOW below the EMA then it's a Bull Bounce. If the CLOSE of the candle bounces down from having it's
high above the EMA then it's a Bear Bounce. This logic can be reversed.

GMMAs v2.0 CRYPTO [badshah_e_alam]Hello Traders ,
The GMMAs v2.0 CRYPTO strategy stands for gap modified moving averages designed for cryptos. This is a non Repainting Indicator.
This strategy version is a advanced and modified to one of my previously published indicator named as "gap modified moving average".
I am using my Modified Moving Average indicator for a while. I always wanted to add some more information to moving
averages and made some modification to Moving averages.
The additional Information I have added to the Moving Average helps it to act more quickly based on the price of that
particular asset.
How is strategy gives signals?
when the GMMA'w cross over or cross under the GMMA'y than a trade is taken depending on the filter status.
Info about the settings :
The default setting is for 11m ETHUSD , it works with other cryptos and other timeframe as well . For other timeframes it need to be fine tuned and need little change.
The first category is for the selection of Moving average to be modified and the source to be used for that moving average .
I have added seven moving averages to choose between. SMA works good for me , you can choose and play with other MAs.
following are the option to choose MAs
1.EMA
2.SMA
3.HMA
4.RMA
5.WMA
6.VWMA
7.SWMA
Next option in setting is GMMA'y and GMMA'w :
these two settings define the length and lookback period of the MA you have choosed above.
The length is similar to the length of the moving average chosen to be modified.
The lookback option will look for that number of bars for the modification.
GMMA'w is more sensitive than the GMMA'y. So make sure that the setting input of the GMMA'y is significantly larger than the
GMMA'w.
FILTER:
I have added TradingView inbuilt SUPERTREND as a filter in the strategy, it works very good in filtering out false trades
you can enable/disable it in the settings.
EXIT strategy:
The exit Strategy is based on ATR, Take profit and SL are decided by the ATR in the SL/TP setting option. You can change the RR ratio in the setting.
The backtest settings are as follow:
Initial capital:10k
Initial Commission = 0.000
Initial Pyramiding = 0
Reference :
Thanks to pinecoders and Tradingview community.
my previous gap modified moving average version is :https://in.tradingview.com/script/e3WestBa-Gap-Modified-Moving-Average/
watermark added from:
color gradient framework picked from :https://in.tradingview.com/script/hqH4YIFa-Color-Gradient-Framework-PineCoders/
DISCLAIMER
Any and all liability for risks resulting from investment transactions or other asset dispositions carried out by the user based on information received or a market analysis is expressly excluded by me.
All the information made available here is generally provided to serve as an example only, without obligation and without specific recommendations for action. It does not constitute and cannot replace investment advice. We therefore recommend that you contact your personal financial advisor before carrying out specific transactions and investments.
Do your own research and Risk management before taking any trade.

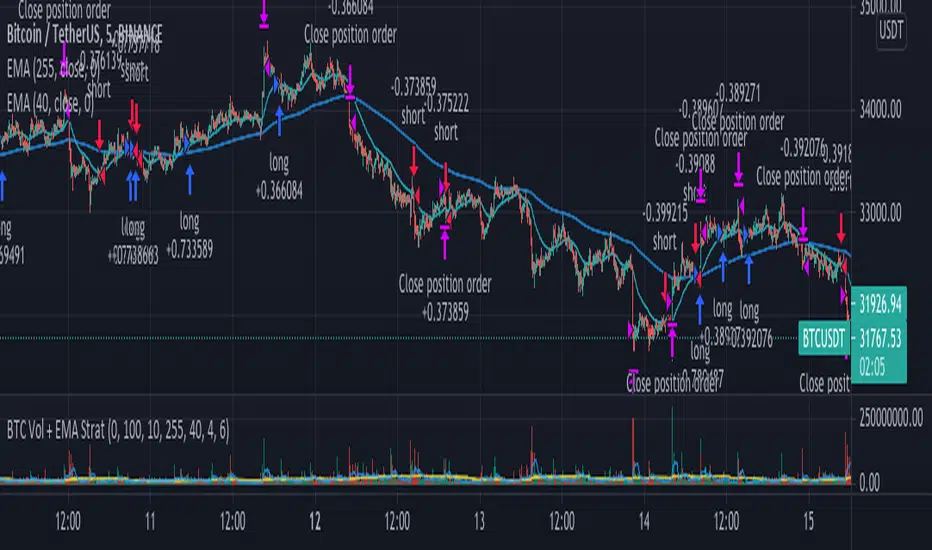
Aggregate BTC Volume + EMA Strat// This strategy buys when the price crosses the Fast EMA. It can go long only
// when the price is above the slow EMA and short when is below. The exit
// is determined by volume spikes, when the volume is greater than the Volume
// MA multiplied by the assigned input multiplier. Thanks to MartinShkreli
// for the Aggregated BTC volume. There is also a Maximum Loss filter which
// should be modified depending on the traded market.
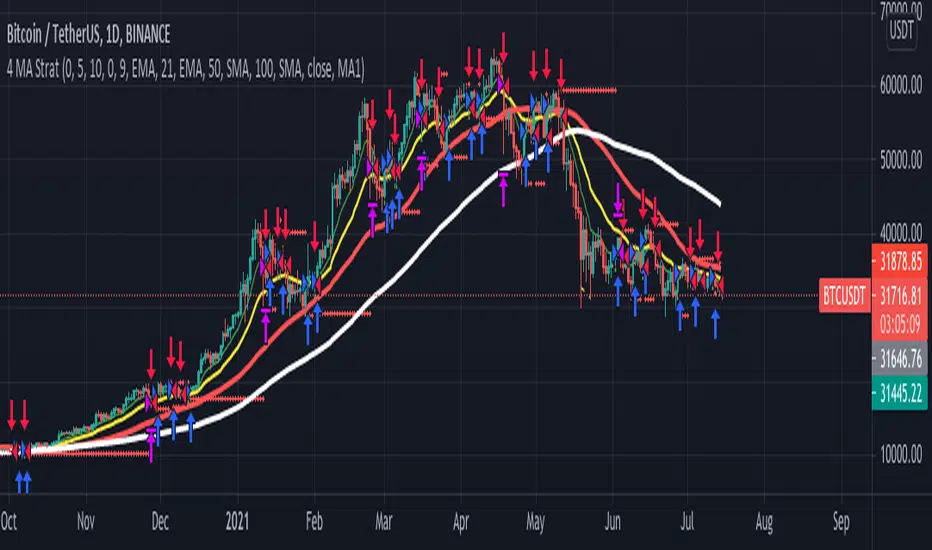
4 MA Strategy + Position Management// This is a simple crossover Moving Average strategy, good for long term crypto trades.
// It buys when the MA "X" crosses up the MA "Y", viceversa for shorts.
// Both MAs are selectable from the Inputs section in the front panel.
// There is also a Position Management option thats
// sizes positions to have the same USD risk (using leverage) on each trade,
// based on the percentage distance to the stop loss level.
// If you turn this option on you will see how the profit
// grows exponentially while the drawdown percentage almost remains the same.
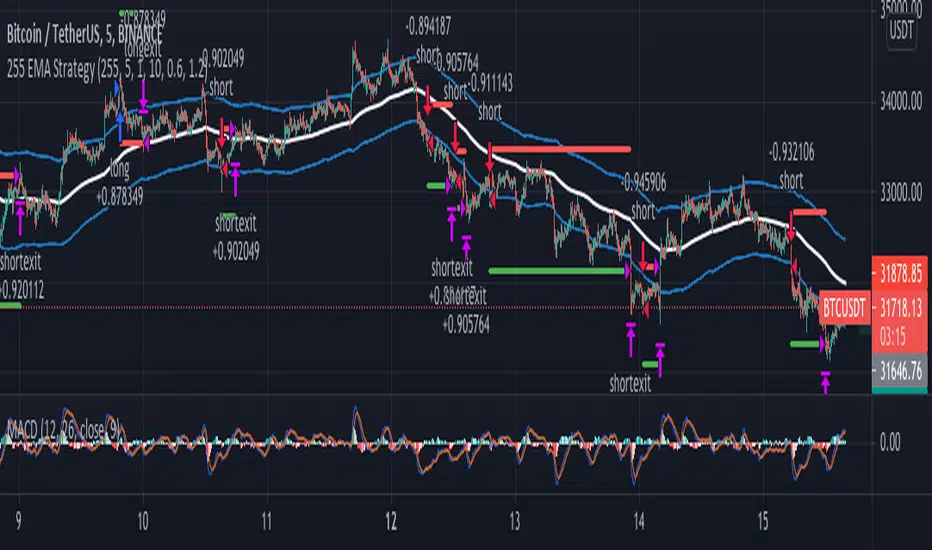
255 EMA Strategy//--- From 15 Trading Examples by Trader Alyx ---
// Seems like this strategy works better if we reverse the EMA filter logic.
// "Description: This basic scalping strategy allows you to enter the market based upon sentiment
// provided by the EMA, set at 255 periods. When price is trading below the 255 EMA, you would
// look to enter a LONG BUY positions, and when price is trading above the 255 EMA, you would
// look to enter a SELL SHORT position. The MACD lagging indicator will show you clear signals for
// when to do this. When the MACD lines cross in a bullish manner and price is below the 255
// EMA, buy. When the MACD lines cross in a bearish manner and price is above the 255 EMA,
// sell.
// NOTE: Make sure that price is trading away from the 255EMA before entering a LONG or SHORT
// position. As you can see in the chart below, the clearest signs for trade entry were presented
// when price was trading AWAY from the 255EMA"
hammerCandle & starCandleIn this scrip we have combine Pinbar Candlesticks calculated using Fibonacci, the bullish hammer candlestick and bearish star candlestick with EMAs and ATR.
I have used 12 Hour time frame which works well EUR/USD, this script works well on higher time frames such as Daily, 12 hours etc.
I have used 1.5 times the ATR as the stop loss and 1 times the ATR as the take profit as these risk to reward ratio gives us the best results for the 12 hour time frame for EUR/USD. Past result are not a prove of performance of the future.
I have added 1 for slippage and 1 for commission.
This script contains AutoView syntax and is fully automated if you connect TradingView to AutoView and a broker, prefebly Oanda.
This script uses two exponential moving averages for trend detection and Average True Range , ATR for stop loss and take profit targets. All of these setting are adjustable.
We only trade with the trend if the 50 period exponential moving averages is above the 200 period exponential moving averages, if a hammer candle is formed for entry.
Likewise with sell trade if a star candle is formed for entry and if the 50 period exponential moving averages is below the 200 period exponential moving averages.
This script does not trail your stop loss as I have noticed it does not give me good results. Stop loss is a fix stop loss based on Average True Range and so is the profit target.
This script has risk management, it risk a certain percent of the inputted capital amount in the setting. See settings for more details.
Note: Due to auto risk management this script only works on Forex.
Green line is 50 period exponential moving averages and red line is the the 200 period exponential moving average . Blue line is stop loss for long trade and black line stop loss for short trade.
Please trade at your own risk, all the setting in the script are adjustable for you to test before trading.
Many Thanks,
Honet Trader
CCI & EMA strategy by TradeswithashishThis strategy is extremely useful for positional traders or traders using timeframe 15-minute of higher. It uses following combo of values:
VWAP, CCI, Volume and Moving average (simple and exponential)
Caution:
Avoid taking trade if candle size is greater than twice the average candle size. for that wait for the retracement to near trailing stoploss

RSI Cross [xaurr]This is simple but profitable rsi cross strategy, to find optimal values you can change rsi and ema periods.
Good Luck!

Scalp - 50/200 EMAWorks on any timeframe but was built originally for scalping. Uses 50EMA and 200EMA to define the trend and touch backs on to the 50 EMA for entry.
200 EMA - White Line
50 EMA - Yellow Line
ATR: Length 14 Smoothing RMA
1. Wait for 50ema to crossover 200 ema – Then wait for candle to touch 50 ema after the cross.
2. Entry: Green candle that closes above 50 ema without getting more than 3 candles closing below(BUY) or above (SELL) 50ema.
3. Stop loss: 2x ATR value below entry candle.
4. Take profit: 1.5x the risk.
Settings allow for # of Entries allowed per trend as well as EMA periods.
Opposite for Sell Entries (Stop Loss: 2x ATR value above entry candle)
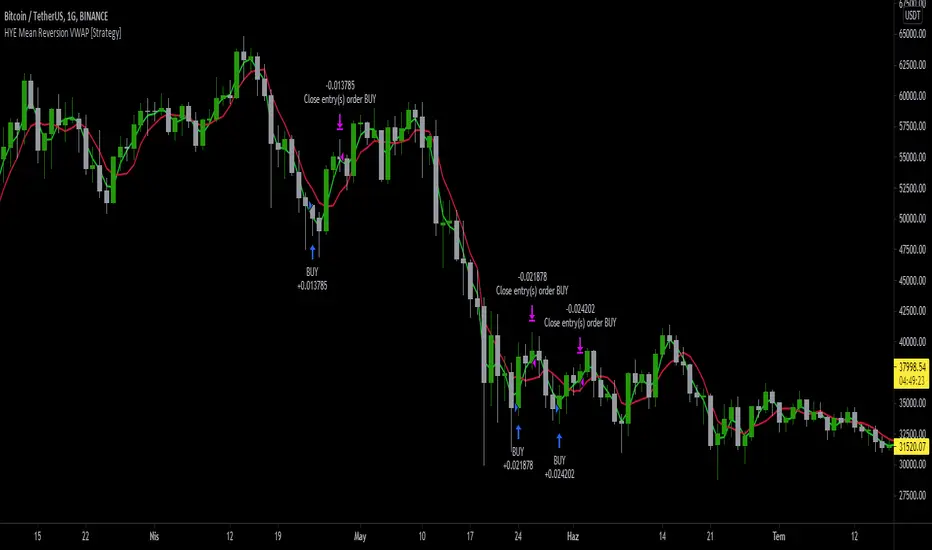
HYE Mean Reversion VWAP [Strategy]An RSI filtered version of PJ Sutherland's Jaws Mean Reversion algorithm using volume weighted average price (VWAP) instead of simple moving average (SMA).
"Long" on the close when;
1-) 2 period VWAP closes 3% or more below the 5 period VWAP ,
2-) 5 period exponential average of the 2 period RSI is below 30.
"Exit Long" on the close when;
1-) 2 period VWAP closes above the 5 period VWAP.
"Short" on the close when;
1-) 2 period VWAP closes 3% or more above the 5 period VWAP ,
2-) 5 period exponential average of the 2 period RSI is above 70.
"Exit Short" on the close when;
1-) 2 period VWAP closes below the 5 period VWAP.
*** You can change the needed percentage for long and short trades, periods of VWAPs and RSI levels.
*** You can select the trend direction: "Long Only" , "Short Only" or "Both". Default is "Long Only".
I used the "VWAP with period" indicator code of @neolao. Special thanks to @neolao.
Indicator Link: