Dynamic Adaptive Moving Average [Alpha Extract]Dynamic Adaptive Moving Average (DAMA) 📊
The Dynamic Adaptive Moving Average (DAMA) indicator is an adaptive technical tool that automatically discovers the optimal moving average period based on forward-looking price behavior. Unlike traditional fixed-length moving averages, this indicator continuously evaluates multiple timeframes to identify which MA length most accurately predicts future price movement, creating a responsive trend line that adapts to changing market conditions.
🔶 CALCULATION
The indicator employs a dynamic optimization algorithm to select the most effective moving average:
• Period Testing: Evaluates MA lengths from 5 to 100 periods to find the optimal timeframe
• Predictive Error: Measures each MA's accuracy by comparing it to the actual price 5 bars in the future
• Trend Weighting: Incorporates Rate of Change (ROC) to give higher priority to trend-following capabilities
• Error Minimization: Selects the MA length with the lowest weighted predictive error
• Smoothing: Applies an exponential smoothing factor (0.2) to prevent erratic changes in the trend line
🔶 DETAILS
Visual Features:
• Adaptive Trend Line: A yellow line representing the smoothed optimal moving average that dynamically adjusts its period
• Color-Coded Fills: Green areas when price is above the optimal MA (bullish), red when price is below (bearish)
• Opacity Gradient: Fill transparency provides visual context for the relationship between price and the trend line
• Real-Time Optimization Display: A table in the top-right corner shows the current optimal MA length
Interpretation:
• Bullish Signal: Price above the yellow DAMA line with green fill indicates upward momentum
• Bearish Signal: Price below the yellow DAMA line with red fill suggests downward pressure
• Trend Changes: Watch for crossovers between price and the DAMA for potential trend shifts
• Optimal Length Changes: Shorter optimal lengths may indicate trending markets, while longer lengths often appear in ranging conditions
🔶 EXAMPLES
The indicator demonstrates:
• Trend Identification: The DAMA hugs price more closely during trends while maintaining enough distance to filter noise
• Dynamic Adaptation: The MA length automatically adjusts shorter during strong trends and longer during consolidations
• Forward-Looking: By optimizing based on future price projection (5 bars), the indicator anticipates price movements better than traditional MAs
• Smooth Transitions: The smoothing algorithm prevents whipsaws while still allowing the MA to adapt to changing conditions
🔶 SETTINGS
Customization Options:
• Min/Max Length: Define the range of MA periods to test (default: 5-100)
• Step Size: Set the increment for testing different MA lengths (default: 1)
• Lookahead: Adjust the number of bars to project ahead for optimization (default: 5)
• Smoothing Factor: Control how quickly the MA adapts to new optimal lengths (default: 0.2)
The Dynamic Adaptive Moving Average (DAMA) indicator offers traders a sophisticated yet intuitive trend-following tool that eliminates the need to manually select MA periods.
Its self-optimizing algorithm continuously identifies the most effective moving average length based on actual price prediction accuracy, making it valuable for various trading strategies across different market environments and timeframes.
Dynamicma

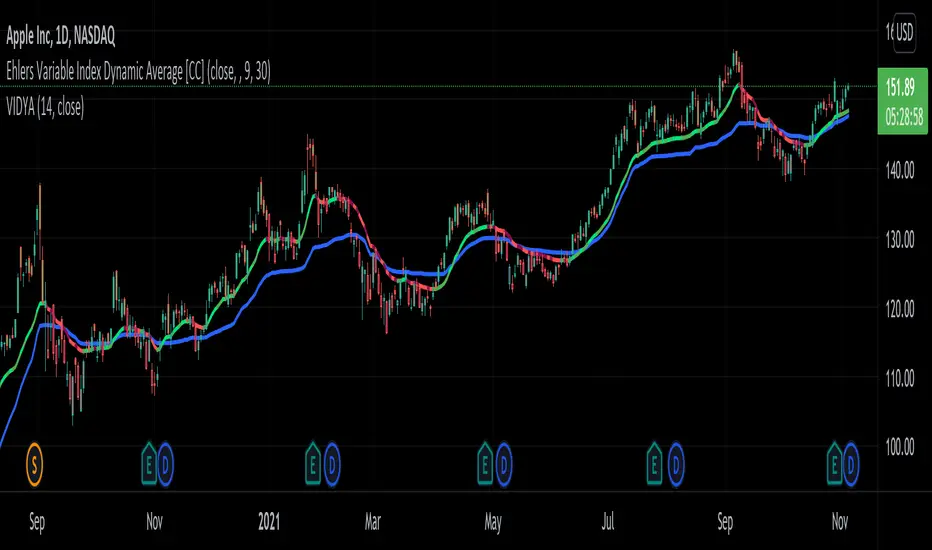
Ehlers Variable Index Dynamic Average [CC]The Variable Index Dynamic Average was created by Tushar Chande and this is a variation of that original formula created by John Ehlers. As you can see I have included the default Vidya from a script by @everget and as you can see the Ehlers version is able to follow the price much closer. I have included strong buy and sell signals in addition to normal ones and so darker colors are strong signals and lighter colors are normal ones. Buy when the line turns green and sell when it turns red.
Let me know if there are any other scripts you would like to see me publish!
DMA: Moving Average of OscillatorTechnical Indicator Moving Average of Oscillator (Moving Average of Oscillator OsMA) is the difference between the oscillator and oscillator smoothing. In this case, an oscillator is used the basic MACD line and the smoothing of the signal.
Calculate:
OSMA = MACD - SIGNAL
MACD = EMA(CLOSE, 12) - EMA(CLOSE, 26)
SIGNAL = EMA(MACD, 9)

DMA: ADX L30A modified version of the ADX indicator
Indicator average directional movement ( ADX ) helps traders determine the strength of the trend, not its actual direction. It can be used to determine whether changes in the market or starts a new trend. It refers to the average directional movement Index (DMI), and, in fact, included DMI ADX line . The oscillator ranges from 0 to 100, where high values noted a strong trend and low readings indicate a weak trend. It is often combined with directional indicators. The indicator was developed by Welles Wilder, who has created several leading trading indicators.
Disconnected the lines DI and set the horizontal level 30
-----
Модифицированная версия индикатора ADX .
Индикатор среднего направленного движения ( ADX ) помогает трейдерам определить силу тренда, а не его фактическое направление. Его можно использовать, чтобы выяснить, меняется ли рынок, или начинается новый тренд. Он относится к Индексу направленного движения (DMI) и, фактически, в DMI включена линия ADX . Осциллятор колеблется от 0 до 100, где высокие показания отмечают сильный тренд, а низкие показания указывают на слабый тренд. Он часто комбинируется с направленными индикаторами. Индикатор был разработан Уэллсом Уайлдером, который создал несколько ведущих торговых индикаторов.
Отключены линии DI и установлен горизонтальный уровень на значении 30

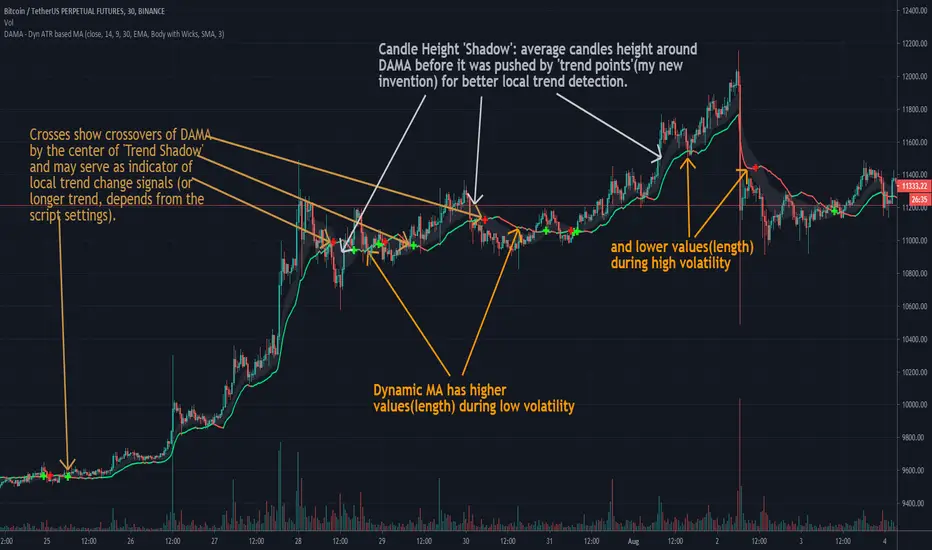
DAMA - Dyn ATR based MAEnglish description:
This is my approach to self fixing moving average that uses ATR to establish which MA length to use, considering current price volatility.
It has four settings values:
- ATR Length
- MA Length From
- MA Length To
- Choose Moving Average (2 options: SMA and EMA)
This script is invite-only for the members of our trading group (info in signature).
---------------------------------------------------------------------------------------------------
Polish description:
Niniejszy skrypt jest moim podejściem do zaprogramowania automatycznie ustalającej się średniej kroczącej, która przy wykorzystaniu ATR ustala z ilu świec wstecz obliczać cenę średnią, biorąc pod uwagę zakres zmienności ceny z danego okresu.
Skrypt posiada cztery ustawienia:
- ATR Length (długość Average True Range)
- MA Length From
- MA Length To
- Choose Moving Averaga (2 opcje: SMA i EMA)
Skrypt jest publikowany na zasadzie invite-only(konieczność przydzielenia dostępu na TradingView), a zatem dostępny jest tylko dla aktywnych użytkowników naszej grupy traderskiej, do której link można znaleść w mojej sygnaturze poniżej.
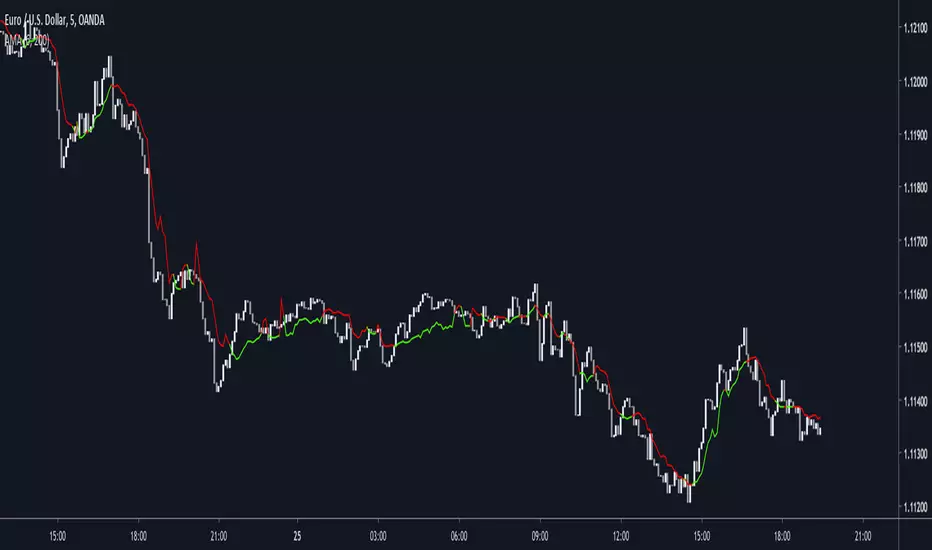
BOSS Zero-Lag Dynamic MACDTHE BEST FOREX, BINARY OPTIONS, AND CRYPTO INDICATORS FOR TRADINGVIEW.COM
Our MACD is a Zero-Lag (well near zero-lag) We make this claim because MACD utilizes Moving Averages and as you know moving averages are lagging indicators.
For our MACD we utilize The McGinley Dynamic which looks like a moving average line yet it is a smoothing mechanism for prices that turns out to track far better than any moving average.
The McGinley Dynamic minimizes price separation, price whipsaws and hugs prices much more closely.
The McGinley Dynamic does this automatically as this is a factor of the formula.
Because of the calculation, the Dynamic Line speeds up in down markets as it follows prices yet moves more slowly in up markets.
As traders we want to be quick to sell in a down market, yet ride an up market as long as possible.
Source: Investopedia.com
Chart Image shows conventional MACD on Bottom and BOSS Zero-Lag Dynamic MACD on top
Available at: bosscripts.com

Dynamically Adjustable Moving AverageIntroduction
The Dynamically Adjustable Moving Average (AMA) is an adaptive moving average proposed by Jacinta Chan Phooi M’ng (1) originally provided to forecast Asian Tiger's futures markets. AMA adjust to market condition in order to avoid whipsaw trades as well as entering the trending market earlier. This moving average showed better results than classical methods (SMA20, EMA20, MAC, MACD, KAMA, OptSMA) using a classical crossover/under strategy in Asian Tiger's futures from 2014 to 2015.
Dynamically Adjustable Moving Average
AMA adjust to market condition using a non-exponential method, which in itself is not common, AMA is described as follow :
1/v * sum(close,v)
where v = σ/√σ
σ is the price standard deviation.
v is defined as the Efficacy Ratio (not be confounded with the Efficiency Ratio) . As you can see v determine the moving average period, you could resume the formula in pine with sma(close,v) but in pine its not possible to use the function sma with variables for length, however you can derive sma using cumulation.
sma ≈ d/length where d = c - c_length and c = cum(close)
So a moving average can be expressed as the difference of the cumulated price by the cumulated price length period back, this difference is then divided by length. The length period of the indicator should be short since rounded version of v tend to become less variables thus providing less adaptive results.
AMA in Forex Market
In 2014/2015 Major Forex currencies where more persistent than Asian Tiger's Futures (2) , also most traded currency pairs tend to have a strong long-term positive autocorrelation so AMA could have in theory provided good results if we only focus on the long term dependency. AMA has been tested with ASEAN-5 Currencies (3) and still showed good results, however forex is still a tricky market, also there is zero proof that switching to a long term moving average during ranging market avoid whipsaw trades (if you have a paper who prove it please pm me) .
Conclusion
An interesting indicator, however the idea behind it is far from being optimal, so far most adaptive methods tend to focus more in adapting themselves to market complexity than volatility. An interesting approach would have been to determine the validity of a signal by checking the efficacy ratio at time t . Backtesting could be a good way to see if the indicator is still performing well.
References
(1) J.C.P. M’ng, Dynamically adjustable moving average (AMA’) technical
analysis indicator to forecast Asian Tigers’ futures markets, Physica A (2018),
doi.org
(2) www.researchgate.net
(3) www.ncbi.nlm.nih.gov

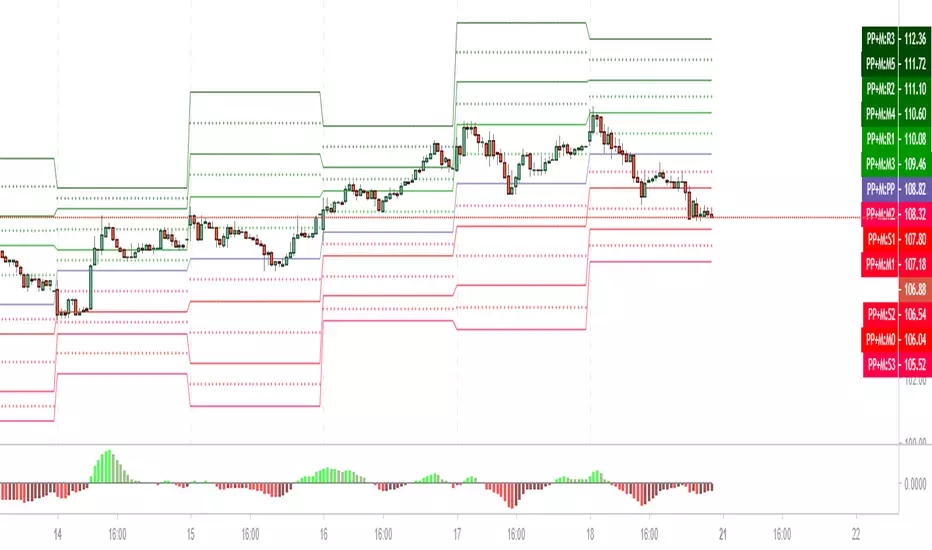
DMA: Pivot Point + Medians
Опорная точка (Pivot Point) – это уровень цены изменения направления рынка в конкретный день.
Зная уровни максимума, минимума и закрытия предыдущей сессии, и произведя простые арифметические действия, мы получим значения уровней поддержки и сопротивления.
Отличие этого метода анализа в том, что он помогает составить картину о направлении движения рынка на следующий день. Т.е. это очень удобный инструмент для торговли внутри дня, для интрадея.
Зная уровни закрытия, максимума, минимума дня сегодняшнего – можно рассчитать разворотные точки на день завтрашний.
Ввиду популярности данной теории, рынок часто реагирует на эти уровни.
Данный индикатор рассчитывает не только основные уровни Pivot Point (Floor), но и так называемые средние, медианы.
Формула расчета медиан:
Median0 = (S3 + S2)/2
Median1 = (S2 + S1)/2
Median2 = (S1 + Pivot)/2
Median3 = (PivotPoint + R1)/2
Median4 = (R1 + R2)/2
Median5 = (R2 + R3)/2