Hour/Day/Month Optimizer [CHE] Hour/Day/Month Optimizer — Bucketed seasonality ranking for hours, weekdays, and months with additive or compounded returns, win rate, simple Sharpe proxy, and trade counts
Summary
This indicator profiles time-of-day, day-of-week, and month-of-year behavior by assigning every bar to a bucket and accumulating its return into that bucket. It reports per-bucket score (additive or compounded), win rate, a dispersion-aware return proxy, and trade counts, then ranks buckets and highlights the current one if it is best or worst. A compact on-chart table shows the top buckets or the full ranking; a last-bar label summarizes best and worst. Optional hour filtering and UTC shifting let you align buckets with your trading session rather than exchange time.
Motivation: Why this design?
Traders often see repetitive timing effects but struggle to separate genuine seasonality from noise. Static averages are easily distorted by sample size, compounding, or volatility spikes. The core idea here is simple, explicit bucket aggregation with user-controlled accumulation (sum or compound) and transparent quality metrics (win rate, a dispersion-aware proxy, and counts). The result is a practical, legible seasonality surface that can be used for scheduling and filtering rather than prediction.
What’s different vs. standard approaches?
Reference baseline: Simple heatmaps or average-return tables that ignore compounding, dispersion, or sample size.
Architecture differences:
Dual aggregation modes: additive sum of bar returns or compounded factor.
Per-bucket win rate and trade count to expose sample support.
A simple dispersion-aware return proxy to penalize unstable averages.
UTC offset and optional custom hour window.
Deterministic, closed-bar rendering via a lightweight on-chart table.
Practical effect: You see not only which buckets look strong but also whether the observation is supported by enough bars and whether stability is acceptable. The background tint and last-bar label give immediate context for the current bucket.
How it works (technical)
Each bar is assigned to a bucket based on the selected dimension (hour one to twenty-four, weekday one to seven, or month one to twelve) after applying the UTC shift. An optional hour filter can exclude bars outside a chosen window. For each bucket the script accumulates either the sum of simple returns or the compounded product of bar factors. It also counts bars and wins, where a win is any bar with a non-negative return. From these, it derives:
Score: additive total or compounded total minus the neutral baseline.
Win rate: wins as a percentage of bars in the bucket.
Dispersion-aware proxy (“Sharpe” column): a crude ratio that rises when average return improves and falls when variability increases.
Buckets are sorted by a user-selected key (score, win rate, dispersion proxy, or trade count). The current bar’s bucket is tinted if it matches the global best or worst. At the last bar, a table is drawn with headers, an optional info row, and either the top three or all rows, using zebra backgrounds and color-coding (lime for best, red for worst). Rendering is last-bar only; no higher-timeframe data is requested, and no future data is referenced.
Parameter Guide
UTC Offset (hours) — Shifts bucket assignment relative to exchange time. Default: zero. Tip: Align to your local or desk session.
Use Custom Hours — Enables a local session window. Default: off. Trade-off: Reduces noise outside your active hours but lowers sample size.
Start / End — Inclusive hour window one to twenty-four. Defaults: eight to seventeen. Tip: Widen if rankings look unstable.
Aggregation — “Additive” sums bar returns; “Multiplicative” compounds them. Default: Additive. Tip: Use compounded for long-horizon bias checks.
Dimension — Bucket by Hour, Day, or Month. Default: Hour. Tip: Start Hour for intraday planning; switch to Day or Month for scheduling.
Show — “Top Three” or “All”. Default: Top Three. Trade-off: Clarity vs. completeness.
Sort By — Score, Win Rate, Sharpe, or Trades. Default: Score. Tip: Use Trades to surface stable buckets; use Win Rate for skew awareness.
X / Y — Table anchor. Defaults: right / top. Tip: Move away from price clusters.
Text — Table text size. Default: normal.
Light Mode — Light palette for bright charts. Default: off.
Show Parameters Row — Info header with dimension and span. Default: on.
Highlight Current Bucket if Best/Worst — Background tint when current bucket matches extremes. Default: on.
Best/Worst Barcolor — Tint colors. Defaults: lime / red.
Mark Best/Worst on Last Bar — Summary label on the last bar. Default: on.
Reading & Interpretation
Score column: Higher suggests stronger cumulative behavior for the chosen aggregation. Compounded mode emphasizes persistence; additive mode treats all bars equally.
Win Rate: Stability signal; very high with very low trades is unreliable.
“Sharpe” column: A quick stability proxy; use it to down-rank buckets that look good on score but fluctuate heavily.
Trades: Sample size. Prefer buckets with adequate counts for your timeframe and asset.
Tinting: If the current bucket is globally best, expect a lime background; if worst, red. This is context, not a trade signal.
Practical Workflows & Combinations
Trend following: Use Hour or Day to avoid initiating trades during historically weak buckets; require structure confirmation such as higher highs and higher lows, plus a momentum or volatility filter.
Mean reversion: Prefer buckets with moderate scores but acceptable win rate and dispersion proxy; combine with deviation bands or volume normalization.
Exits/Stops: Tighten exits during historically weak buckets; relax slightly during strong ones, but keep absolute risk controls independent of the table.
Multi-asset/Multi-TF: Start with Hour on liquid intraday assets; for swing, use Day. On monthly seasonality, require larger lookbacks to avoid overfitting.
Behavior, Constraints & Performance
Repaint/confirmation: Calculations use completed bars only; table and label are drawn on the last bar and can update intrabar until close.
security()/HTF: None used; repaint risk limited to normal live-bar updates.
Resources: Arrays per dimension, light loops for metric building and sorting, `max_bars_back` two thousand, and capped label/table counts.
Known limits: Sensitive to sample size and regime shifts; ignores costs and slippage; bar-based wins can mislead on assets with frequent gaps; compounded mode can over-weight streaks.
Sensible Defaults & Quick Tuning
Start: Hour dimension, Additive, Top Three, Sort by Score, default session window off.
Too many flips: Switch to Sort by Trades or raise sample by widening hours or timeframe.
Too sluggish/over-smoothed: Switch to Additive (if on compounded) or shorten your chart timeframe while keeping the same dimension.
Overfit risk: Prefer “All” view to verify that top buckets are not isolated with tiny counts; use Day or Month only with long histories.
What this indicator is—and isn’t
This is a seasonality and scheduling layer that ranks time buckets using transparent arithmetic and simple stability checks. It is not a predictive model, not a complete trading system, and it does not manage risk. Use it to plan when to engage, then rely on structure, confirmation, and independent risk management for entries and exits.
Disclaimer
The content provided, including all code and materials, is strictly for educational and informational purposes only. It is not intended as, and should not be interpreted as, financial advice, a recommendation to buy or sell any financial instrument, or an offer of any financial product or service. All strategies, tools, and examples discussed are provided for illustrative purposes to demonstrate coding techniques and the functionality of Pine Script within a trading context.
Any results from strategies or tools provided are hypothetical, and past performance is not indicative of future results. Trading and investing involve high risk, including the potential loss of principal, and may not be suitable for all individuals. Before making any trading decisions, please consult with a qualified financial professional to understand the risks involved.
By using this script, you acknowledge and agree that any trading decisions are made solely at your discretion and risk.
Do not use this indicator on Heikin-Ashi, Renko, Kagi, Point-and-Figure, or Range charts, as these chart types can produce unrealistic results for signal markers and alerts.
Best regards and happy trading
Chervolino
Dailyanalysis

AI Trading Alerts v6 — SL/TP + Confidence + Panel (Fixed)Overview
This Pine Script is designed to identify high-probability trading opportunities in Forex, commodities, and crypto markets. It combines EMA trend filters, RSI, and Stochastic RSI, with automatic stop-loss (SL) & take-profit (TP) suggestions, and provides a confidence panel to quickly assess the trade setup strength.
It also includes TradingView alert conditions so you can set up notifications for Long/Short setups and EMA crosses.
⚙️ Features
EMA Trend Filter
Uses EMA 50, 100, 200 for trend confirmation.
Bull trend = EMA50 > EMA100 > EMA200
Bear trend = EMA50 < EMA100 < EMA200
RSI Filter
Bullish trades require RSI > 50
Bearish trades require RSI < 50
Stochastic RSI Filter
Prevents entries during overbought/oversold extremes.
Bullish entry only if %K and %D < 80
Bearish entry only if %K and %D > 20
EMA Proximity Check
Price must be near EMA50 (within ATR × adjustable multiplier).
Signals
Continuation Signals:
Long if all bullish conditions align.
Short if all bearish conditions align.
Cross Events:
Long Cross when price crosses above EMA50 in bull trend.
Short Cross when price crosses below EMA50 in bear trend.
Automatic SL/TP Suggestions
SL size adjusts depending on asset:
Gold/Silver (XAU/XAG): 5 pts
Bitcoin/Ethereum: 100 pts
FX pairs (default): 20 pts
TP = SL × Risk:Reward ratio (default 1:2).
Confidence Score (0–4)
Based on conditions met (trend, RSI, Stoch, EMA proximity).
Labels:
Strongest (4/4)
Strong (3/4)
Medium (2/4)
Low (1/4)
Visual Panel on Chart
Shows ✅/❌ for each condition (trend, RSI, Stoch, EMA proximity, signal now).
Confidence row with color-coded strength.
Alerts
Long Setup
Short Setup
Long Cross
Short Cross
🖥️ How to Use
1. Add the Script
Open TradingView → Pine Editor.
Paste the full script.
Click Add to chart.
Save as "AI Trading Alerts v6 — SL/TP + Confidence + Panel".
2. Configure Inputs
EMA Lengths: Default 50/100/200 (works well for swing trading).
RSI Length: 14 (standard).
Stochastic Length/K/D: Default 14/3/3.
Risk:Reward Ratio: Default 2.0 (can change to 1.5, 3.0, etc.).
EMA Proximity Threshold: Default 0.20 × ATR (adjust to be stricter/looser).
3. Read the Panel
Top-right of chart, you’ll see ✅ or ❌ for:
Trend → Are EMAs aligned?
RSI → Above 50 (bull) or below 50 (bear)?
Stoch OK → Not extreme?
Near EMA50 → Close enough to EMA50?
Above/Below OK → Price position vs. EMA50 matches trend?
Signal Now → Entry triggered?
Confidence row:
🟢 Green = Strongest
🟩 Light green = Strong
🟧 Orange = Medium
🟨 Yellow = Low
⬜ Gray = None
4. Alerts Setup
Go to TradingView Alerts (⏰ icon).
Choose the script under “Condition”.
Select alert type:
Long Setup
Short Setup
Long Cross
Short Cross
Set notification method (popup, sound, email, mobile).
Click Create.
Now TradingView will notify you automatically when signals appear.
5. Example Workflow
Wait for Confidence = Strong/Strongest.
Check if market session supports volatility (e.g., XAU in London/NY).
Review SL/TP suggestions:
Long → Entry: current price, SL: close - risk_pts, TP: close + risk_pts × RR.
Short → Entry: current price, SL: close + risk_pts, TP: close - risk_pts × RR.
Adjust based on your own price action analysis.
📊 Best Practices
Use on H1 + D1 combo → align higher timeframe bias with intraday entries.
Risk only 1–2% of account per trade (position sizing required).
Filter with market sessions (Asia, Europe, US).
Strongest signals work best with trending pairs (e.g., XAUUSD, USDJPY, BTCUSD).

Previous Day and Week RangesI've designed the "Previous Day and Week Ranges" indicator to enhance your trading strategy by clearly displaying daily and weekly price levels. This tool shows Open-Close and High-Low ranges for both daily and weekly timeframes directly on your trading chart.
Key Features :
Potential Support and Resistance: The indicator highlights previous day and week ranges that may serve as key support or resistance levels in subsequent trading sessions.
Customizable Display Options: Offers the flexibility to show or hide daily and weekly ranges based on your trading needs.
Color Customization: Adjust the color settings to differentiate between upward and downward movements, enhancing visual clarity and chart readability.
This indicator is ideal for traders aiming to understand market dynamics better, offering insights into potential pivot points and zones of price stability or volatility.

MUJBOT - ADVANCED DAILY OPENTitle: MUJBOT - ADVANCED DAILY OPEN
Description:
The "MUJBOT - ADVANCED DAILY OPEN" is a versatile and user-friendly TradingView indicator designed to enhance daily trading strategies by highlighting the daily open price on the chart. This indicator is particularly useful for traders who focus on intraday price movements around the opening price of the trading day.
Key Features:
Daily Open Line: Visually represents the opening price of each trading day on the chart, providing a clear reference point for the day's initial market sentiment.
Dynamic Testing Counter: Keeps track of how many times the price tests or crosses the daily open level within the day. This feature offers insight into the significance and market reaction to the daily open price.
Customizable Display: Includes an option to show or hide the daily open line and the testing counter label. Traders can easily toggle the display according to their preference, keeping their charts uncluttered.
Real-Time Updates: The label and line are dynamically updated in real-time with each new price bar, ensuring traders have the most current information at their fingertips.
Simplicity and Efficiency: With a straightforward design, the indicator adds minimal complexity to the chart while providing valuable trading information.
Usage:
Intraday Trading: Ideal for intraday traders, the indicator helps in identifying how the current price is behaving relative to the opening price, which can be a crucial factor in decision-making.
Support and Resistance: The daily open can act as a natural support or resistance level. Monitoring how the price interacts with this level can provide insights into potential breakout or reversal opportunities.
Trend Analysis: Observing the frequency of the daily open price being tested can give clues about the day's trend strength and potential continuation or reversal.
Customization Options:
Toggle the visibility of the daily open line and label.
The line extends six bars ahead from the daily open for clear visibility.
The label displays the daily open price and the count of how many times it has been tested.
Conclusion:
The "MUJBOT - ADVANCED DAILY OPEN" indicator is a valuable tool for traders who emphasize the importance of the daily open in their trading strategy. Its simplicity, combined with real-time tracking features, makes it an essential addition to the trader's toolkit on TradingView.
Feel free to modify or add any additional details specific to your trading strategy or indicator functionality.

Percent Change of Day [ilovealgotrading]
OVERVIEW:
This indicator aims to effectively show us the percentage change of the price within the time frame we have chosen.
What is the purpose of this indicator?
This indicator shows how the price changes for each bar at different time frames we have chosen. By examining the percentage change in different time periods, we can easily look at the change in the face of the market during the time interval. Also if the price is above or below the value of 0 during the specified time, the color of our percentage line changes.
IMPLEMENTATION DETAILS:
First of all, let's understand How to Calculate Percent Change?
The difference between the old and new value of a quantity given in percentages is known as a percent change. It's rather simple to calculate the % difference between two given quantities.
The formula is given by;
Example
The price of a kilo of rice went from 10$ to12.5$, what is the percentage change?
Explanation
• The old value of sugar = $ 10
• New value = $12.5
• Now apply the percent change formula;
• Percentage change = ×100%
= x 100%
= (2.5/10) x 100%
= 25%
In this case, the percent change is positive and therefore, it is an increase.
How Is Percentage Change Used in Finance?
In the world of finance, percentage change is frequently used to analyze changes in the value of stocks or major market indexes over time.
Percentage change is used for many purposes in finance, most notably to track the price change of stocks market and crypto market.
What can we change from the settings panel ?
We can set time frame setting of the percentage change from place number 1
We are able to adjust the changing color if the percentage change is above or below zero from place 2 and 3
ALSO:
Please do not open trades without properly managing your risk and psychology!!!
If you have any ideas what to add to my work to add more sources or make calculations cooler, suggest in DM .
Multi TF High/Low/Open/Close LineNOTE: I'm not sure why the screengrab isn't showing the lines. They are there, and when I share the chart from this link they are there.... idk
This is a requested spin-off version of my previous HLOC for the Daily/Weekly/Monthly that allows users to choose 3 different timeframe units (Mins, Hours, Days, etc...) from the dropdown menu and then select the lookback period in which to draw the HLOC.
I've had quite a few requests to allow users to see multiple lookbacks for the same timeframe unit, mostly weekly, and I did not wish to change that particular script for that purpose. However, I was able to take the existing script and alter it for user input.
This indicator draws a line on the TF 1, TF 2, and TF 3 bar at the High, Low, Open and Close of user input Timeframe unit and selected lookback period.
The lookback period will go back the number of candles entered. So for example if you choose a 5 Min chart with a lookback of 3, the lines will be drawn on the HLOC 3 closed 5 min candles back. Selecting 0 will show data on the current Real-Time candle.
An example of a request I have gotten was for last week, the previous week and the previous month. The settings for that would be: TF 1 - 1 week Lookback 1, TF 2 - 1 week Lookback 2, TF 3 - 1 month Lookback 1.
Each set of lines has an optional identifying label with its own color set that can be shown with or without price value, and has drop down menus for size and style of each set of labels. The TF unit value is displayed on the label, but not the lookback.
So if you are using the hourly on all 3 TF's with different lookback periods, they will all say "60" on the label.
I recommend using the line and label options to distinguish between the different lookback values.
Each set of lines has inputs for line/text color, line width and style and each line argument can be selected independently.
In the chart example I have displayed only the High and Low on three 1 hour TF's with the lookback of 4, 5 and 6 candles with the labels descending in size. With this data I can see that over the last 6 hours the price of ES is in an descending pattern and I should be on alert for a break.
Since I trade ES in RTH on a much lower timeframe, this data can alert me to a bigger picture potential trend change or continuation. I would personally use this with pivot data for timing and look for entries in areas of high volume that moved price to a new
high or low that have not been retested.
I will be looking to add a user input offset for labels in the future. I have had bad luck with it in the past working for a couple weeks and then throwing an error, but I will look into it again soon.
I also recommend going into Chart Settings/Status Line and turning off indicator arguments OR moving the script to the top of the indicator list to avoid obstructed chart view with this indicators arguments. When script allows, I will update it to hide them.

Daily Levels Suite + Market BreadthThere are many levels suites out there but many of them use the line series and/or label series to create multiple levels. Pine v5 provides the capability to use line arrays and labels so I wanted to create some code that is extensible to add additional lines/levels and labels to an array of lines with very little effort.
There is also some Market Breadth info that can be shown in the corners of the chart to allow a user to understand how the broader markets are moving compared to the security they are charting.
Current Levels provided are as follows:
Today's Open
Previous Days Close
Previous Days High/Low
Previous Days 50%
T+2 High/Low
All levels and the market breadth table is configurable to be hidden or shown based upon the user's desire.

Multi Timeframe EMA by DigitaldYou can use this indicator to show the Daily-EMAs beside the EMAs of the current timeframe.
Everything can be adjusted
Cheers
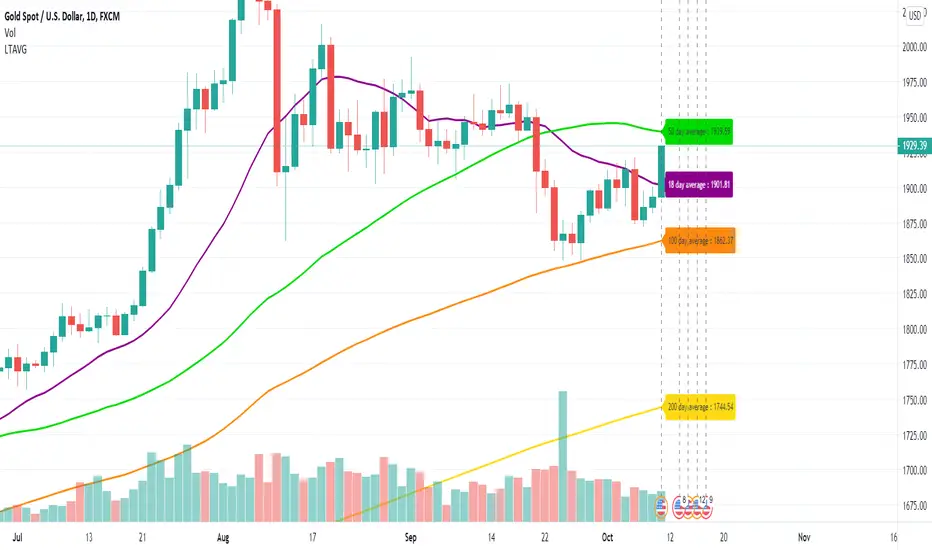
Long Term Moving AverageThis scripts plots the long term moving average calculated daily for 4 sets.
The default averages are:
18 day
50 day
100 day
200 day
The settings can be used to flexibly change this and to hide / show labels
Daily SMA x2 With InputsIdeal for Intraday charts when you want to know the daily SMAs or for daily charts if you want to save on an indicator

Humble Student OB/OS Trifecta indicatorAfter reading Cam Hui's blog post about his "Trifecta" bottom spotting model I thought I'd try my hand at scripting it as an indicator. The results are pretty close to what he describes. Though the data TradingView feeds me doesn't seem to be identical to what he's using on StockCharts.com the results are close enough that I will call the effort a success worth publishing.
