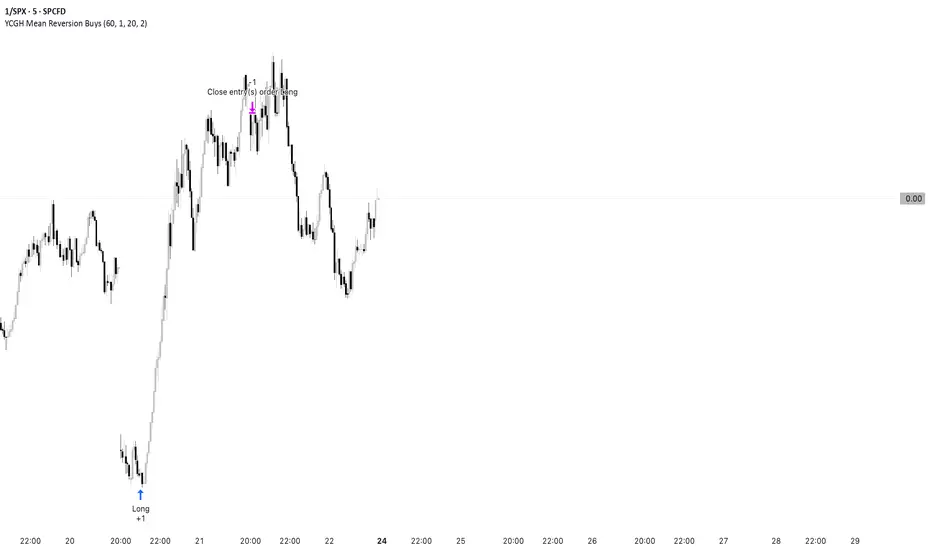
YCGH Mean Reversion StrategyThis strategy applies a classic mean-reversion framework inspired by the concepts popularized by Ernest P. Chan in his quantitative trading books.
It uses Bollinger Bands and RSI to identify statistically stretched conditions where price has moved too far from its average. When price dips below the lower band with weakening momentum, the strategy accumulates small long positions, expecting reversion toward the mean. As price rebounds above the upper band, it exits positions gradually. Position sizing limits help control risk and avoid excessive exposure.
Special thanks to Ernest P. Chan for his influential work in quantitative trading, which motivated the structure and logic behind this model.
사이클
BTC Risk Metric DCA Adapter (3Commas Webhook Strategy)Risk Metric DCA Adapter (3Commas Webhook Strategy) - WORK IN PROGRESS
This Pine Script strategy, originally inspired by the Risk Metric Indicator, is fundamentally engineered as an Adapter to interface with external trading bots like 3Commas via Webhooks. It calculates a dynamic market risk score and translates that score into specific dollar-cost averaging (DCA) entry levels and tiered profit-taking exits.
Key Features & Logic
Risk Metric Calculation (Credit to The Trading Parrot):
The strategy incorporates a complex, multi-timeframe Risk Metric calculation based on daily and weekly moving averages (SMA) and standard deviation (StDev). This metric aims to quantify the current market overextension or compression relative to long-term historical data. The resulting score dictates the level of conviction for a new trade.
Tiered DCA Entry Sizing:
The strategy defines three distinct Buy Levels (L1, L2, L3) corresponding to increasingly favorable (lower) Risk Metric scores.
L1 (Base): Risk is moderate, initiating the minimum defined trade amount.
L2 (Scaled): Risk is low, initiating L1 amount + L2 amount.
L3 (Aggressive): Risk is very low, initiating L1 + L2 + L3 amounts.
Tiered Profit-Taking Exits:
The strategy implements a staggered, partial profit-taking approach based on the Risk Metric rising:
Sell L1 & L2: Closes a percentage of the current position when the Risk Metric reaches defined high thresholds, locking in partial profits.
Sell L3 (Full Exit): Closes the remaining position when the Risk Metric reaches the highest defined threshold.
The Adapter Function (Webhook Integration)
This script is unique because it uses the Pine Script strategy() function to trigger Order Fills, which are necessary to access powerful placeholders in the TradingView alert system.
Trigger Type: The alert must be set to trigger on Any order fill.
Dynamic Webhook Data: Instead of using fixed alert() commands, the strategy generates dynamic labels (e.g., BUY_ENTRY_L3_USD_1000 or SELL_L1_PCT_25) using the strategy.entry and strategy.close commands.
Data Transfer: The alert message then uses the placeholder {{strategy.order.comment}} to pass these dynamic labels to the 3Commas bot, allowing the bot to execute the precise action (e.g., start_deal_with_volume_in_quote_currency or close_deal_at_market_percentage).
Full Strategy Webhook payload
{
"secret": "YOUR_3COMMAS_SECRET_KEY",
"max_lag": "300",
"timestamp": "{{timenow}}",
"trigger_price": "{{close}}",
"tv_exchange": "{{exchange}}",
"tv_instrument": "{{ticker}}",
"action": "{{strategy.order.action}}",
"bot_uuid": "YOUR_BOT_UUID",
"strategy_info": {
"market_position": "{{strategy.market_position}}",
"market_position_size": "{{strategy.market_position_size}}",
"prev_market_position": "{{strategy.prev_market_position}}",
"prev_market_position_size": "{{strategy.prev_market_position_size}}"
},
"order": {
"amount": "{{strategy.order.contracts}}",
"currency_type": "base",
"comment": "{{strategy.order.comment}}"
}
}
Disclaimer: This script is an adapter tool and does not guarantee profit. Trading requires manual configuration of risk settings, bot parameters, and adherence to platform-specific setup instructions.

V15.0 Adaptive Chameleon [Pro]
# **V15.0 Adaptive Chameleon – Strategy Description**
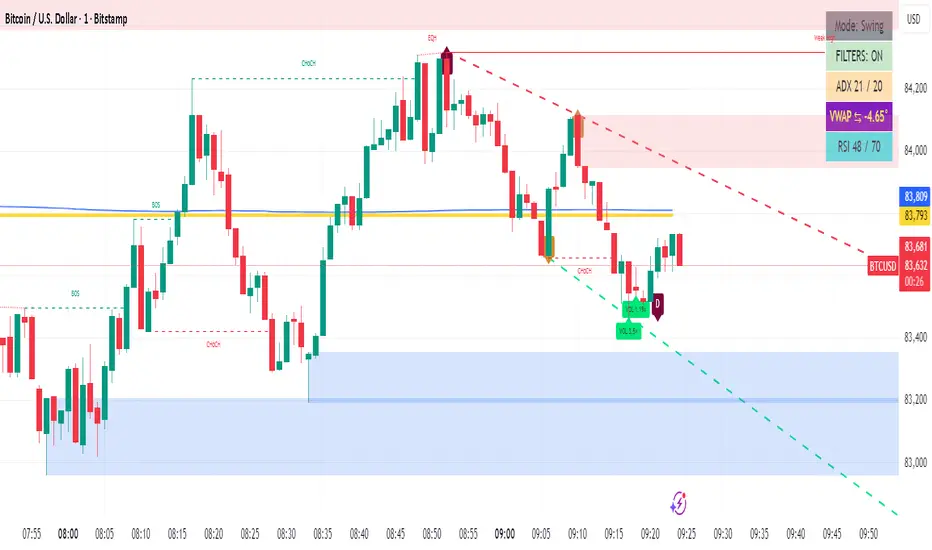
**Adaptive Chameleon** is a fully automated TradingView strategy powered by a signal engine based on multi-timeframe trend analysis, adaptive moving averages, and a volatility filter. The goal is to trade in the direction of a strong and confirmed trend, avoid opening trades in weak or manipulative price zones, and establish positions with a clearly defined risk/reward ratio.
---
## **1. General Logic and Philosophy**
The strategy divides tasks between two timeframes:
* **4-Hour Chart → Trend Manager (Boss)**
Determines the direction and strength of the trend.
* **4-Minute Chart → Entry Trigger (Operating Unit)**
Generates the ideal entry signal in the direction of the trend.
Thanks to this structure, the strategy both follows the long-term main direction and finds clear entries with low lag on smaller timeframes.
---
## **2. Trend Detection (4H)**
The strategy uses **KAMA (Kaufman Adaptive Moving Average)** and **ADX** to identify trends on the higher timeframe.
### **KAMA – Adaptive Trend Line**
* The KAMA is much more "smart" than traditional moving averages.
* It accelerates during price movements and decelerates during sideways movements.
* This allows for much clearer detection of trend direction.
### **ADX – Trend Strength Meter**
The strategy only opens trades when **trend strength** is rising (above the ADX average).
This prevents unnecessary trades when the trend is weak.
### **Trend Rules**
* Price above the KAMA → **Uptrend**
* Price below the KAMA → **Downtrend**
* ADX widening → **Trend strong**
The entry trigger is activated when these three conditions are met together.
---
## **3. Entry Engine (45m)**
On the 45-minute timeframe, the system uses the following components:
### **AlphaTrend (MFI + ATR-Based Adaptive Line)**
* Measures market flow direction with MFI (Money Flow Index),
* Measures price level breakouts with ATR (Volatility).
AlphaTrend detects whether the price is likely to reverse upwards or downwards.
### **Entry Signal**
* **Buy signal:** If the AlphaTrend has reversed upwards based on recent bars
* **Sell signal:** If the AlphaTrend has broken downwards
### **Pivot Points (For Stop)**
* The **pivotLow** and **pivotHigh** levels of the last 10 bars are calculated.
* These are used to determine the most logical stop distance.
---
## **4. Protection Shields**
The strategy uses two main filters to protect against the most dangerous conditions in the crypto market:
### **1. Pump/Dump Filter**
* A candlestick length greater than 4% is considered a "pump bar."
* Never open a trade on these bars.
The goal: to avoid sudden manipulation candlesticks.
### **2. RSI Filter**
* Long trades: RSI > 45 (open long on weak momentum)
* Short trades: RSI < 55 (open short on extremely strong momentum)
These filters provide more balanced entries.
---
## **5. Final Entry Conditions**
### **All conditions are required simultaneously for long:**
1. 4H trend up
2. ADX trend strength increasing
3. 45m AlphaTrend issued a "buy" signal
4. RSI > 45
5. No candlestick pump
6. Date range is suitable
### **All conditions apply in the opposite direction for short.**
---
## **6. Exit Mechanism (Stop, TP, Trailing)**
The strategy uses a three-layer structure on the exit side:
### **1. Pivot-Based Stop**
* Stop distance = Entry price − Pivot Low (for long)
* Minimum stop distance = **1% of the price**
Provides both structural and mathematical security.
### **2. Fixed R:R (Default 1:2)**
* TP = Entry + Stop Distance × R:R
The default 2R target is ideal for trend systems.
### **3. Optional Trailing Stop**
* Dynamic trailing stop that follows the price by a certain percentage.
* Allows trend trades to yield greater profits.
---
## **7. Chart Displays**
* Purple line:** 4H WEDGE (main trend line)
* Yellow background:** Pump protection is active (trades will not be opened on that bar)
---
## **8. Practical Effect of the Strategy**
This system has an adaptive structure based on trend variations.
**Strengths:**
* Very high accuracy (76–80% in SOL and ETH tests)
* Low drawdown (approximately 6–7%)
* Safe entries thanks to pump/dump and extreme momentum filters
* Clearly defined stop and target structure
* Low noise thanks to multi-timeframe compatibility
**Weaknesses:**
* Performance may decrease in sideways markets without trends
* Overtrading may occur if the ADX filter is closed
* Very small stops can sometimes cause unnecessary triggers
---
## **9. Conclusion**
**Adaptive Chameleon** is a trend-based and highly stable strategy with well-established risk management, manipulation filtering, and entry into lower timeframes with clear trend direction detection and low-latency signals.
SOL and ETH demonstrated strong and balanced performance in backtests with metrics such as:
* **600+ trades**
* **30–37% profit**
* **76–80% win rate**
* **Low max drawdown**

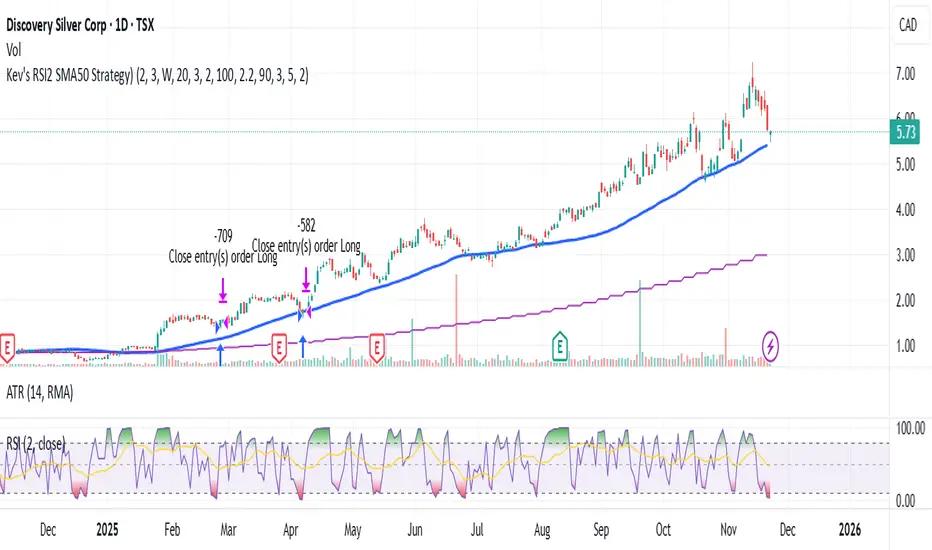
Kev's RSI2 SMA50 Strategy⭐ Kev’s RSI2 SMA50 Strategy — Institutional Edition (TSX Optimized + RR Filter)
A professional swing-trading system based on Larry Connors’ RSI(2) mean-reversion framework, optimized for TSX equities. Designed for Daily timeframe trading with institutional trend alignment, volatility filtering, and strict risk-reward controls.
📌 Overview
This strategy enhances the classic RSI(2) setup with:
• Strong trend confirmation (SMA50 + Weekly SMA50)
• Deep pullback detection (RSI2 < 3)
• Structural swing-based stop-loss
• Fixed 2R profit target (non-repainting)
• Optional Connors RSI (CRSI) confirmation
• Volatility filtering via ATR range
• Mechanical, deterministic, no-discretion rules
Works best on TSX large & mid-caps, ETFs, and liquid equities.
🔍 Core Philosophy
Buy strong stocks on pullbacks → Price must be above SMA50 + Weekly SMA50.
Pullback must be statistically meaningful → RSI(2) < 3.
R:R must justify the trade → Swing-low SL + 2R target with structural room to hit TP.
🧠 Entry Conditions (Non-Repainting)
• RSI(2) < 3 → Identifies extreme short-term oversold dips.
• SMA50 Filter → Ensures uptrend alignment.
• Weekly HTF Filter (Default = 1W) → Confirms broader trend direction.
• ATR Filter → Rejects volatile bars (range < ATR(14) × 2.2).
• Optional:
– SMA50 Slope (positive trend strength)
– Bullish Reversal Candle
– Connors RSI < 20 (deep pullback confirmation)
🎯 Risk Management
All levels are locked at entry and never repaint.
• Swing-Low SL (last 5 bars)
• 2R Profit Target = Entry + (Risk × 2)
• R:R Feasibility Filter → Only enters if recent swing high is above TP.
• Optional RSI Exit → Exit when RSI2 > 90 (enabled by default).
• Optional SMA Exit (disabled by default) → Conservative early exit.
📈 Visuals
The script plots:
• SMA50
• Weekly SMA50
• Swing-Low SL (fixed)
• 2R TP (fixed)
• Optional SMA exit line
All are non-repainting and update only on confirmed bars.
🔔 Alerts
Buy Signal → All entry filters aligned (RSI2, SMA50, HTF, ATR, RR check).
Exit Signal → 2R hit, SL hit, RSI exit, or SMA exit (if enabled).
🧭 Recommended Usage
• Timeframe: Daily
• HTF: Weekly (default)
• Best For: TSX equities, mid/large-cap stocks, ETFs
• Style: Short-term swing trading (1–10 bars)
• Avoid: Low-volume tickers, microcaps, crypto, biotech, news-driven spikes.
🛑 Notes
• All HTF data uses lookahead_off → non-repainting.
• Rules are fully mechanical and deterministic.
• Position sizing uses % equity by default.
• This script is for educational purposes only and not financial advice.
• Always forward-test before using live capital.
VIX Counter-Trend StrategyVIX Panic Index VOO Bottom-Fishing Strategy
📊 Strategy Overview
This strategy utilizes the VIX (Volatility Index) as a market sentiment indicator to help investors rationally enter positions during periods of extreme market panic, using objective technical signals to avoid emotional decision-making. It is designed to capture rebound opportunities in VOO (or other US equity ETFs) following panic-driven selloffs.
🎯 Entry and Exit Conditions
Entry Conditions (both must be met):
VIX reaches or exceeds the set threshold (default 25, adjustable)
VIX death crosses below its moving average (default 5-day MA), confirming panic sentiment is beginning to recede
Exit Conditions (three modes available):
Holding Period Mode: Exit after holding for the set number of days (default 100 days)
VIX Decline Mode: Exit when VIX falls below the set threshold (default 20)
Either Condition Mode: Exit when either condition is met
⚠️ Important Warnings
Not Suitable for Leveraged ETF Bottom-Fishing: VIX reflects market volatility. Using leveraged ETFs (such as TQQQ, SOXL) increases risk due to decay effects and greater volatility, potentially causing larger losses during panic periods.
Bear Market Inaccuracy Risk: This strategy assumes markets will rebound from panic. However, during prolonged bear markets or systemic risks (such as the 2008 financial crisis or 2022 rate hike cycle), VIX may remain elevated for extended periods, triggering multiple buy signals while prices continue declining, rendering the strategy ineffective.
Recommended to Combine with Market Trend Analysis: Works better in bull market conditions. In bear markets, consider raising VIX thresholds or suspending use.
For Reference Only, Not Investment Advice: Historical performance does not guarantee future results. Please use cautiously according to your personal risk tolerance.
VIX 恐慌指數 VOO 抄底策略
📊 策略目的
本策略利用 VIX 恐慌指數作為市場情緒指標,幫助投資人在市場極度恐慌時理性進場抄底,並透過客觀的技術訊號避免情緒化操作。適合用於捕捉 VOO(或其他美股 ETF)在恐慌性下跌後的反彈機會。
🎯 進出場條件
進場條件(同時滿足):
VIX 指數達到設定門檻以上(預設 25,可調整)
VIX 死亡交叉其均線(預設 5 日均線),確認恐慌情緒開始回落
出場條件(三種模式可選):
持有天數模式:持有達到設定天數後出場(預設 100 天)
VIX 回落模式:VIX 降至設定門檻以下時出場(預設 20)
兩者皆可模式:任一條件滿足即出場
⚠️ 重要警語
不適合槓桿型 ETF 抄底:VIX 反映的是市場波動度,使用槓桿 ETF(如 TQQQ、SOXL)會因為衰減效應和更大波動而增加風險,可能在恐慌期間造成更大虧損。
空頭市場失準風險:本策略假設市場會從恐慌中反彈,但在長期空頭或系統性風險(如 2008 金融危機、2022 升息循環)中,VIX 可能長期處於高檔,多次觸發買入訊號卻持續下跌,導致策略失效。
建議搭配大盤趨勢判斷:在多頭格局中使用效果較佳,空頭格局建議提高 VIX 門檻或暫停使用。
僅供參考,非投資建議:歷史績效不代表未來表現,請依個人風險承受度謹慎使用。

Mir Khans QQQThis strategy is built around how I actually trade QQQ intraday: Opening-Range continuation, VWAP trend reads, OI magnets, and a simple but strict risk framework. It’s designed to keep you on the right side of the session theme (trend vs fade), then only take trades when multiple pieces of confluence line up.
The strategy is tuned for QQQ on intraday timeframes, but the logic is generic enough to experiment with other liquid index products. It’s not financial advice—use it as a structured framework for reading OR, VWAP, and trend strength, and then layer your own execution rules and risk management on top.
Macketings 1min ScalpingThis is a hyper-reactive scalping strategy designed for the 1-minute chart. It utilizes a strict four-EMA hierarchy (80/90/340/500) to ensure trades are only taken in the strongest aligned market trend. The strategy is built to be extremely tight on risk and focuses on capturing the immediate, high-momentum swing that follows a confirmed EMA retest or breakout.
Key Mechanics (How it Works):
Strict Trend Alignment: Entry is only permitted when the faster EMA band (80/90) and the price action are correctly aligned with the slow trend (340/500).
Long: EMA 80/90 must be above EMA 340/500, AND EMA 340 must be above EMA 500. (And vice-versa for Short.)
Expanded Retest Entry: The strategy waits for the price to retest or briefly enter the 80/90 band, then immediately enters upon the confirmed momentum breakout from that band.
Dynamic Risk Management (Tight Ride): The strategy is engineered to ride the wave aggressively while protecting capital immediately:
Extremely Tight Initial Stop Loss (0.2% default): Limits initial risk instantly.
Break-Even Security: Once profit hits 0.3%, the Stop Loss is automatically trailed to secure 0.2% profit (a risk-free trade).
Aggressive Exit Logic: Positions are closed not only upon hitting the Take Profit target (2.5%) but also immediately if the 80/90 EMA band crosses the 340 EMA, signaling a critical loss of momentum.
Disclaimer:
This strategy requires high-liquidity instruments and is best used on low timeframes (1-minute) due to its dependency on fast momentum shifts and tight stops. Backtesting and forward testing are crucial before deployment.

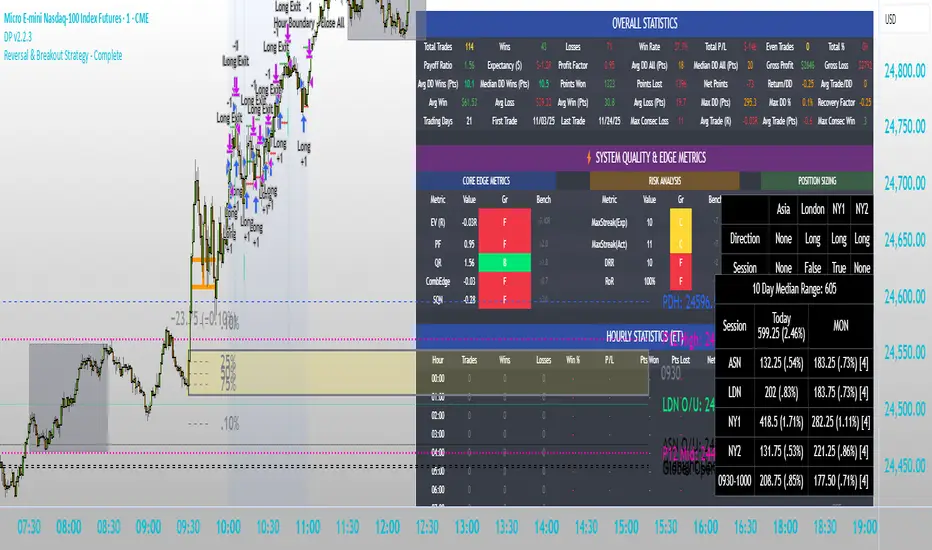
Intraday Market Structure Research Tool (Reversal + Breakout)This script is a fully rule-based intraday strategy designed for research and backtesting purposes, not financial advice. It is intended to help traders study market behavior, time-based price patterns, and statistical trade outcomes under realistic trading assumptions.
What the Strategy Does
This strategy operates in two selectable trade modes:
1. Reversal Mode
Identifies statistically large candles relative to recent volatility
Enters counter-direction trades when price shows exhaustion behavior
Designed to study fade-type behavior around session extremes
2. Breakout Mode
Tracks recent swing highs/lows over a user-defined lookback
Executes trades only after confirmed price expansion beyond these levels
Designed to test momentum continuation behavior
Time & Session Filtering
Trades are only taken during user-defined market sessions, including:
New York 1
New York 2
London
Asia
This allows users to analyze performance differences between global trading sessions.
9:30 AM Opening Range Logic
The script captures the 9:30 AM (Eastern) one-minute candle high/low and uses that as an Opening Range:
Breakout trades can be confirmed above or below this range
The range is visualized for clarity
Risk Management & Realism Controls
This script includes realistic execution mechanics:
Fixed stop-loss and take-profit defined by the user (points or ticks)
Built-in slippage modeling
Commission assumptions included
Position sizing designed to keep risk per trade under 5–10% of account equity when used with realistic account sizes
Users are responsible for choosing realistic account sizes and risk values when running backtests.
Statistical Performance Tracking
The strategy records and displays performance data including:
Win rate
Average win and loss
Maximum drawdown per trade series
Expectancy
Trade distribution by:
Time of day
Session
Market classification
This allows users to study market tendencies and structural behavior over large sample sizes.
Visual Tools
The script displays:
Entry and exit markers
Blocked trade labels (when conditions are not met)
Opening range box
Breakout levels
Use Case Disclaimer
This script is designed for:
Backtesting
Market structure research
Statistical study
It is not guaranteed to be profitable, and results depend heavily on user-selected settings, market conditions, and realistic brokerage assumptions.
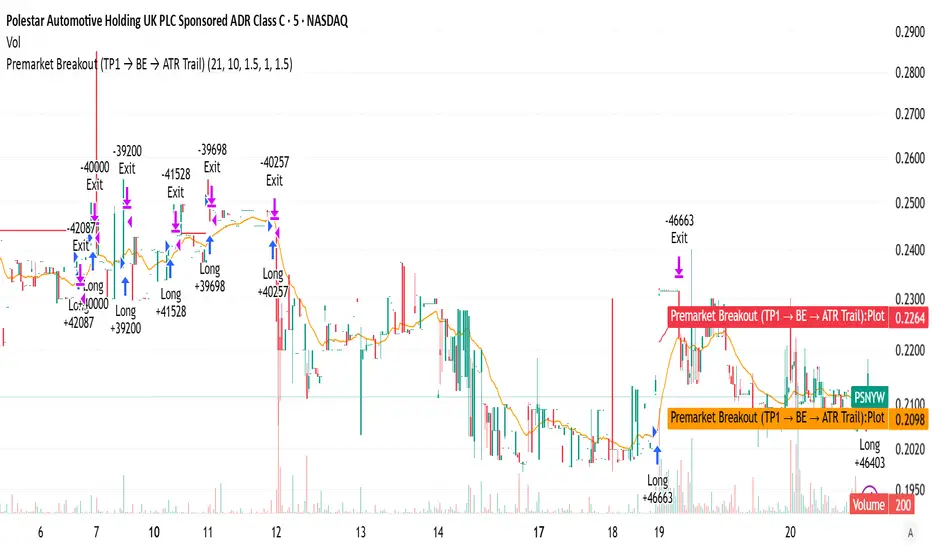
Premarket Breakout (TP1 → BE → ATR Trail)this is the best ever you will really like i t and it does a lot its a really good scirpt please use it to make trades

Premarket Breakout (TP1 → BE → ATR Trail)the best one you can find a very good indicator and strategy to help with al l trading needs in every way
Jet Stream V1Jet Stream catches the trends. Forgets the noise and allows you to lock into those big moves.
Wed, Nov 19 2025 V3 - Everything but alerts work.
Crude Oil Time + Fix Catalyst StrategyHybrid Workflow: Event-Driven Macro + Market DNA Micro
1. Macro Catalyst Layer (Your Overlays)
Event Mapping: Fed decisions, LBMA fixes, EIA releases, OPEC+ meetings.
Regime Filters: Risk-on/off, volatility regimes, macro bias (hawkish/dovish).
Volatility Scaling: ATR-based position sizing, adaptive overlays for London/NY sessions.
Governance: Max trades/day, cool-down logic, session boundaries.
👉 This layer answers when and why to engage.
2. Micro Execution Layer (Market DNA)
Order Flow Confirmation: Tape reading (Level II, time & sales, bid/ask).
Liquidity Zones: Identify support/resistance pools where buyers/sellers cluster.
Imbalance Detection: Aggressive buyers/sellers overwhelming the other side.
Precision Entry: Only trigger trades when order flow confirms macro catalyst bias.
Risk Discipline: Tight stops beyond liquidity zones, conviction-based scaling.
👉 This layer answers how and where to engage.
3. Unified Playbook
Step Macro Overlay (Your Edge) Market DNA (Jay’s Edge) Result
Event Trigger Fed/LBMA/OPEC+ catalyst flagged — Volatility window opens
Bias Filter Hawkish/dovish regime filter — Directional bias set
Sizing ATR volatility scaling — Position size calibrated
Execution — Tape confirms liquidity imbalance Precision entry
Risk Control Governance rules (cool-down, max trades) Tight stops beyond liquidity zones Disciplined exits
4. Gold & Silver Use Case
Gold (Fed Day):
Overlay flags volatility window → bias hawkish.
Market DNA shows sellers hitting bids at resistance.
Enter short with volatility-scaled size, stop just above liquidity zone.
Silver (LBMA Fix):
Overlay highlights fix window → bias neutral.
Market DNA shows buyers stepping in at support.
Enter long with adaptive size, HUD displays risk metrics.
5. HUD Integration
Macro Dashboard: Catalyst timeline, regime filter status, volatility bands.
Micro Dashboard: Live tape imbalance meter, liquidity zone map, conviction score.
Unified View: Macro tells you when to look, micro tells you when to pull the trigger.
⚡ This hybrid workflow gives you macro awareness + micro precision. Your overlays act as the radar, Jay’s Market DNA acts as the laser scope. Together, they create a disciplined, event-aware, volatility-scaled playbook for gold and silver.
Antonio — do you want me to draft this into a compile-safe Pine Script v6 template that embeds the macro overlay logic, while leaving hooks for Market DNA-style execution (order flow confirmation)? That way you’d have a production-ready skeleton to extend across TradingView, TradeStation, and NinjaTrader.
Antonio — do you want me to draft this into a compile-safe Pine Script v6 template that embeds the macro overlay logic, while leaving hooks for Market DNA-style execution (order flow confirmation)? That way you’d have a production-ready skeleton to extend across TradingView, TradeStation, and NinjaTrader.

CongTrader Strategy V1📈 CongTrader Strategy V1 — Official Overview
CongTrader Strategy V1 is a precision-built algorithm designed for intraday and swing traders who want a structured, rules-driven approach to capturing directional momentum while avoiding low-quality market conditions.
This strategy combines volatility-based logic, trend confirmation filters, and a market-conditioning engine to produce high-probability long and short signals with strictly candle-close confirmed entries (no intrabar repainting).
🔍 Core Philosophy
Modern markets move in bursts of volatility that are often preceded by subtle shifts in momentum and structure.
CongTrader V1 is engineered to:
identify emerging directional pressure early
filter out noise, consolidation, and choppy environments
only execute when multiple conditions align
maintain consistent, disciplined trade management
The result is a strategy that aims to trade quality over quantity, focusing on clear, structured setups rather than impulsive, intrabar signals.
🧠 Key Components (High-Level Explanation)
1️⃣ Directional Signal Engine (Trigger System)
The strategy uses a custom momentum-oscillation model to detect potential turning points and trend continuations.
This engine smooths price action, measures pressure extremes, and generates trigger crossovers that signal potential long or short opportunities.
(The exact formula and coefficients are proprietary and not displayed.)
2️⃣ ATR-Based Risk Management
Each trade is automatically paired with:
a volatility-adaptive stop loss, and
a volatility-adaptive profit target
This allows the strategy to adjust position management dynamically based on current market movement rather than fixed pip or dollar distances.
3️⃣ Trend Confirmation Filter (EMA)
A long-term EMA trend filter prevents counter-trend entries by ensuring:
Long positions trade only above trend
Short positions trade only below trend
This keeps signals aligned with higher-timeframe momentum.
4️⃣ VWAP Institutional Bias Filter
VWAP is used as a dynamic market fair-value reference.
The strategy only trades when price action shows favorable positioning relative to VWAP—helping avoid false moves and mean-reversion traps.
5️⃣ Range & Volatility Filter
A volatility/range filter avoids entering during tight consolidations.
If the market is not moving or lacks range expansion, the strategy waits patiently.
This significantly reduces chop and whipsaw trades.
6️⃣ RTH (Regular Trading Hours) Protection
Optionally limits trades to regular exchange hours for traders who avoid low-liquidity overnight sessions.
⏳ Candle-Close Entry Confirmation (No Repainting)
All entries are strictly confirmed after the bar closes, which means:
No intrabar fakeouts
No signal disappearance
No repainting
Cleaner, more realistic backtesting
This ensures the strategy behaves the same in backtests and in live charts.
🎯 Trade Logic Summary
A trade is only taken when:
✔ A directional trigger signal occurs
✔ Price meets VWAP bias conditions
✔ Price aligns with the long-term trend
✔ Sufficient volatility/range is present
✔ (Optional) Within regular trading hours
✔ The candle has fully confirmed
Every trade is managed automatically with ATR-based stop loss and take profit placement.
📊 Who This Strategy Is For
CongTrader V1 works well for:
Intraday traders (1–15m)
Swing traders (30m–4h)
Momentum and trend-followers
Algorithmic traders looking for disciplined, rules-based entries
Traders who want cleaner signals and less noise
Anyone who wants to avoid low-quality, choppy markets
🔔 Alerts Included
Built-in alerts notify you instantly when conditions for long or short entries are met, making it suitable for:
Manual execution
Automated trading systems
Signal services
🧩 Important Note
This strategy is designed for educational purposes and is not financial advice. Performance may vary depending on market conditions, broker feed, and instrument volatility. Always backtest thoroughly and use risk management.

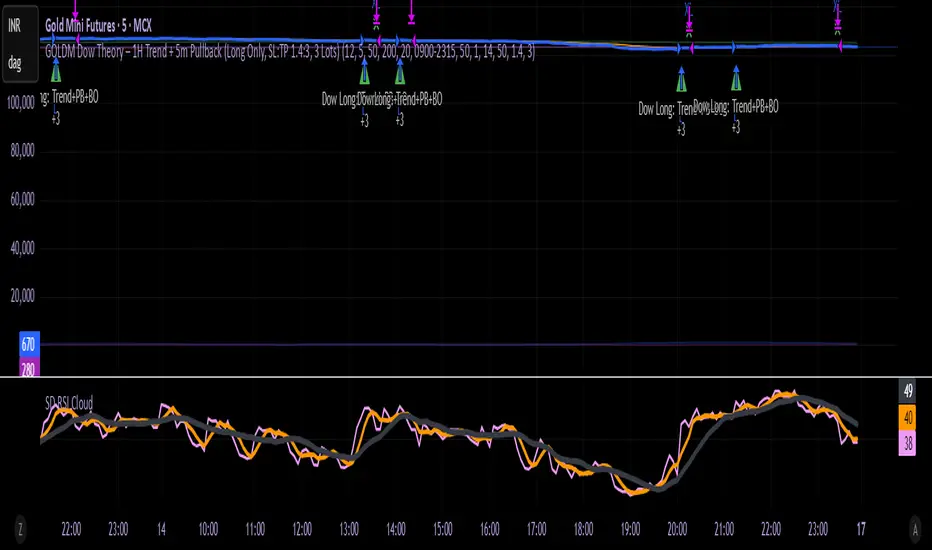
GOLDM Dow Theory – 1H Trend + 5m Pullback1. Strategy Overview
Instrument: MCX GOLDM
Chart timeframe: 5 minutes
Side: Long-only
Position size: Fixed 3 lots
Core idea:
Trade only in 1H uptrend, enter after a 5m pullback and breakout, with basic volume/volatility filters and ATR-based SL/TP.
2. High-Level Logic Flow (Per Bar)
On every 5-minute bar, the script does this:
Update session/time, volume, and ATR filters
Read 1H trend from higher timeframe
Update 5m pullback state (whether a valid dip happened)
Check if there is a valid breakout back in the direction of the 1H trend
If all filters + conditions align → enter Long (3 lots)
While in a trade:
Manage SL/TP using ATR
Close trade if 1H trend flips down or price closes below 5m EMA
Everything else (plots, alerts) is just for visibility and convenience.
3. Inputs & Configuration
Main inputs:
pullbackLookback – how many 5m bars to look back to detect a pullback
breakoutLookback – how many bars to consider for recent swing high
emaLenTrendFast / emaLenTrendSlow – 1H EMAs (50/200) for trend
emaLenPullback – 5m EMA used for pullback logic (default 20)
tradeSession – default "0900-2315" (you can change)
volLookback, volMult – volume filter
atrLen, atrSmaLen – ATR filter
slATRmult (1.4), tpATRmult (3.0) – ATR multiples → ~1.4 : 3 RR
4. Session / Time Filter
tradeSession = "0900-2315"
inSession = not useSessionFilter or not na(time(timeframe.period, tradeSession))
Only allows entries when the current bar’s time is inside 09:00–23:15.
If useSessionFilter is false, this filter is ignored.
No trade opens outside this window, but existing trades can still exit.
5. Volume & Volatility Filters
Volume Filter
avgVol = ta.sma(volume, volLookback)
highVolume = not useVolumeFilter or (volume > avgVol * volMult)
If enabled, current bar’s volume must be greater than average volume × multiplier.
Purpose: avoid thin, illiquid periods.
ATR Filter
atr5 = ta.atr(atrLen)
atrSma = ta.sma(atr5, atrSmaLen)
goodATR = not useATRFilter or (atr5 > atrSma)
If enabled, current ATR must be above its own moving average.
Purpose: avoid flat / extremely low-volatility periods.
Only if both highVolume and goodATR are true, the system considers entering.
6. Higher Timeframe Trend (1H)
emaFast1h = request.security(syminfo.tickerid, "60", ta.ema(close, emaLenTrendFast), ...)
emaSlow1h = request.security(syminfo.tickerid, "60", ta.ema(close, emaLenTrendSlow), ...)
trendUp = emaFast1h > emaSlow1h
trendDown = emaFast1h < emaSlow1h
On the 1-hour timeframe:
If EMA Fast (50) > EMA Slow (200) → trendUp = true
If EMA Fast (50) < EMA Slow (200) → trendDown = true
This is the core trend filter:
We only look for longs when trendUp is true.
7. 5-Minute Structure Logic (Dow-style)
7.1 Pullback Detection
emaPull = ta.ema(close, emaLenPullback)
pulledBackLong = ta.lowest(close, pullbackLookback) < emaPull
A pullback is defined as:
In the last pullbackLookback bars, price closed below the 5m EMA (emaPull) at least once.
This indicates a dip against the 1H uptrend.
A state flag tracks this:
var bool hadLongPullback = false
hadLongPullback := trendUp and pulledBackLong ? true : (not trendUp ? false : hadLongPullback)
When:
trendUp AND pulledBackLong → hadLongPullback = true.
If the trend stops being up (trendUp = false), flag resets to false.
So the system remembers:
“There has been a proper dip while the 1H uptrend is active.”
7.2 Breakout Confirmation
recentHigh = ta.highest(high, pullbackLookback)
breakoutUp = close > recentHigh
After a pullback, we wait for price to close above the highest high of recent bars (excluding the current one).
This mimics:
“Higher high after a higher low” → breakout in Dow Theory terms.
8. Final Long Entry Logic
The base entry condition:
baseLongEntry =
trendUp and
hadLongPullback and
breakoutUp and
close > emaPull
Translated:
1H trend is up (trendUp).
A valid pullback happened recently (hadLongPullback).
Current candle broke above the recent swing high (breakoutUp).
Price is now back above the 5m EMA (pullback is resolving, not deepening).
Then filters are applied:
longEntryCond =
baseLongEntry and
inSession and
highVolume and
goodATR and
not isLong
So a long entry only occurs if:
Core structure conditions (baseLongEntry) are true
Time is within session
Volume is high enough
ATR is healthy
You are not already in a long
When longEntryCond is true:
if longEntryCond
strategy.entry("Long", strategy.long, comment = "Dow Long: Trend+PB+BO")
hadLongPullback := false
Enters 3 lots long (as per default_qty_type + default_qty_value).
Resets hadLongPullback so we don’t re-use the same pullback.
9. Exit Logic
There are two exit layers:
9.1 Logical Exit (Trend or Structure Change)
exitLongTrendFlip = trendDown
exitLongEMA = ta.crossunder(close, emaPull)
longExitCond = isLong and (exitLongTrendFlip or exitLongEMA)
If in a long:
Exit when trend flips down (1H EMA50 < EMA200), OR
Price crosses below 5m EMA (pullback may be turning into reversal).
Then:
if longExitCond
strategy.close("Long", comment = "Exit Long: Trend flip / EMA break")
This closes the position at market (on bar close).
9.2 ATR-based Stop Loss & Take Profit
if useSLTP and isLong
longStop = strategy.position_avg_price - atr5 * slATRmult
longLimit = strategy.position_avg_price + atr5 * tpATRmult
strategy.exit("Long SLTP", "Long", stop = longStop, limit = longLimit)
SL = entry price – 1.4 × ATR(14, 5m)
TP = entry price + 3.0 × ATR(14, 5m)
This gives roughly 1.4 : 3 RR.
If SL or TP is hit, strategy.exit will close the trade.
So exits can come from:
Hitting Stop Loss
Hitting Take Profit
OR logic-based exit (trend flip / EMA break)
10. Alerts
Two alertconditions:
alertcondition(longEntryCond, title="Long Entry Signal",
message="GOLDM LONG: 1H Uptrend + 5m Pullback Breakout + Filters OK")
alertcondition(longExitCond, title="Long Exit Signal",
message="GOLDM LONG EXIT: Trend flip or EMA break")
You can set TradingView alerts based on:
“Long Entry Signal” → tells you when all entry conditions align.
“Long Exit Signal” → tells you when the logic-based exit triggers.
(ATR SL/TP exits won’t auto-alert unless you separately set price alerts or add extra conditions.)
11. Mental Model Summary (How YOU should think about it)
For every trade, the system is basically doing this:
Is GOLDM in an uptrend on 1H?
→ If no: do nothing
Did we get a clear dip below 5m EMA in that uptrend?
→ If no: wait
Did price then break above recent highs and reclaim EMA20?
→ If yes: this is our Dow-style continuation entry
Is market liquid and moving (volume + ATR)?
→ If yes: go Long with 3 lots
Manage with:
ATR SL & TP
Exit early if 1H trend flips or price falls back below EMA20

Positional Supertrend Strategy (1D Filter + 2H Entry)Positional Supertrend Strategy (1D Filter + 2H Entry)

GMH : Tech Bubble Good Morning Holding
Simulating How to Ride the Bubble — and Jump Out Before the Crash
Be careful! Most simulation results show that this strategy sometimes underperforms a simple buy-and-hold, because it gives away positions during deep retracements and buys back at higher thresholds.
Humans often struggle with cutting losses. When the pain becomes too much, they lose the confidence needed to execute even a reasonable strategy.
But in terms of mentality, this approach reduces long-term portfolio volatility. It helps investors feel more at peace, especially during real market crashes like the tech bubble in 2021.
How to use : Select TimeFrame 4HR on trading view

ADILS_TREND_V5Swing 15 mins using RSI and MAs ... catching the turn around in trend in all time frames. Works best on 15 mins

[Bybit BTCUSD.P] 7Years Backtest Results. 2,609% +Non-Repainting📊 I. Strategy Overview: Trust Backed by Numbers
The ADX Sniper v12 strategy has been rigorously tested over 7 years, from November 14, 2018 to November 8, 2025, spanning every major cycle of the Bitcoin
BTCUSD.P futures market. This strategy successfully balances two often-conflicting goals: maximizing profitability while minimizing volatility, all supported by objective performance data.
This strategy has been validated across all Bitcoin (BTCUSD.P) futures market cycles over a 7-year period.
■ Visual Proof: Bar Replay Simulation
The chart above demonstrates actual entry and exit points captured via TradingView's Bar Replay feature. The green rectangle highlights the core profitable trading zone, showing where the strategy successfully captured sustained uptrends. This visual evidence confirms:
Confirmed buy/sell signals with exact execution prices (marked in red and blue)
No repainting or signal distortion after candle close
Consistent performance across multiple market cycles within the highlighted zone
💰 Core Performance Metrics:
Cumulative Return: 2,609.14% (compounded growth over 7 years)
Maximum Drawdown (MDD): 6.999% (preserving over 93% of capital)
Average Profit/Loss Ratio: 8.003 (industry-leading risk-reward efficiency)
Total Trades: 24 (focused exclusively on high-conviction opportunities)
Sortino Ratio: 11.486 (mathematically proving robustness and stability)
✅ This strategy has been validated across all Bitcoin BTCUSD.P futures market cycles over a 7-year period.
📊 I. 전략 개요: 숫자로 입증된 신뢰
ADX Sniper v12 전략은 2018년 11월 14일부터 2025년 11월 8일까지 약 7년간 비트코인 (BTCUSD.P) 선물 시장의 모든 주요 사이클을 거치며 엄격하게 검증되었습니다. 수익성 극대화와 변동성 최소화라는 상충되는 목표를 동시에 달성한 이 전략의 핵심 성과 지표를 객관적 데이터를 통해 확인하실 수 있습니다.
본 전략은 7년간의 모든 비트코인 (BTCUSD.P) 선물 시장 사이클에서 검증되었습니다.
■ 시각적 증명: 바 리플레이 시뮬레이션
위 차트는 TradingView의 바 리플레이 기능으로 포착된 실제 진입 및 청산 시점을 보여줍니다. 녹색 네모는 핵심 수익 구간을 표시하며, 전략이 지속적인 상승 추세를 성공적으로 포착한 영역을 나타냅니다. 본 시각 자료는 다음을 입증합니다:
정확한 체결 가격이 표기된 확정된 매수/매도 신호 (빨강색과 파랑색으로 표시)
캔들 종가 후 신호 왜곡이나 리페인팅 없음
강조 표시된 구간 내 여러 시장 사이클에 걸친 일관된 성과
💰 핵심 성과 지표:
누적 수익률: 2,609.14% (7년간 복리 성장 입증)
최대 낙폭 (MDD): 6.999% (7년간 자본의 93% 이상 보존)
평균 손익비: 8.003 (업계 최고 수준의 위험-보상 효율성)
총 거래 횟수: 24회 (고확신 기회에만 집중)
소르티노 비율: 11.486 (전략의 견고성과 안정성을 수학적으로 입증)
✅ 본 전략은 7년간의 모든 비트코인 (BTCUSD.P) 선물 시장 사이클에서 검증되었습니다.
🛡️ II. Core Philosophy: Cut Losses Short, Let Profits Run
Why MDD Stays Below 7% in a Volatile Market
The crypto futures market typically experiences daily volatility exceeding 10%, with most strategies enduring drawdowns between 30% and 50%. In stark contrast, this strategy has never exceeded a 7% account loss over seven years. This exceptional low MDD is achieved through deliberate design mechanisms, not luck:
🎯 Entry Filtering: The 'ADX Pop-up Filter' is the core component. It enables the strategy to strictly avoid trading when market conditions indicate major reversals or consolidation phases, thereby minimizing exposure to high-risk zones.
🏛️ Capital Preservation Priority: The strategy prioritizes investor psychological stability and capital preservation over pursuing maximum potential returns.
The Power of an 8.003 Profit Factor
The Profit Factor measures the ratio of total profitable trades to total losing trades. It's the most critical metric for assessing risk-adjusted returns.
A Profit Factor of 8.003 means that for every dollar lost, the strategy earns an average of eight dollars. This demonstrates the efficiency of a true trend-following strategy:
Cutting losses quickly (averaging $177,419 USD loss per trade)
Riding winners for maximum extension (averaging $1,419,920 USD profit per trade)
🛡️ II. 핵심 철학: 손실은 빠르게 자르고, 수익은 끝까지
암호화폐 시장에서 MDD <7%의 의미
암호화폐 선물 시장은 일일 변동성이 10%를 초과하는 경우가 빈번하며, 일반적인 전략들은 30~50%의 MDD를 겪습니다. 이와 극명한 대조로, 본 전략은 7년간 단 한 번도 7%를 초과하는 계좌 손실을 기록하지 않았습니다. 이렇게 극도로 낮은 MDD는 운이 아닌 체계적인 메커니즘을 통해 달성되었습니다:
🎯 진입 필터링: 'ADX 팝업 필터'가 핵심 구성 요소로, 시장 상황이 주요 반전이나 횡보를 나타낼 때 거래를 엄격히 회피하여 고위험 구간 노출을 최소화합니다.
🏛️ 자본 보존 우선: 본 전략은 최대 잠재 손실을 감수하기보다 투자자의 심리적 안정성과 자본 보존을 우선시하도록 설계되었습니다.
손익비 8.003의 힘
손익비는 '총 수익 거래'와 '총 손실 거래'의 비율로, 위험 조정 수익을 측정하는 핵심 지표입니다.
8.003이라는 값은 1달러를 잃을 때마다 평균적으로 8달러 이상을 벌어들이는 구조를 의미합니다. 이는 진정한 추세 추종 전략의 최대 효율성을 보여줍니다:
손실은 빠르게 자르고 ($177,419 USD 평균 손실)
수익은 최대한 연장합니다 ($1,419,920 USD 평균 수익)
🎯 III. Strategy Reliability and Structural Edge
The Secret of 24 Trades in 7 Years
Only 24 trades over 7 years signifies that this strategy ignores 99% of market volatility and targets only the 1% of 'most certain buying cycles'. This approach eliminates the drag from excessive trading:
❌ No commission bleed
❌ No slippage erosion
❌ No psychological wear from overtrading
📈 Long-Term Trend Following: The strategy analyzes Bitcoin's long-term price cycles to capture the onset of massive trends while remaining undisturbed by short-term market noise.
Non-Repainting Structure: Alignment of Reality and Simulation
🎬 Non-Repainting Proof Video Available
※↑ "If you wish, I can also show you a video as evidence of the non-repainting throughout the 7 years."
✅ Real-Time Trading Reliability: This strategy is built with a non-repainting structure, generating buy/sell signals only after each candle's closing price is confirmed.
✅ Preventing Data Exaggeration: This design ensures that backtest results do not 'repaint' or distort past performance, guaranteeing high correlation between simulated results and actual live trading environments.
✅ Live Trading Advantage: While simulations use closing prices, live trading may allow entry at more favorable prices before candle close, potentially yielding even better execution than backtest results.
🎯 III. 전략의 신뢰성과 구조적 우위
7년간 24회 거래의 비밀
7년간 단 24회의 거래는 시장 변동성의 99%를 무시하고 오직 1%의 '가장 확실한 매수 사이클'만을 타겟으로 한다는 것을 의미합니다. 이는 과도한 거래로 인한 문제를 근본적으로 제거합니다:
❌ 수수료 소모 없음
❌ 슬리피지 침식 없음
❌ 과도한 트레이딩으로 인한 심리적 소모 없음
📈 장기 추세 추종: 비트코인 가격 역사를 지배하는 장기 사이클 분석을 활용하여, 단기 시장 노이즈에 흔들리지 않고 대규모 추세의 시작점을 포착하는 데 집중합니다.
논-리페인팅 구조: 현실과 시뮬레이션의 일치
🎬 논-리페인팅 증명 영상 제공 가능
※↑ "원하신다면 7년간 리페인팅이 없음을 증명하는 영상도 보여드릴 수 있습니다."
✅ 실시간 거래 신뢰성: 본 전략은 논-리페인팅 구조로 구축되어, 캔들의 종가가 확정된 후에만 매수/매도 신호를 생성합니다.
✅ 데이터 과장 방지: 이러한 설계는 백테스트 결과가 과거 성과를 '리페인팅'하거나 과장하지 않도록 보장하며, 시뮬레이션 결과와 실제 라이브 거래 환경 간의 높은 상관관계를 보장합니다.
✅ 라이브 실행 우위 가능성: 시뮬레이션은 종가 기준이지만, 라이브 운영 시 캔들이 마감되기 전 더 유리한 가격에 진입할 수 있어 시뮬레이션 결과보다 더 나은 실행 성과를 얻을 가능성이 있습니다.
📈 IV. Performance Summary (November 14, 2018 - November 8, 2025)
| Metric | Value || Metric | Value |
|--------|-------|
| Initial Capital | $1,000,000 |
| Net Profit | +$26,091,383.74 |
| Cumulative Return | +2,609.14% |
| Maximum Drawdown | -6.999% |
| Total Trades | 24 |
| Winning Trades | 19 (79.17%) |
| Losing Trades | 5 (20.83%) |
| Avg Winning Trade | +$1,419,920.16 |
| Avg Losing Trade | -$177,419.86 |
| Profit Factor | 8.003 |
| Sortino Ratio | 11.486 |
| Win/Loss Ratio | 8.003 |
⚙️ Default Settings:
Slippage: 0 ticks
Commission: 0.333% (Bybit standard)
📈 IV. 성과 지표 요약 (2018년 11월 14일 ~ 2025년 11월 8일)
|| 지표 | 값 |
|--------|-------|
| 초기 자본 | $1,000,000 |
| 순이익 | +$26,091,383.74 |
| 누적 수익률 | +2,609.14% |
| 최대 낙폭 | -6.999% |
| 총 거래 횟수 | 24 |
| 수익 거래 | 19 (79.17%) |
| 손실 거래 | 5 (20.83%) |
| 평균 수익 거래 | +$1,419,920.16 |
| 평균 손실 거래 | -$177,419.86 |
| 손익비 | 8.003 |
| 소르티노 비율 | 11.486 |
| 평균 손익 비율 | 8.003 |
⚙️ 기본 설정:
슬리피지: 0틱 (기본값)
수수료: 0.333% (Bybit 표준)
👥 V. Who Is This Strategy For?
✅ Long-term Bitcoin investors seeking stable, low-drawdown returns
✅ Traders tired of overtrading who prefer surgical, sniper-style precision entries
✅ Investors seeking psychological stability by avoiding large account swings
✅ Data-driven decision makers who value proven performance over marketing claims
👥 V. 이 전략은 누구를 위한 것인가요?
✅ 안정적이고 낮은 낙폭의 수익을 추구하는 장기 비트코인 투자자
✅ 과도한 매매에 지친 트레이더로 저격수 스타일의 정밀한 진입을 선호하는 분
✅ 큰 계좌 변동을 피하여 심리적 안정성을 추구하는 투자자
✅ 주장보다 검증된 객관적 성과를 중시하는 데이터 기반 의사 결정자
🔒 VI. Access & Disclaimer
🔐 Access Type: Invite-Only (Protected Source Code)
💬 How to Get Access: Send a private message or leave a comment below
⚠️ Important Disclaimer:
Past performance does not guarantee future results. Cryptocurrency and futures trading involve substantial risk of loss. This strategy is provided for educational and informational purposes only. Users should conduct their own research and consult with a financial advisor before making investment decisions. The author is not responsible for any financial losses incurred from using this strategy.
🔒 VI. 접근 방법 및 면책사항
🔐 접근 유형: 초대 전용 (소스코드 보호)
💬 접근 방법: 비공개 메시지 또는 아래 댓글 남기기
⚠️ 중요 면책사항:
과거 성과가 미래 결과를 보장하지 않습니다. 암호화폐 및 선물 거래는 상당한 손실 위험을 수반합니다. 본 전략은 교육 및 정보 제공 목적으로만 제공됩니다. 사용자는 투자 결정을 내리기 전 자체 조사를 수행하고 재무 자문가와 상담해야 합니다. 저자는 본 전략 사용으로 인한 재정적 손실에 대해 책임지지 않습니다.
🏷️ VII. Tags
Bitcoin |Bitcoin | BTCUSD | BTCUSD.P | Bybit | DailyChart | LongTerm | TrendFollowing | ADX | NonRepainting | Strategy | BacktestProven | SevenYears | LowDrawdown | HighProfitFactor | StableReturns | CapitalPreservation | Ichimoku | DMI | SuperTrend | TechnicalAnalysis | Volatility | RiskManagement | AutoTrading | Futures | PerpetualFutures | AlgorithmicTrading | SystematicTrading | DataDriven | InviteOnly | ProtectedScript | SnipperTrading | HighConviction | MDD | SortinoRatio
🏷️ VII. 태그
비트코인 |비트코인 | BTCUSD | BTCUSD.P | 바이비트 | 일봉 | 장기투자 | 추세추종 | ADX | 논리페인팅 | 전략 | 백테스트검증 | 7년검증 | 저낙폭 | 고손익비 | 안정수익 | 자본보존 | 일목균형표 | DMI | 슈퍼트렌드 | 기술적분석 | 변동성 | 위험관리 | 자동매매 | 선물 | 무기한선물 | 알고리즘트레이딩 | 시스템트레이딩 | 데이터기반 | 초대전용 | 보호스크립트 | 저격수트레이딩 | 고확신 | MDD | 소르티노비율
📌 Note: This strategy is designed exclusively for Bybit BTCUSD.P perpetual futures on the 1-day (daily) timeframe. Performance may vary significantly on other symbols or timeframes.
📌 참고: 본 전략은 Bybit BTCUSD.P 무기한 선물 계약의 1일봉(Daily) 타임프레임에 전용으로 설계되었습니다. 다른 심볼이나 타임프레임에서는 성과가 크게 달라질 수 있습니다.

[Bybit BTCUSD.P] 7Years Backtest Results. 2,609% +Non-Repainting
📊 I. Strategy Overview: Trust Backed by Numbers
The ADX Sniper v12 strategy has been rigorously tested over 7 years, from November 14, 2018 to November 8, 2025, spanning every major cycle of the Bitcoin BTCUSD.P futures market. This strategy successfully balances two often-conflicting goals: maximizing profitability while minimizing volatility, all supported by objective performance data.
This strategy has been validated across all Bitcoin (BTCUSD.P) futures market cycles over a 7-year period.
■ Visual Proof: Bar Replay Simulation
The chart above demonstrates actual entry and exit points captured via TradingView's Bar Replay feature. The green rectangle highlights the core profitable trading zone, showing where the strategy successfully captured sustained uptrends. This visual evidence confirms:
1) Confirmed buy/sell signals with exact execution prices (marked in red and blue)
2) No repainting or signal distortion after candle close
3) Consistent performance across multiple market cycles within the highlighted zone
💰 Core Performance Metrics:
Cumulative Return : 2,609.14% (compounded growth over 7 years)
Maximum Drawdown (MDD) : 6.999% (preserving over 93% of capital)
Average Profit/Loss Ratio : 8.003 (industry-leading risk-reward efficiency)
Total Trades : 24 (focused exclusively on high-conviction opportunities)
Sortino Ratio : 11.486 (mathematically proving robustness and stability)
✅ This strategy has been validated across all Bitcoin BTCUSD.P futures market cycles over a 7-year period.
🛡️ II. Core Philosophy: Cut Losses Short, Let Profits Run
Why MDD Stays Below 7% in a Volatile Market
The crypto futures market typically experiences daily volatility exceeding 10%, with most strategies enduring drawdowns between 30% and 50%. In stark contrast, this strategy has never exceeded a 7% account loss over seven years. This exceptional low MDD is achieved through deliberate design mechanisms, not luck:
🎯 Entry Filtering: The 'ADX Pop-up Filter' is the core component. It enables the strategy to strictly avoid trading when market conditions indicate major reversals or consolidation phases, thereby minimizing exposure to high-risk zones.
🏛️ Capital Preservation Priority: The strategy prioritizes investor psychological stability and capital preservation over pursuing maximum potential returns.
The Power of an 8.003 Profit Factor
The Profit Factor measures the ratio of total profitable trades to total losing trades. It's the most critical metric for assessing risk-adjusted returns.
A Profit Factor of 8.003 means that for every dollar lost, the strategy earns an average of eight dollars. This demonstrates the efficiency of a true trend-following strategy:
Cutting losses quickly (averaging $177,419 USD loss per trade)
Riding winners for maximum extension (averaging $1,419,920 USD profit per trade)
🎯 III. Strategy Reliability and Structural Edge
The Secret of 24 Trades in 7 Years
Only 24 trades over 7 years signifies that this strategy ignores 99% of market volatility and targets only the 1% of 'most certain buying cycles'. This approach eliminates the drag from excessive trading:
❌ No commission bleed
❌ No slippage erosion
❌ No psychological wear from overtrading
📈 Long-Term Trend Following: The strategy analyzes Bitcoin's long-term price cycles to capture the onset of massive trends while remaining undisturbed by short-term market noise.
Non-Repainting Structure: Alignment of Reality and Simulation
🎬 Non-Repainting Proof Video Available
※↑ "If you wish, I can also show you a video as evidence of the non-repainting throughout the 7 years."
✅ Real-Time Trading Reliability: This strategy is built with a non-repainting structure, generating buy/sell signals only after each candle's closing price is confirmed.
✅ Preventing Data Exaggeration: This design ensures that backtest results do not 'repaint' or distort past performance, guaranteeing high correlation between simulated results and actual live trading environments.
✅ Live Trading Advantage: While simulations use closing prices, live trading may allow entry at more favorable prices before candle close, potentially yielding even better execution than backtest results.
📈 IV. Performance Summary (November 14, 2018 - November 8, 2025)
|| Metric | Value |
|--------|-------|
| Initial Capital | $1,000,000 |
| Net Profit | +$26,091,383.74 |
| Cumulative Return | +2,609.14% |
| Maximum Drawdown | -6.999% |
| Total Trades | 24 |
| Winning Trades | 19 (79.17%) |
| Losing Trades | 5 (20.83%) |
| Avg Winning Trade | +$1,419,920.16 |
| Avg Losing Trade | -$177,419.86 |
| Profit Factor | 8.003 |
| Sortino Ratio | 11.486 |
| Win/Loss Ratio | 8.003 |
⚙️ Default Settings:
Slippage: 0 ticks
Commission: 0.333% (Bybit standard)
👥 V. Who Is This Strategy For?
✅ Long-term Bitcoin investors seeking stable, low-drawdown returns
✅ Traders tired of overtrading who prefer surgical, sniper-style precision entries
✅ Investors seeking psychological stability by avoiding large account swings
✅ Data-driven decision makers who value proven performance over marketing claims
🔒 VI. Access & Disclaimer
🔐 Access Type: Invite-Only (Protected Source Code)
💬 How to Get Access: Send a private message or leave a comment below
⚠️ Important Disclaimer:
Past performance does not guarantee future results. Cryptocurrency and futures trading involve substantial risk of loss. This strategy is provided for educational and informational purposes only. Users should conduct their own research and consult with a financial advisor before making investment decisions. The author is not responsible for any financial losses incurred from using this strategy.
🏷️ VII. Tags
Bitcoin |Bitcoin | BTCUSD | BTCUSD.P | Bybit | DailyChart | LongTerm | TrendFollowing | ADX | NonRepainting | Strategy | BacktestProven | SevenYears | LowDrawdown | HighProfitFactor | StableReturns | CapitalPreservation | Ichimoku | DMI | SuperTrend | TechnicalAnalysis | Volatility | RiskManagement | AutoTrading | Futures | PerpetualFutures | AlgorithmicTrading | SystematicTrading | DataDriven | InviteOnly | ProtectedScript | SnipperTrading | HighConviction | MDD | SortinoRatio
📌 Note: This strategy is designed exclusively for Bybit BTCUSD.P perpetual futures on the 1-day (daily) timeframe. Performance may vary significantly on other symbols or timeframes.

週一普跌策略 Monday shit Strategy Strategy Description / 策略敘述
EN
This strategy takes a short position at the start of each Monday, based on the hypothesis that cryptocurrency markets tend to experience post-weekend risk-off behavior.
The system enters a full-equity short position at the Tokyo open (Taipei 08:00), aiming to capture Monday downside pressure resulting from accumulated weekend information and macro sentiment adjustments when traditional financial markets reopen.
Risk management uses fixed percentage take-profit and stop-loss levels, emphasizing asymmetric reward-to-risk (large occasional gains, small frequent losses).
The model reflects the increasing alignment between crypto price behavior and traditional financial market cycles.
ZH-TW
本策略於每週一開盤時做空,基於假設加密資產在週末後具有風險釋放與補跌傾向。
系統會在台北時間早上 08:00 以全倉做空,目標捕捉因週末累積消息與傳統金融市場重新開盤所造成的下跌壓力。
風控採固定止盈、止損百分比,強調高報酬/低風險的不對稱結構(小虧多次、偶爾大賺)。
此模型反映加密貨幣市場行為與華爾街週期愈趨一致的市場現象。


Freedom Candlestick v5.0.5The is a momentum trading strategy for futures. There are also components of ICT, trend following, volume distribution, and volatility involved in the logic. We are currently using it on NQ and GC. We are also in the process of building a set up to work with ES.
