Pattern DetectorPattern Detector
Identifies and summarizes common chart patterns on any symbol/timeframe. Shows a compact table of the most recent confirmed patterns (up to 6), optional candle coloring that matches table row colors, and optional targets for context. Designed for analysis support only.
What it detects
Triangles and wedges, flags and pennants, head & shoulders (and inverse), rectangles, channels, broadening formations, double/triple tops & bottoms, cup & handle (and inverse), rounding tops/bottoms, diamonds, bump & run, island reversals, staircase patterns, V patterns, gaps (up/down), pipe/spike patterns, harmonic ABCD, Elliott (simplified), three drives, Quasimodo, dead cat bounce, tower top/bottom, shakeout, and Wolfe waves.
Inputs
Lookback Mode: Auto or Manual (Manual Lookback bars)
Min Confidence to Confirm: threshold for confirmation
Display: Show Pattern Table, Show Pattern Numbers, Color Pattern Candles
Style: table row colors; bullish/bearish direction colors
Notes:
Candle coloring uses the table’s row colors and requires Show Pattern Table to be enabled.
Targets are approximate and for reference only.
Alerts
Pattern Confirmed
Pattern Target Reached
Important
Educational/information tool only; not a signal generator and not financial advice.
No performance guarantees. Use with other analysis and risk management.
Calculations update in real time; confirmations happen on closed bars. Detected patterns can change intrabar; use closed‑bar alerts for greater reliability.
Results may vary by symbol, timeframe, liquidity, and volatility.
Cupandhandlepattern

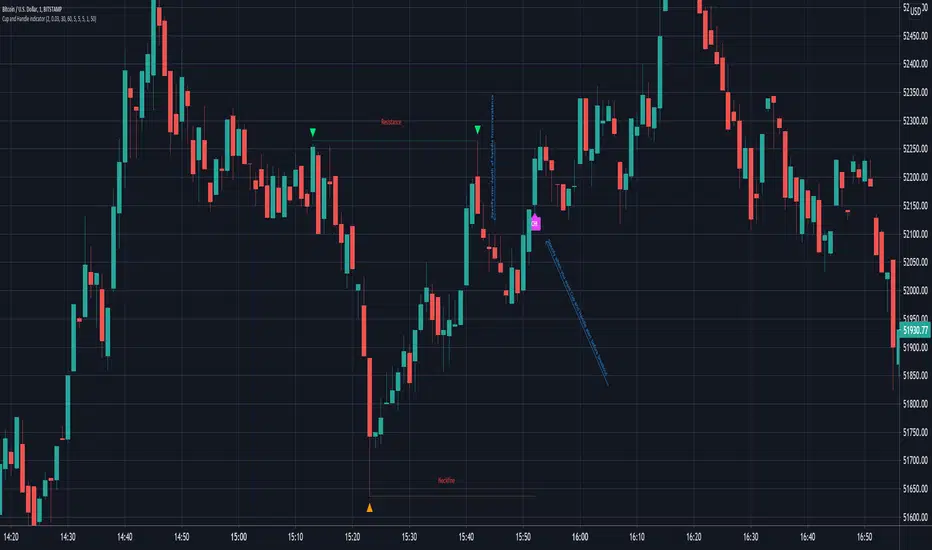
BE-Fib Channel 2 Sided Trading█ Overview:
"BE-Fib Channel 2 Sided Trading" indicator is built with the thought of 2 profound setups named "Cup & Handle (C&H)" and "Fibonacci Channel Trading (FCT)" with the context of "day trading" or with a minimum holding period.
█ Similarities, Day Trading Context & Error Patterns:
While the known fact is that both C&H and FCT provide setups with lesser risk with bigger returns, they both share the similar "Base Pattern".
Note: Inverse of the above Image shall switch the setups between long vs short.
Since the indicator is designed for smaller time-frame candles, there may be instances where the "base pattern" does not visually resemble a Cup & Handle (C&H) pattern. However, patterns are validated using pivot points. The points labeled "A" and "C" can be equal or slightly slanted. Settings of the Indicator allows traders a flexibility to control the angle of these points to spot the strategies according to set conditions. Therefore, understanding the nuances of these patterns is crucial for effective decision-making.
█ 2 Sided Edge: FCT suggests to take trade closer to the yellow line to get better RR ratio. this leaves a small chance of doubt as to; what if price is intended to break the Yellow line thereby activating the C&H.
Wait for the confirmation is a Big FOMO with a compromised RR.
Hence, This indicator is designed to handle both the patterns based on the strength, FIFO and pattern occurring delay.
█ How to Use this Indicator:
Step 1: Enable the Show Sample Sensitivity option to understand the angle of yellow line shown in the sample image. By enabling this option, On the last bar you shall see 4 lines being plotted depicting the max angle which is acceptable for both long and short trades.
Note: Angle can be controlled via setting "Sensitivity".
Higher Sensitivity --> Higher Setup identification --> can lead to failed setups due to 2 sided trading.
Lower Sensitivity --> Lower Setup identification --> can increase the changes of being right.
Step 2: Adjust the look back & look forward periods which shall be used for identifying patterns.
Note: Smaller values can lead to more setups being identified but can hamper the performance of the indicator while increasing the chances of failures. larger values identifies more significant setup but leads to more waiting period thereby compromising on the RR.
Step 3: Adjust the Base Range.
Note: Smaller values can lead to more setups being identified but can hamper the performance of the indicator while increasing the chances of failures. larger values identifies more significant setup but leads to more Risk on play.
Step 4: set the Entry level for FCT & Set the SL for Both FCT & C&H and Target Reward ratio for C&H.
█ Features of Indicator & How it works:
1. Patterns are being identified using Pivot Points method.
2. Tracks & validates both the setups simultaneously on every candle and traded one at a time based on FIFO, New setups found in-between, Defined Entry Levels while on wait for the other pattern to get activated.
3. Alerts added for trade events.
4. FCT setups are generally traded with trailed SL level and increasing Target level on every completed bar. while C&H has the standard SL & TP level with no Trail SL option.
DISCLAIMER: No sharing, copying, reselling, modifying, or any other forms of use are authorized for our documents, script / strategy, and the information published with them. This informational planning script / strategy is strictly for individual use and educational purposes only. This is not financial or investment advice. Investments are always made at your own risk and are based on your personal judgement. I am not responsible for any losses you may incur. Please invest wisely.
Happy to receive suggestions and feedback in order to improve the performance of the indicator better.

Half Cup [LuxAlgo]The Half Cup indicator detects and displays patterns with the shape of a Half Cup , initiating a channel. From this channel, breakouts are detected and highlighted with dots.
Users can control the shape of the Half Cup and the channel length through various settings.
Do note that the displayed half cups are displayed retrospectively, making them subject to backpainting.
🔶 USAGE
The idea behind the indicator is derived from the Cup & Handle pattern, which requires waiting for the pattern full completion.
Our Half Cup publication aims to find opportunities when the potential cup is only formed halfway.
In this example, a green dot shows the first breakout of the upper channel extremity. A few bars later, the price went under it, after which it returned above, triggering a second green dot. Both triggers were good opportunities in this case, and the price rose afterward.
The Half Cup pattern can be the start of a potential complete Cup & Handle (As in the example above, a complete Cup pattern (without the Handle ) is shown, manually drawn with dashed lines).
Every green/red dot, whether on a bullish or bearish pattern, points to a breakout respectively above/below the channel.
Besides drawing patterns and the corresponding breakouts, the Half Cup indicator can also provide insights into trends and potential opportunities in the long run.
🔶 DETAILS
🔹 Validation
Several criteria must be fulfilled before a visible pattern on the chart is drawn.
Calculations are done beforehand to know where the Half Cup pattern would be positioned.
The pattern's bottom and top edges are checked for the number of bars whose closing price is outside the half-cup area. When the number of breakouts above/below is equal to or lower than the user-defined settings ( Max % Breaks Top/Bottom ), the pattern is drawn together with a brighter-colored channel next to it.
Dots highlighting the channel's breakout can be drawn from that moment until the end of both channel lines.
🔹 Positioning
Users can adjust the following settings to fit their needs:
% Broadness: Moves the Top/Bottom line (bullish or bearish) diagonally upwards/downwards.
Vertical Shift: Shifts the entire pattern up/down.
Channel Length: Sets the line length of the channel.
Note that adjusting the position of the pattern will change the validation; the script will be rerun to check if patterns are still valid or if new patterns can be drawn. Some patterns may disappear, while new ones may appear.
Before adjusting the position, the user can set Max % Breaks Top/Bottom at 100%. When the positioning is set, Max % Breaks Top/Bottom can be set as desired.
🔹 Updated Drawings
The Half Cup pattern is always drawn retrospectively (that is it is subject to backpainting), the channel is drawn from the bar from where the pattern is detected. Every breakout of the channel will remain visible as dots.
When a new swing high/low is found while the previous swing low/high remains the same, the pattern is updated to minimize clutter. The dots of earlier drawings will remain visible (to ensure no repainting occurs), but the color becomes faded, as such bright dots are associated with patterns that are visible on the chart, while faded dots are from removed/updated patterns.
🔶 SETTINGS
Swing Length: Period used for the swing detection, with higher values returning longer-term Swing Levels.
🔹 Validation
Max % Breaks Bottom: Allowed maximum amount of bars where the closing price is below the bottom of the Half Cup pattern against the total width of the pattern (bars).
Max % Breaks Top: Allowed maximum amount of bars where the closing price is above the top of the Half Cup pattern against the total width of the pattern (bars).
🔹 Positioning
% Broadness: Moves the Top/Bottom line (bullish or bearish) diagonally upwards/downwards.
Vertical Shift: Shifts the entire pattern up/down.
Channel Length: Sets the line length of the channel.

[TTI] IBD Base Analysis (WEEKLY)📜 ––––HISTORY & CREDITS––––
This indicator, titled " IBD Base Analysis (WEEKLY)," is an original creation by TinTinTrading. It synthesises multiple metrics and visual cues to provide a comprehensive overview of market bases on a weekly timeframe. It is based on the teachings of Investors Business Daily (IBD) and William O'Neil. Mainly from attending all IBD Seminars, Courses and part of man IBD MeetUps. I have compiled most criteria and made it into indicator.
🦄 –––UNIQUENESS–––
What sets this indicator apart is its multi-faceted approach to base analysis. It doesn't just measure base depth or length, or plot a base structure with target (Cup with Handle, Double Bottoms, Flat Bases or other);
The IBD Base Analysis (WEEKLY) allows the user to pick the beginning and end of base and then runs through the criteria for a HEALTHY vs FAULTY Bases. The script is intended for a Weekly timeframe and is base agnostic - hence it can be used on any base pattern you want to analyse. By using the script you will be able to grab a quick visual if there are any faulty characteristics that you have be aware of. Furthermore, its user-friendly interface, complete with customisable color-coding and toggle-able advanced metrics, makes it a great tool for both novice and expert traders to incorporate into their trading.
🛠️ ––––WHAT IT DOES––––
👉 Analysis Table with customisable position. Each cell has additional information when you hover over it with a mouse to show what is required and what is faulty. The cells are color coordinated by user customisable color-coding. If the cell is green then it is bullish. If it is orange then it is soft violating condition and if it is red it is bearish.
Depth: First we look at the Depth of the base expressed in percent
Length: How many weeks long is the base
Number of Weeks under Accumulation (Acc Wks)
Number of Weeks under Distribution (Distrb Wks)
Number of Weeks showing Supporting action
Number of weeks which show wide and loose action (unfavorable), "10% WKs)
Number of weeks we close above the mid point
Grading of the close within the first 3 weeks after bottoming
Counting the Gap ups vs Gap down for the given period
👉 Base plots
+ plot under weeks where we have a tight action compared to previous week - this is considered favorable
▲ plot under down weeks where we show supporting action
⏺ appear under the 3 most important weeks in the base: The Week at the bottom, The week with the Largest Spread and the Week with the Largest Volume. Green means bullish action, Orange means soft violation. The tooltips on the circles show the Closing Range of the week.
- midpoint (in blue), this draws the midpoint within the base.
👉 18 month line - According to IBD the True Market Leaders Breakout and run for on average of 18 months before topping. For this reason I have included a customizable on/off line that plots 18 months back. What I want to see is if the stock has been in a strong uptrend (Stage 2 accumulation for those knowing the Stan Weinstein methodology) for the last18 months. If yes, you ought to consider the base higher risk than one that is just starting its move.
💡 ––––HOW TO USE IT––––
Add the indicator to your chart
Determine the beginning and the end of the base (use the settings in the indicator or drag the verical blue lines)
Read the price action based on the coloring and the criteria explained in the tooltips. Additionally familiarize yourself with the general tips for reading a base below.
💡 ––––GENERAL TIPS FOR READING THE ANALYSIS TABLE––––
Depth: IBD recommends bases to be under 30%. However, during a strong bear market some stocks can exhibit 1.5-2x the volatility. Yet, it is key within the IBD methodology to buy breakouts from proper Non-deep bases
Length: Many newer traders misinterpret small patterns for bases. This common misunderstanding is addressed by calculating the length of the base and determining if it is developed or immature.
Number of Weeks under Accumulation (Acc Wks): This is the first thing the late Market Wizard William O'neill looks into the base. How many weeks are showing signs of accumualtion and how many are showing signs of distribution (the cell below). Always look for Accumulation weeks to be more than distribution weeks.
Number of Weeks under Distribution (Dist Wks): See above
Number of Weeks showing Supporting action: New traders determine down week as bearish. However, within the methodology and extensive research IBD has given criteria of down weeks that are actually a bullish sign. Counting the number of weeks within the base that meet this criteria gives us this metric.
Number of weeks which show wide and loose action: If the base is not compact but it is wide and loose it is considered an unfavorable pattern. Generally, occurs within Stage 3 of a stock topping.
Wks > Mid: Utilizes a simple 'hack' of base reading. How many weeks have closed above the mid level of the base and how many have closed below the mid level of the base.
Grading of the close within the first 3 weeks of the bottom: The next cell looks at the price action subsequent of the 3 weeks after the bottom. These are very important as they show if accumulation is happening (strengthening the breakout hypothesis) or if it is not.
Counting the Gap ups vs Gap down for the given period: Lastly gaps are key footprint of institutional moves. We look for the number of DAILY gaps on the WEEKLY timeframe and compare the daily gap up vs the daily gap downs within the base.
REMEMBER, ALL TRADING INCLUDES RISK. NEVER RELY SOLELY ON A SINGLE INDICATOR. INCORPORATE IT INTO YOUR BROADER TRADING METHODOLOGY AS A COMPLEMENTING SOURCE OF INFORMATION.

Cup and Handle chart patternThis script identifies chart patterns: Cup and Handle. At the same time, it identifies not only these classical patterns, but even a wider range of similar reverse figures .
It has many useful settings:
-- You can choose by which pivots you want to identify patterns - by the edges of wicks (tails, shadows), or by the edges of candle bodies.
-- You can set the minimum number of pivot points that the pattern must contain.
-- You can also set the minimum depth of the shapes. It is important for successful trading.
-- !!! Most importantly, I have added a very useful functionality for those who trade based on chart patterns. Unlike my previous scripts which only identified patterns, in this one I've added the functionality to filter out patterns that I think appear in the wrong places . It is the base level filter. It filters out many, but not all, patterns in inappropriate places. If you want to order the development of such functionality with great opportunities - please contact me.
-- In addition, you can set how "flat" relative to the horizon the identified patterns should be .
You can also customize your styles.
! All key settings are accompanied by detailed tooltips

Pivot Pattern Boundaries [cajole]
This script automatically detects horizontal support / resistance levels based on user-programmable criteria.
For example, you can detect boundaries with >3 touches within 200 days, allowing a tolerance of 1/4*ATR.
"Touches" are defined from pivots on the chart. The best way to search for larger/smaller patterns is to increase/decrease the pivot size.*
Future versions will allow "exceptions (i.e. keep drawing the horizontal line even if it is breached once or twice).
*TradingView's Pine script defines a Pivot as the highest point in a group. So, entering "2" means that a day's high needs to be above 2 days before and after (xxYxx) to be considered a high pivot.
This script can be an aid in drawing multiple patterns with horizontal boundaries (rectangles, triangles, head and shoulders, cup & handles, VCPs). I have intentionally avoided trying to code detection of the "other side" of these patterns, as that is where the craft of charting becomes an art.

Cup & HandleHi, here is my take on 'Cup & Handle'
Pivot Points - ph (highest points in a certain period) are stored in an array
When there is a new ph , previous ph's are compared to the latest one.
A temporary test line is drawn between these 2 points.
The script checks if a close (between these 2 points) doesn't break above this test line.
(test line is deleted afterwards)
If it doesn't, and the '% max breaks' are not breached, 2 circle shaped lines are drawn
(Top & Bottom line of the cup) which forms the Cup, together with the Handle.
The red box (Handle) is the maximum 33-50% retracement (% of cup height)
-> Only the latest pattern is shown, enabling 'Show Cup labels' shows the position of cup patterns in history.
They can be visualised by using 'Bar Replay'
'% max breaks' -> 'maximum highs/lows breaking through the Top/Bottom line
(% of bars between left & right extreme points of the Cup)
Settings:
- 'Left', 'Right' -> regulates Pivot Point values
- 'PP back' -> max lookback for Pivot High
More explanation can be found in following print screens,
or by checking the tooltips in the settings
Cheers!

Cup and Handle IndicatorThis is a Cup and Handle Indicator. Features include:
Can set alert at any point after handle starts rising before breakout
Can detect multiple tops before confirming cup and handle pattern, not just double.
Many settings to adjust to meet your exact requirements
The functionality of this indicator is very similar to my double top indicator , and inherits majority of the settings/inputs. Please try that indicator before using this one.
From Wikipedia: In the domain of technical analysis of market prices, a cup and handle or cup with handle formation is a chart pattern consisting of a drop in the price and a rise back up to the original value, followed first by a smaller drop and then a rise past the previous peak. It is interpreted as an indication of bullish sentiment in the market and possible further price increases.
The cup part of the pattern should be fairly shallow, with a rounded or flat "bottom" (not a V-shaped one), and ideally reach to the same price at the upper end of both sides. The drop of the handle part should retrace about 30% to 50% of the rise at the end of the cup. For stock prices, the pattern may span from a few weeks to a few years; but commonly the cup lasts from 1 to 6 months, while the handle should only last for 1 to 4 weeks.
The "cup and handle" formation was defined by William O'Neil"
Key settings to note compared to my double top indicator are highlighted in following image
PM me to obtain access
Best regards.