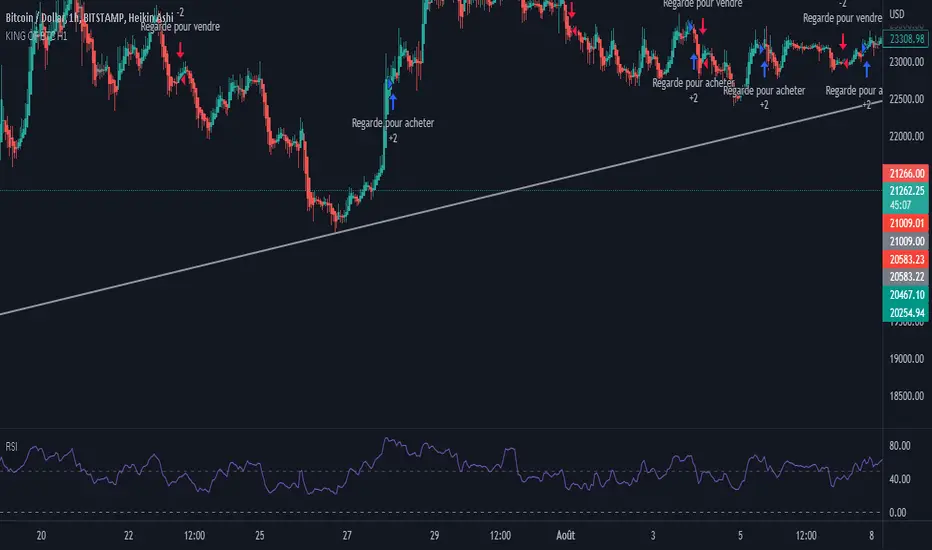
Ultimate Bitcoin StrategyThis is my masterpiece.
I recommend using it following strict rules:
Buy = Wait for the next green Heikein Ashi candle and RSI above 50
Sell: Wait for the next red Heikein Ashi candle and RSI below 50
Use it in H1
Enjoy.
가상화폐
Short Term RSI and SMA Percentage ChangeThis strategy utilises common indicators like RSI and moving averages in order to enter and exit trades. The Relative Strength Index (RSI) is a momentum indicator that has a value between 0 and 100, where a value greater than 70 is considered overbought and a value less than 30 is oversold. If the RSI value is above or below these values, then it can signal a possible trend reversal.
The second indicator used in this strategy is the Simple Moving Average (SMA). A SMA is an arithmetic moving average calculated by adding recent prices and then dividing that figure by the number of time periods in the calculation average. For example, one could add the closing price of a coin for a number of time periods and then divide this total by that same number of periods. Short-term averages respond quickly to changes in the price of the underlying coin, while long-term averages are slower to react.
Long/Exit orders are placed when three basic signals are triggered.
Long Position:
RSI is greater than 50
MA9 is greater than MA100
MA9 increases by 6%
Exit Position:
Price increases 5% trailing
Price decreases 5% trailing
The script is backtested from 1 May 2022 and provides good returns.
A trading fee of 0.1% is also taken into account and is aligned to the base fee applied on Binance.
This script also works well on AVAX 45m/1h, MATIC 15m/45m/1h and ETH 4h.

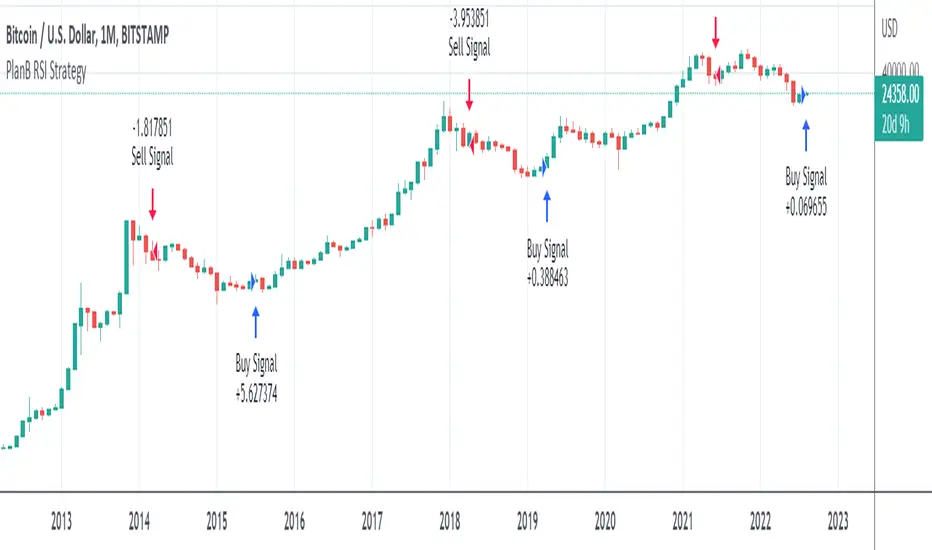
PlanB Quant Investing 101 v2This script has been Inspired by PlanB Article Quant Investing 101.
With this script, I implemented Plan B strategy outlined in that article, trying to reproduce his findings independently and allowing TradeView Users to do the same.
PlabB is aware of this effort, and he's positive about it, via Twitter commenting, liking and sharing of this resource .
Trading Idea:
This script uses RSI index to determine the Buy And Sell signal.
As per the original PlanB article:
IF ( RSI was above 90% last six months AND drops below 65%) THEN sell,
IF ( RSI was below 50% last six months AND jumps +2% from the low) THEN buy, ELSE hold
My simple code is aimed at replicating his study in Pine so that every TV user can check his signal.
Trade HourThis script is just finds the best hour to buy and sell hour in a day by checking chart movements in past
For example if the red line is on the 0.63 on BTC/USDT chart it mean the start of 12AM hour on a day is the best hour to buy (all based on
It's just for 1 hour time-frame but you can test it on other charts.
IMPORTANT: You can change time Zone in strategy settings.to get the real hours as your location timezone
IMPORTANT: Its for now just for BTC/USDT but you can optimize and test for other charts...
IMPORTANT: A green and red background color calculated for show the user the best places of buy and sell (green : positive signal, red: negative signals)
settings :
timezone : We choice a time frame for our indicator as our geo location
source : A source to calculate rate of change for it
Time Period : Time period of ROC indicator
About Calculations:
1- We first get a plot that just showing the present hour as a zigzag plot
2- So we use an indicator ( Rate of change ) to calculate chart movements as positive and negative numbers. I tested ROC is the best indicator but you can test close-open or real indicator or etc as indicator.
3 - for observe effects of all previous data we should indicator_cum that just a full sum of indicator values.
4- now we need to split this effects to hours and find out which hour is the best place to buy and which is the best for sell. Ok we should just calculate multiple of hour*indicator and get complete sum of it so:
5- we will divide this number to indicator_cum : (indicator_mul_hour_cum) / indicator_cum
6- Now we have the best hour to buy! and for best sell we should just reverse the ROC indicator and recalculate the best hour for it!
7- A green and red background color calculated for show the user the best places of buy and sell that dynamically changing with observing green and red plots(green : positive signal, red: negative signals) when green plot on 15 so each day on hour 15 the background of strategy indicator will change to 15 and if its go upper after some days and reached to 16 the background green color will move to 16 dynamically.

VIDYA Trend StrategyOne of the most common messages I get is people reaching out asking for quantitative strategies that trade cryptocurrency. This has compelled me to write this script and article, to help provide a quantitative/technical perspective on why I believe most strategies people write for crypto fail catastrophically, and how one might build measures within their strategies that help reduce the risk of that happening. For those that don't trade crypto, know that these approaches are applicable to any market.
I will start off by qualifying up that I mainly trade stocks and ETFs, and I believe that if you trade crypto, you should only be playing with money you are okay with losing. Most published crypto strategies I have seen "work" when the market is going up, and fail catastrophically when it is not. There are far more people trying to sell you a strategy than there are people providing 5-10+ year backtest results on their strategies, with slippage and commissions included, showing how they generated alpha and beat buy/hold. I understand that this community has some really talented people that can create some really awesome things, but I am saying that the vast majority of what you find on the internet will not be strategies that create alpha over the long term.
So, why do so many of these strategies fail?
There is an assumption many people make that cryptocurrency will act just like stocks and ETFs, and it does not. ETF returns have more of a Gaussian probability distribution. Because of this, ETFs have a short term mean reverting behavior that can be capitalized on consistently. Many technical indicators are built to take advantage of this on the equities market. Many people apply them to crypto. Many of those people are drawn down 60-70% right now while there are mean reversion strategies up YTD on equities, even though the equities market is down. Crypto has many more "tail events" that occur 3-4+ standard deviations from the mean.
There is a correlation in many equities and ETF markets for how long an asset continues to do well when it is currently doing well. This is known as momentum, and that correlation and time-horizon is different for different assets. Many technical indicators are built based on this behavior, and then people apply them to cryptocurrency with little risk management assuming they behave the same and and on the same time horizon, without pulling in the statistics to verify if that is actually the case. They do not.
People do not take into account the brokerage commissions and slippage. Brokerage commissions are particularly high with cryptocurrency. The irony here isn't lost to me. When you factor in trading costs, it blows up most short-term trading strategies that might otherwise look profitable.
There is an assumption that it will "always come back" and that you "HODL" through the crash and "buy more." This is why Three Arrows Capital, a $10 billion dollar crypto hedge fund is now in bankruptcy, and no one can find the owners. This is also why many that trade crypto are drawn down 60-70% right now. There are bad risk practices in place, like thinking the martingale gambling strategy is the same as dollar cost averaging while also using those terms interchangeably. They are not the same. The 1st will blow up your trade account, and the 2nd will reduce timing risk. Many people are systematically blowing up their trade accounts/strategies by using martingale and calling it dollar cost averaging. The more risk you are exposing yourself too, the more important your risk management strategy is.
There is an odd assumption some have that you can buy anything and win with technical/quantitative analysis. Technical analysis does not tell you what you should buy, it just tells you when. If you are running a strategy that is going long on an asset that lost 80% of its value in the last year, then your strategy is probably down. That same strategy might be up on a different asset. One might consider a different methodology on choosing assets to trade.
Lastly, most strategies are over-fit, or curve-fit. The more complicated and more parameters/settings you have in your model, the more likely it is just fit to historical data and will not perform similar in live trading. This is one of the reasons why I like simple models with few parameters. They are less likely to be over-fit to historical data. If the strategy only works with 1 set of parameters, and there isn't a range of parameters around it that create alpha, then your strategy is over-fit and is probably not suitable for live trading.
So, what can I do about all of this!?
I created the VIDYA Trend Strategy to provide an example of how one might create a basic model with a basic risk management strategy that might generate long term alpha on a volatile asset, like cryptocurrency. This is one (of many) risk management strategies that can reduce the volatility of your returns when trading any asset. I chose the Variable Index Dynamic Average (VIDYA) for this example because it's calculation filters out some market noise by taking into account the volatility of the underlying asset. I chose a trend following strategy because regressions are capturing behaviors that are not just specific to the equities market.
The more volatile an asset, the more you have to back-off the short term price movement to effectively trend-follow it. Otherwise, you are constantly buying into short term trends that don't represent the trend of the asset, then they reverse and loose money. This is why I am applying a trend following strategy to a 4 hour chart and not a 4 minute chart. It is also important to note that following these long term trends on a volatile asset exposes you to additional risk. So, how might one mitigate some of that risk?
One of the ways of reducing timing risk is scaling into a trade. This is different from "doubling down" or "trippling down." It is really a basic application of dollar cost averaging to reduce timing risk, although DCA would typically happen over a longer time period. If it is really a trend you are following, it will probably still be a trend tomorrow. Trend following strategies have lower win rates because the beginning of a trend often reverses. The more volatile the asset, the more likely that is to happen. However, we can reduce risk of buying into a reversal by slowly scaling into the trend with a small % of equity per trade.
Our example "VIDYA Trend Strategy" executes this by looking at a medium-term, volatility adjusted trend on a 4 hour chart. The script scales into it with 4% of the account equity every 4-hours that the trend is still up. This means you become fully invested after 25 trades/bars. It also means that early in the trade, when you might be more likely to experience a reversal, most of your account equity is not invested and those losses are much smaller. The script sells 100% of the position when it detects a trend reversal. The slower you scale into a trade, the less volatile your equity curve will be. This model also includes slippage and commissions that you can adjust under the "settings" menu.
This fundamental concept of reducing timing risk by scaling into a trade can be applied to any market.
Disclaimer: This is not financial advice. Open-source scripts I publish in the community are largely meant to spark ideas that can be used as building blocks for part of a more robust trade management strategy. If you would like to implement a version of any script, I would recommend making significant additions/modifications to the strategy & risk management functions. If you don’t know how to program in Pine, then hire a Pine-coder. We can help!

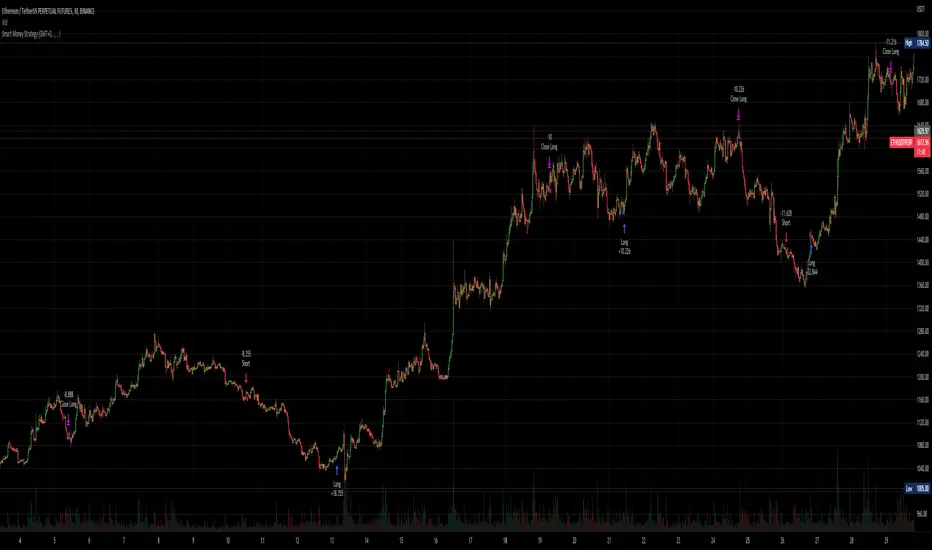
Smart Money - Oscillator and Volume StrategyOverview
This is a no-repaint strategy that is highly optimized for BINANCE:ETHUSDTPERP 30m, normal candles. It is a long/short strategy that is based on CMF, ADX/DMI, Keltner Channels, and other oscillators to identify smart money.
The overall idea of the strategy is to effectively capture the beginnings and ends of trends in price action, and go long/short accordingly. To achieve this, potential entry points are identified with various oscillators and these are then filtered using a variety of moving averages and strength/momentum indicators.
Short and sell inflections are found when ADX, DMI, and/or CMF oscillate below a specified threshold, and Keltner Channels are also used to indicate potential trades.
The indicator will continue to be updated and optimized for current and future market conditions.
If purchased, access to the indicator will be available within 24 hours.
Backtest Results
Parameters:
- 2021-01-01 to present (19 months)
- 100% equity order size
- 0.04% commission fees
- No leverage
17,089% net profit through 296 trades with 60.47% of trades being profitable.
Profit factor of 2.862, Sharpe Ratio of 1.158
Parameters:
- 2021-01-01 to present (19 months)
- $1,000 initial capital
- $1,000 order size
- 0.04% commission fees
- No leverage
584% net profit through 296 trades with 60.47% of trades being profitable.
Parameters:
- 2021-01-01 to present (19 months)
- 500% equity order size
- 0.04% commission fees
- 5x leverage
8,587,557% net profit through 299 trades with 59.87% of trades being profitable.
Bot MasterSqueeze 1.1 (crypt)Countertrend strategy for correction to the average value. The strategy is designed primarily for crypto.
The principle of operation is that with a rapid price change, the strategy tends to take a reverse position to return to the average value, which statistically often happens. It is enough for you to determine the percentage of the offset about the average price and the size of the averaging position as a percentage of the deposit.
With the settings, you determine how to determine the average opening price. It can be MA at the price of opening, closing, etc., and DCMA. Soon I will add a few more options for determining the average opening price
You can also choose the average price at which the transaction will try to close.
Now there are 3 methods:
- closing when returning to the average price
- closing on the first correction candle
- opening on an abnormally large candle in the direction of correction and closing on the first one is opposite
Search for the settings by the selection method for each pair separately. It is better to trade using signals via a bot.
The strategy shows itself best on volatile coins paired with the dollar for 1 hour or more.
Soon I will add new options for opening and closing deals, as well as determining the average price.
ATTENTION: the strategy involves averaging, so be careful with levers and overestimating the percentage of the transaction from the deposit. It is best to allocate no more than 25 percent to the risk of the transaction.

MZ HTF HFT ROCit Bot - Non Repainting Scalper v1.2 ADX RSI MOM This is a new iteration based on my Momentum trading bot.
This is an original script meant to be a high frequency trader that works on higher time frame calculations.
I came up with the idea that using calculus I can figure out the actual rate of change and momentum with different calculations than the momentum indicator that is provided by trading view. Once momentum is shifted on a small time frame, it will provide an entry signal. The script is meant to be used on an algorithmic trading system for scalping purposes. It should be run on a one minute time frame. Unfortunately due to various plotting constraints in Pinescript, you cannot plot the rate of change and momentum and price in the same pane. To counter this, I have a showdata toggle to give you values of the indicators at each entry.
This version has two main entry settings toggled with a checkbox. There is the ROC (rate of change) version and the MOM (momentum) entry signals.
The rate of change version is meant to take a look at your moving average and try to trigger when it hits a certain rate of change point. This can be helpful if you rather play it safer. I have noticed that you can get slightly better entry points but also does not give you as many entries. The momentum algorithm will give you faster entry points and might work best with a slight offset (use your back test to help you figure it out).
I have started to add tooltips to help you along. If you have suggestions please let me know.
How does it work?
Let's just assume that you are looking at a one minute chart. I recommend using the one minute for bots because it will give you the fastest execution for entries. Pinescript has an issue where the signal is not usually sent until the end of the bar/beginning of next bar. If the signal was triggered at the beginning of a 15 minute bar, it might not actually send the signal until the following 15 minute bar. If you are trading on small time frames, this can make all the difference. If you are using an algo platform that trailing stops, stop losse, take profits, etc. I would recommend you use that platform to close your trade. The close trade message will work, but pinescript does not know the exact entry price you received, so if you are trying to collect small profits, it is best that intermediary platform does that calculation for you. If you are dealing with larger moves, instead of small 1-3% scalps, you are probably fine to use the close message setting from pinescript.
Ok, so to take an example. I like to use the 3L and 3S tokens on Kucoin. This gives you a lot of volatility to work with compared to other tokens and coins. However, it can also meas that you are likely taking a higher risk. However, there are some things that can help with that (more on that later).
So we have a token we want to run, and have it on the 1m chart.
First, be sure that all of your filters are OFF when you start playing with the back test. This allows you to see how to best optimize the bot.
Use the show data to show you additional data when you are backtesting. This can allow you to try to filter out results or market conditions that do not work. I typically work with the RSI and use the 30 minute and 15 minute RSIs. I make sure that it is trading within a certain band - about 40-75. You can try the inverse and only buy during really low RSI's as well.
www.dropbox.com
Find the source of your data with the variant drop down. You can use any time frame, open, close. high, low, olc4. Open is pretty much guaranteed to not have any repainting issues - although all the other calcs use a custom isbarconfirmed security repaint calculation. I have been finding that Open and SMA work well, but feel free to explore. If you use a source like open, close, high, low, etc - the interval will not change anything further. If you use a variant such as an sma, you should try to find an interval that works well for that token. For instance, try an sma of 8-11 minutes and see which gives you the best backtest result without changing anything else. Offset ALMA/LSMA parameters are only used for those specific variants. These specific parameters will also affect the ALMA and LSMA if you use that variant in the trend filter. In other words, you can skip these if you are not using those types of moving averages.
www.dropbox.com
Configure the ROC and MOM intervals. If you are using a source such as open, close, etc- this is where you set the interval for your change. So consider using OHLC4 or a interval of 5 thru 15 and see what works best. The Momentum inverval usually works best in the 2-5 bars. There is a custom calculation I added in to try to filter out false entries as momentum is waning. This calculation works best in 2-5 bar interval.
Configure the trigger point and offset. If you are using rate of change, the best settings will likely be between -1 to 0.5. If you are using momentum, you will likely want -20 to 10. This is where you will notice the entries will shift a bit. Try to find a balance between your backtest settings and actually finding what you thin will be the best entries based on a slight delay from trading view, to algo, to your trading platform. This can likely be a minute (maybe even) or so- so be sure to not get too caught up between the backtest results and be sure to finesse the entries to actually fit nicely - maybe a bar earlier than you would likely think. If your entries are coming in too early, you can use the offset to delay your entry by a few bars. This is both science and an art form- don't get too caught up on the back test results as that is based on having all the data tha already transpired, it's not based on how it will actually perform during deployment.
Take profit and stop loss. This should be self explanatory. This script can toggle between static take profit and a trailing profit. For scalping, you will likely want to limit it below 2% to get a good win ratio. Stop loss should be at least 5-6% for these types of 3L/3S tokens to give the strategy some room to move (if the token goes down 2% before it shoots back up, the price will go down 6%). This does not yield the best R/R ratio from a traditional trader perspective, but the statistical probabilities are in your favor for these events will happen. If you have better ideas for how to set this all up, feel free to contribute your ideas in the comments as we can all learn from each other. You can definitely set a much tighter stop loss with a larger take profit to get a lower win rate but in turn might get much better returns. It's all up to you.
FILTERS www.dropbox.com
These filters require you to know a bit about each indicator and how you want to use them. I will only go over the general idea.
Variant Filter - this is especially useful if you want to trade above a moving average. Say for instance you only want to take trades when we are over the 100 Day moving average. Or above a 30 minute, 30 bar EMA, etc. Although originally ported over from my other scripts, this is not a filter that I use often in conjunction with this script.
RSI - perhaps you want to buy when we are below the 30 line on the 30 minute RSI, or we want only want to have the strategy work when we are above the 50 RSI, this can all be configured here. I typically like to try a few different rationales here.
Now with brand NEW ADX filter - this is a brand new idea that seems to work rather well. Based on your ADX settings you can also turn on the "only uptrend" which will try to calculate if you are in an uptrend based on your ADX config. Please keep in mind that uptrend is based relatively on the ADX settings.
- There is a sprinkle of RSI magic in the entry signal to make sure that rsi is not declining in the calculation, so this can affect how many entries you get.
Some other tips:
Forward test.
Set up your algo bot on a one minute interval.
Set up take profit and stop loss on your algo trading platform.
Don't use the exact settings as your backtest, maybe try a slightly more conservative approach from the algo trading platform to make sure you are within range of triggering your events with a slight delay from signal to execution. If you have a 1.6% take profit, perhaps try 1.5% on your platform first.
By using these scripts you agree that you are trading at your own risk. I make no guarantees of returns or results. I just provide tools to help you trade better. However, I hope this ROCit will take you to the moon. And if it does, be sure to give me a shout as well as some tips of your own.
Send me a message with any questions or suggestions.

Rate Of Change Trend Strategy (ROC)This is very simple trend following or momentum strategy. If the price change over the past number of bars is positive, we buy. If the price change over the past number of bars is negative, we sell. This is surprisingly robust, simple, and effective especially on trendy markets such as cryptos.
Works for many markets such as:
INDEX:BTCUSD
INDEX:ETHUSD
SP:SPX
NASDAQ:NDX
NASDAQ:TSLA

Nabz-BBMACD-2022-V1.1I have tried to make script which triggers indicators on combination of different feedback including Bollinger bands and MACD. Also used some of my logic by trial and error, It gave 744%+ profit on back-testing on coin RUNE/USDT from Jan 2021. It is my first script, I am happy to help the community. Please share your feedback.

Oversold RSI with tight SL Strategy (by Coinrule)This is one of the best strategies that can be used to get familiar with technical indicators and start to include them in your trading bot rules.
ENTRY
1. This trading system uses the RSI ( Relative Strength Index ) to anticipate good points to enter positions. RSI is a technical indicator frequently used in trading. It works by measuring the speed and change of price movements to determine whether a coin is oversold (indicating a good entry point) or overbought (indicating a point of exit/entry for a short position). The RSI oscillates between 0 and 100 and is traditionally considered overbought when over 70 and oversold when below 30.
2. To pick the right moment to buy, the strategy enters a trade when the RSI falls below 30 indicating the coin is oversold and primed for a trend reversal.
EXIT
The strategy then exits the position when the price appreciates 7% from the point of entry. The position also maintains a tight stop-loss and closes the position if the price depreciates 1% from the entry price. The idea behind this is to cut your losing trades fast and let your winners ride.
The best time frame for this strategy based on our backtesting data is the daily. Shorter time frames can also work well on certain coins, however in our experience, the daily works best. Feel free to experiment with this script and test it on a variety of your coins! With our backtesting data a trading fee of 0.1% is taken into account. The fee is aligned to the base fee applied on Binance, which is the largest cryptocurrency exchange by volume. In the example shown, this strategy made a handsome net profit of 39.31% on Chainlink with 61.54% of trades being profitable.

Sideways Strategy DMI + Bollinger Bands (by Coinrule)Markets don’t always trade in a clear direction. At a closer look, most of the time, they move sideways. Relying on trend-following strategies all the time can thus lead to repeated false signals in such conditions.
However, before you can safely trade sideways, you have to identify the most suitable market conditions.
The main features of such strategies are:
Short-term trades, with quick entries and quick exits
Slightly contrarian and mean-reversionary
Require some indicator that tells you it’s a sideways market
This Sideways DMI + Bollinger Bands strategy incorporates such features to bring you a profitable alternative when the regular trend-following systems stop working.
ENTRY
1. The trading system requires confirmation for a sideways market from the Directional Movement Index (DMI) before you can start opening any trades. For this purpose, the strategy uses the absolute difference between positive and negative DMI, which must be lower than 20.
2. To pick the right moment to buy, the strategy looks at the Bollinger Bands (BB). It enters the trade when the price crosses over the lower BB.
EXIT
The strategy then exits when the move has been exhausted. Generally, in sideways markets, the price should revert lower. The position is closed when the price crosses back down below the upper BB.
The best time frame for this strategy based on our backtest is the 1-hr. Shorter timeframes can also work well on certain coins that are more volatile and trade sideways more often. However, as expected, these exhibit larger volatility in their returns. In general, this approach suits medium timeframes. A trading fee of 0.1% is taken into account. The fee is aligned to the base fee applied on Binance, which is the largest cryptocurrency exchange.

Three EMAs Trend-following Strategy (by Coinrule)Trend-following strategies are great because they give you the peace of mind that you're trading in line with the market.
However, by definition, you're always following. That means you're always a bit later than your want to be. The main challenges such strategies face are:
Confirming that there is a trend
Following the trend, hopefully, early enough to catch the majority of the move
Hopping off the trade when it seems to have run its course
This EMA Trend-following strategy attempts to address such challenges while allowing for a dynamic stop loss.
ENTRY
The trading system requires three crossovers on the same candle to confirm that a new trend is beginning:
Price crossing over EMA 7
Price crossing over EMA 14
Price crossing over EMA 21
The first benefit of using all three crossovers is to reduce false signals. The second benefit is that you know that a strong trend is likely to develop relatively soon, with the help of the fast setup of the three EMAs.
EXIT
The strategy comes with a fixed take profit and a volatility stop, which acts as a trailing stop to adapt to the trend's strength. That helps you get out of the way as soon as market conditions change. Depending on your long-term confidence in the asset, you can edit the fixed take profit to be more conservative or aggressive.
The position is closed when:
The price increases by 4%
The price crosses below the volatility stop.
The best time frame for this strategy based on our backtest is the 4-hr. Shorter timeframes can also work well, although they exhibit larger volatility in their returns. In general, this approach suits medium timeframes. A trading fee of 0.1% is taken into account. The fee is aligned to the base fee applied on Binance, which is the largest cryptocurrency exchange.

Optimised RSI strategy for Reversals (by Coinrule)The most common way to use the RSI to spot a good buy opportunity is to check for values lower than 30. Unfortunately, the RSI can remain in oversold territory for long periods, and that could leave you trapped in a trade in loss. It would be appropriate to wait for a confirmation of the trend reversal.
In the example above I use a short-term Moving Average (in this case, the MA9) coupled with an RSI lower than 40. This combination of events is relatively rare as reversal confirmations usually come when RSI values are already higher. As unusual as this setup is, it provides buy-opportunities with much higher chances of success.
The parameters of this strategy would be:
ENTRY: RSI lower than 40 and MA9 lower than the price
TAKE PROFIT and STOP-LOSS with a ratio of at least 2. That means that if you set up a take profit of 3%, your stop-loss shouldn’t be larger than 1.5%.
The advantage of this approach is that it has a high rate of success and allows you the flexibility of setting up the percentages of the take profit and stop-loss according to your preferences and risk appetite.

Fukuiz Octa-EMA + Ichimoku (Strategy)This strategy is based EMA of 8 different period and Ichimoku Cloud which works better in 1hr 4hr and daily time frame.
#A brief introduction to Ichimoku #
The Ichimoku Cloud is a collection of technical indicators that show support and resistance levels, as well as momentum and trend direction. It does this by taking multiple averages and plotting them on a chart. It also uses these figures to compute a “cloud” that attempts to forecast where the price may find support or resistance in the future.
#A brief introduction to EMA#
An exponential moving average ( EMA ) is a type of moving average (MA) that places a greater weight and significance on the most recent data points. The exponential moving average is also referred to as the exponentially weighted moving average . An exponentially weighted moving average reacts more significantly to recent price changes than a simple moving average ( SMA ), which applies an equal weight to all observations in the period.
#How to use#
The strategy will give entry points itself, you can monitor and take profit manually(recommended), or you can use the exit setup.
EMA (Color) = Bullish trend
EMA (Gray) = Bearish trend
#Condition#
Buy = All Ema (color) above the cloud.
SELL= All Ema turn to gray color.

Oversold RSI with Tight Stop-Loss Strategy (by Coinrule)KRAKEN:LINKUSD
This is one of the best strategies that can be used to get familiar with technical indicators and start to include them in your rules on Coinrule .
ENTRY
1. This trading system uses the RSI (Relative Strength Index) to anticipate good points to enter positions. RSI is a technical indicator frequently used in trading. It works by measuring the speed and change of price movements to determine whether a coin is oversold (indicating a good entry point) or overbought (indicating a point of exit/entry for a short position). The RSI oscillates between 0 and 100 and is traditionally considered overbought when over 70 and oversold when below 30.
2. To pick the right moment to buy, the strategy enters a trade when the RSI falls below 30 indicating the coin is oversold and primed for a trend reversal.
EXIT
The strategy then exits the position when the price appreciates 7% from the point of entry. The position also maintains a tight stop-loss and closes the position if the price depreciates 1% from the entry price. The idea behind this is to cut your losing trades fast and let your winners ride.
The best time frame for this strategy based on our back testing data is the daily. Shorter time frames can also work well on certain coins, however in our experience, the daily works best. Feel free to experiment with this script and test it on a variety of your coins! With our back testing data a trading fee of 0.1% is taken into account. The fee is aligned to the base fee applied on Binance, which is the largest cryptocurrency exchange by volume. In the example shown, this strategy made a handsome net profit of 52.6% on Chainlink with 66.67% of trades being profitable.
You can execute this strategy on your favorite exchanges with Coinrule .

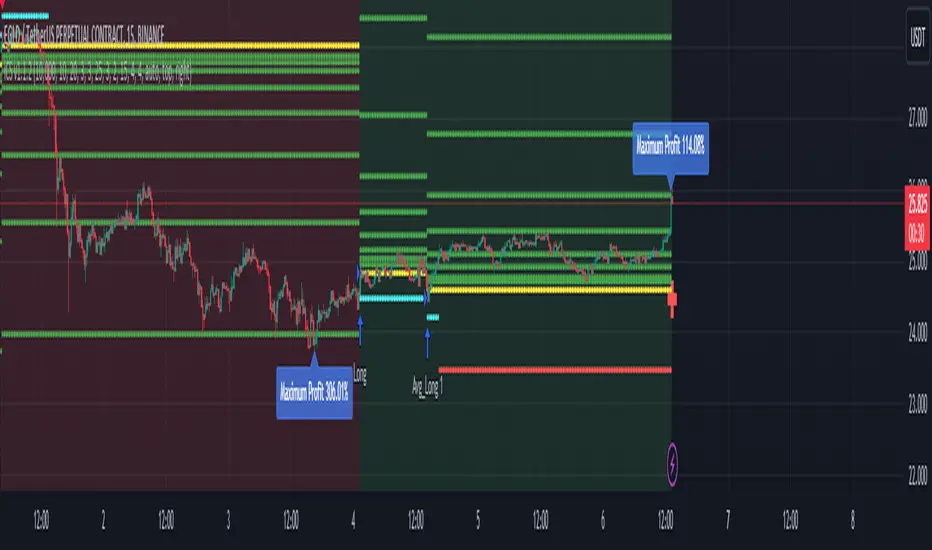
iCryptoScalperHi everyone!
In this post I would like to present my personal indicator for short-term strategies on cryptocurrencies called iCryptoScalper , but let me first introduce myself:
I am a theoretical physicist with a deep passion for trading and mathematical modelling of the financial markets.
I started trading cryptocurrencies more than 4 years ago and, throughout this period, I got more and more involved in trying to describe the mechanisms governing
the price action at lower timeframes like 1, 5 and 15 minutes.
As a beginner, I started with the usual "buy and hold" strategy, the safest but also boring option. Afterthat, I tried to get more involved on speed trading
and scalping and, as it happens to all the beginners, I went through many mistakes.
At the beginning, trying to find the best scalping strategy, was a very difficult task and I barely managed to perform well, mostly because every trade were overwhelmed
by my emotional approach and the fear of missing the right entry point and/or exit point. However, thanks to these difficulties, I understood that I needed
an algorithmic procedure to improve my performances and overtake the emotional approach, with a more technical approach: a mathematical guide that precisely tells me how to behave in the best way possible to be profitable.
To achieve this goal, I put all my efforts in trying to write a consistent mathematical model able to give me all the statistical informations I needed to reach
the best performances and, of course, the best possible profits.
The iCryptoScalper is an explicit mathematical tool to be used for scalping strategies and optimized for different cryptocurrency pairs on 15/30 min timeframes.
The script gives you many useful informations and details regarding the current and subsequent trade, accompanied with a detailed overview on both the last 20 short
and long trade results.
Let us have a look to all the detailed informations the script shows to you:
CHART
- Lines: The script plots for you the Entry price (yellow line), the Stop Loss price (red line) and a series of 8 Take Profit levels (green lines).
- Background: The green background color indicates that the script is in a long position, viceversa, the red background color indicates that the script is in a short position.
- Labels: The blue labels indicate the maximum achieved profit for each trade.
- Alerts: The script shows two types of alerts, the "prepare to #" one and the true entry one. The prepare alert is very useful to understand when the strategy is going
to enter a specific trade, thus giving you the possibility to set up all the necessary Entry/SL/TP levels on your favorite trading platform.
- Crosses: The green and red crosses are precisely located at the corresponding long and short entry price for the next trade, thus giving you a preview on the target price
that has to be reached for the indicator to enter. They are computed thanks to a mathematical model I set up and optimized for each cryptocurrency pair.
PANEL
- Overview: This part shows you two probability tables for the last 20 long and short trades each. The first table indicates the set of probabilities of reaching the corresponding TP level, whereas the second table shows the conditional probability , namely the probability of reaching a certain profit level once the previous one has been achieved.
Below the tables you can find three quantities again referring to the last 20 long and short trades: the Average Maximum Profit , the Average Maximum Drawdown and the Average Risk/Reward Ratio .
Last but not least, the correlation between the current asset and BTC is displayed together with the current BTC status.
- Active Trade: This part collects all the data related to the current trade status.
- Next Trade: This part collects all the data related to the next trade status.
ATTENTION!
Please notice that the equity line you see in the "Strategy Tester" section of TradingView is unreliable compared to the real performances of the script. This is due to the
fact that the TradingView engine is designed for backtesting automatic trading strategies and not real-time trading bots.
An example is the following: Bob buys 1 BTC-PERP contract at 10000$, setting the Stop Loss at 9000$. The price of the perpetual then goes to 12000$ and then go back hitting the Stop Loss. For the TradingView Engine this is a
trade with a permanent loss of 1000$. However, for the iCryptoScalper users, the trade is perfectly fine thanks to the numerous TP levels (and corresponding probabilities) given by the script within the trade window.
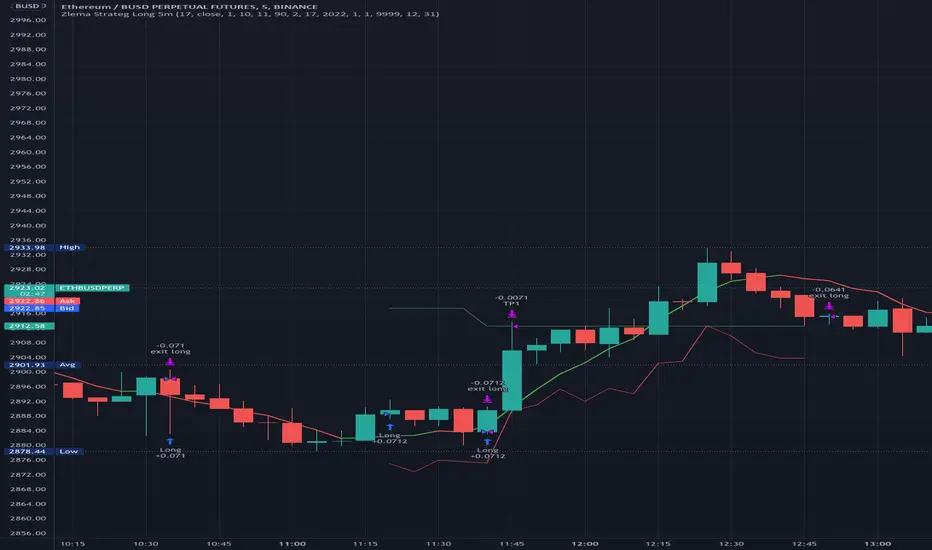
Zlema Strateg Long 5mJust putting this out there.
I created this Strategy based on Everget Zlema.
Opens long trade when Zlema changes color.
It is profitable as it is, but just putting it out to the community to see if someone else has ideas to make it better.
How to make this strategy better?
1. FInd a way to filter ranging bad trades.
2. Trades would be more profitable if entry point had an entry on the candle the zlema changes color.
3. I had to put TP 5 limit, but the optimal would be when the zlema changes color back to red (if ranging trades can we filtered that is).
In any case, just putting it out there, hope it is useful for someone, and I am open to suggestions.
Follow the Crypto ShortsThis script allows to test the impact of variations in the number of BTCUSD Shorts Positions on its price. In particular, it compares the number of short positions with its moving average to decide if shorts are being liquidated. In case the number of short positions crosses below its moving average, it will generate a Long Position, which will be closed if shorts crosses above its moving average.

Mayer Multiple StrategyCreated by Trace Mayer, the Mayer Multiple is calculated dividing the current price of Bitcoin by its 200-day moving average. This simple script allows to backtest strategies based on Mayer Multiple levels, which can be easily adjusted. It can be tested on any chart and any timeframe.

Ichimoku 4H crypto strategy -- LONG ONLYThis is a LONG ONLY strategy for 4h timeframe of any Cryptocurrency/USD pairs. The strategy opens only 1 position at a time with the following conditions.
Open Long Position when:
1. Closed price above cloud AND
2. Green cloud ahead AND
3. Conversion line above Baseline AND
4. Lagging span above cloud and price action AND
Close trade when:
1. Lagging span gets below price action or cloud OR
2. Price gets inside the cloud OR
3. Price gets below baseline
You can use it on a lower timeframe at YOUR OWN RISK. My optimal timeframe is 4 Hour candles.
Cheers.
TFO + ATR Strategy with Trailing Stop LossThis strategy is an experiment to learn what happens when The Trend Flex Oscillator (by Dr. John Ehlers) is used in conjunction with a volatility indicator like ATR. It was designed with cryptocurrency trading in mind.
The way I coded this experiment makes it unsuitable for bear market conditions.
When applied to a bull market, this trend-following strategy will open long positions when oversold price action appear to be reversing. It will typically close a position within a few days unless it gets caught in a bear market, in which case it holds on for dear life. I have tried to make back-testing very simple, but you should never trust it. It's merely and interesting tool for adjusting the many parameters that I've made editable in the configuration window. Those values include the ATR and TFO parameters, as well as setting a trailing stop loss. When closing a position, the strategy can optionally be told to ignore the trend analysis and only obey the trailing stop loss value. I've made an attempt to allow the user to define the minimum profit necessary to allow the strategy to close all all positions. In my observations, the 2H candlestick charts seem to produce the best results, although the parameters of the strategy could theoretically be adjusted to suit other time periods.
In summary...
This strategy has a bias for HODL (Holds on to Losses) meaning that it provides NO STOP LOSS protection!
Also note that the default behavior is designed for up to 15 open long orders, and executes one order to close them all at once.
Opening a long position is predicated on The Trend Flex Oscillator (TFO) rising after being oversold, and ATR above a certain volatility threshold.
Closing a long is handled either by TFO showing overbought while above a certain ATR level, or the Trailing Stop Loss. Pick one or both.
If the strategy is allowed to sell before a Trailing Stop Loss is triggered, you can set a "must exceed %". Do not mistake this for a stop loss.
Short positions are not supported in this version. Back-testing should NEVER be considered an accurate representation of actual trading results.
// portions © allanster (date window code)
// portions © Dr. John Ehlers (Trend Flex Oscillator)
This code is provided for educational purposes only. The results of this strategy should not be considered investment advice.
The user of this script acknowledges that it can result in serious financial loss when used as a trading tool

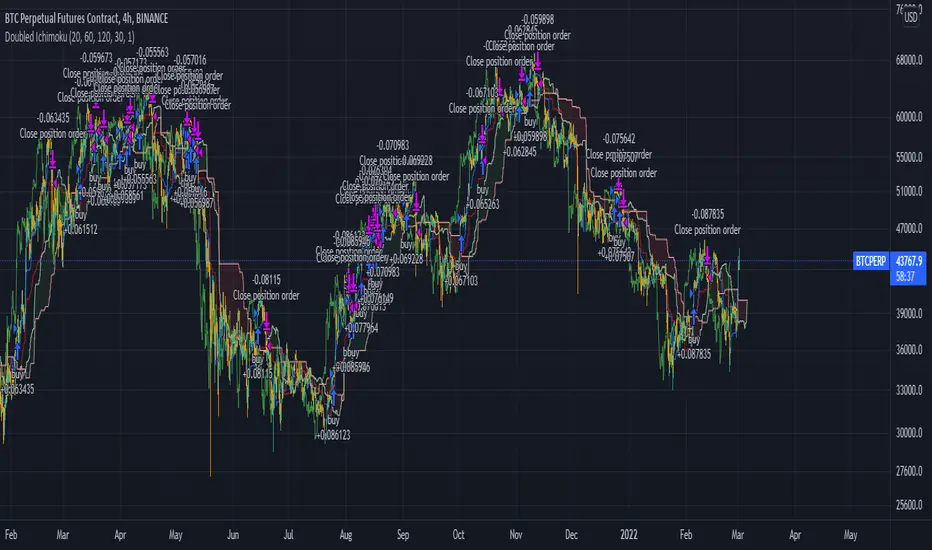
[Crypto] Dow theory strategy - Commission: 0.06 = Binance future fee.
- Autotrade by webhook to Binance future options:
1. Trend Identification:
a. UPTRENDTREND:
- HH_Trend: Higher High trend.
- HL_Trend: Higher Low trend.
b. DOWNTREND:
- LL_Trend: Lower Low trend.
- LH_Trend: Lower Low trend.
2. Open trades conditions:
a. LONG OPEN CONDITION: Điều kiện MUA.
- HH_E: Higher High entries.
- HL_E: Higher Low entries.
b. SHORT OPEN CONDITION: Điều kiện BÁN.
- LL_E: Lower Low entries.
- LH_E: Lower Low entries.
3. Stop loss and Take profit:
Stoploss, Profit = Entry Price +- ATR(20) * 5
4. Summary every year:
- 2021 to 15 Dec, 2021
- 2020 to 2021:
- 2019 to 2020:
- 2018 to 2019:
- 2017 to 2018:
- 2016 to 2017:
- 2015 to 2016:
- 2014 to 2015:
- 2013 to 2014:
5. Summary long-range:
- 2019 to 15 Dec, 2021:
- 2016 to 2019:
- 2013 to 2016:
6. List of other pairs:
