Stock Market Strategy : VWAP, MACD, EMA, Breakout, BBHello there,
Today I bring you a stock market strategy, specialized in NASDAQ stocks.
Its a daytrading strategy, that can only do a max of 1 trade per day. In this case it only trades the first 2 opening hours of the market.
The rules are simple :
We follow the trend based on a big EMA, in this case 200, after that, we check for VWAP direction , then, we check histogram from MACD. This is the simple logic of the strategy.
Inside there is another strategy, that not just do the above, but also uses Bollinger bands, and checks for breakout of bottom or top line. Also it uses Average directional Index, for even a bigger criteria .
So for example a long condition it would be : candle is above the ema, and candle is above vwap, and histogram is positive, and candle break the top bb level and ADI < 40 -> long signal . The opposite works for short(ADI > 20).
In this case all this criterias are between the first 2 hours of market. So we enter between the first hour, and exit in the next hour. For this we need to use very short time frames.
Hope you enjoy it.
Let me know if you have any questions
센터드 오실레이터

Easy System 420In this strategy, 15 indicators are used, each giving its results as a numerical value, which then is added or subtracted from the total points, gathered from all 15 indicators.
Many thanks to RafaelZioni for his great work making the EasySys1 script which i modified to create this script.
Onchart is drawn some of the indicators, but not all, a info panel is drawn showing the value each indicator has calculated. The info panel can be turned on or off.
Many of the indicator settings can be changed by user, and this is recommended, to tune the strategy to users chosen pair/timeframe.
Therefore any pair or timeframe can be used, the strategy tester results showing possible results, remember to set commission to match your broker. example chart settings here have common crypto exchange commission value: 0.25%
indicator list : SAR + STT + ZigZag + ROC + DMI + CCI + Weis + SMA + AO + MOM + Hist + BB + Ichimoku + HMA

Cycles StrategyThis is back-testable strategy is a modified version of the Stochastic strategy. It is meant to accompany the modified Stochastic indicator: "Cycles".
Modifications to the Stochastic strategy include;
1. Programmable settings for the Stochastic Periods (%K, %D and Smooth %K).
2. Programmable settings for the MACD Periods (Fast, Slow, Smoothing)
3. Programmable thresholds for %K, to qualify a potential entry strategy.
4. Programmable thresholds for %D, to qualify a potential exit strategy.
5. Buttons to choose which components to use in the trading algorithm.
6. Choose the month and year to back test.
The trading algorithm:
1. When %K exceeds the upper/lower threshold and then hooks down/up, in the direction of the Moving Average (MA). This is the minimum entry qualification.
2. When %D exceeds the lower/upper threshold and angled in the direction of the trade, is the exit qualification.
3. Additional entry filters include the direction of MACD, Signal and %D. Also, the "cliff", being a long entry is a higher high or a short entry is a lower low.
4. Strategy can only go "Long" or "Short" depending on the selected setting.
5. By matching the settings in the "Cycles" indicator, you can (almost) see what the strategy is doing.
6. Be sure to select the "Recalculate" buttons, to recalculate on every new Tick, for best results.
Please click the Like button and leave a comment if you appreciate this script. Improvements will be implemented as time goes on.
I am not a licensed trade advisor. This strategy is for entertainment only. Use at your own risk!

ISS V5 Strategy for ETHUSDTSimple long/short strategy. Using MACD and few more oscillators.
Optimized for ETHUSDT 4h, Enjoy!

Simple and efficient MACD crypto strategy with risk managementToday I am glad to bring you another great creation suited for crypto markets.
MARKET
Its a simple and efficient strategy, designed for crypto markets( btcusd , btcusdt and so on), and suited for for higher time charts : like 1hour, 4hours, 1 day and so on.
Preferably to use 1h time charts.
COMPONENTS
MACD with simple moving average
ENTRY DESCRIPTION
For entries we have :
We check the direction with MACD . Depending if its an uptrend and positive level on histogram of MACD we go long, otherwise we go short.
RISK MANAGEMENT
In this strategy we use a stop loss based on our equity. For this example I choosed a 2% risk .That means if our account has 100.000 eur, it will automatically close the trade if we lose 2.000.
We dont use a take profit level.
In this example also we use a 100.000 capital account, risking 5% on each trade, but since its underleveraged, we only use 5000 of that ammount on every trade. With leveraged it can be achieved better profits and of course at the same time we will encounter bigger losses.
The comission applied is 5$ and a slippage of 5 points aswell added.
For any questions or suggestions regarding the script , please let me know.

High/low crypto strategy with MACD/PSAR/ATR/EWaveToday I am glad to bring you another great creation of mine, this time suited for crypto markets.
MARKET
Its a high and low strategy, designed for crypto markets( btcusd , btcusdt and so on), and suited for for higher time charts : like 1hour, 4hours, 1 day and so on.
Preferably to use 1h time charts.
COMPONENTS
Higher high and lower low between different candle points
MACD with simple moving average
PSAR for uptrend and downtrend
Trenddirection made of a modified moving average and ATR
And lastly elliot wave oscillator to have an even better precision for entries and exits.
ENTRY DESCRIPTION
For entries we have : when the first condition is meet(we have a succession on higher high or lower lows), then we check the macd histogram level, then we pair that with psar for the direction of the trend, then we check the trend direction based on atr levels with MA applied on it and lastly to confirm the direction we check the level of elliot wave oscillator. If they are all on the same page we have a short or a long entry.
STATS
Its a low win percentage , we usually have between 10-20% win rate, but at the same time we use a 1:30 risk reward ratio .
By this we achieve an avg profit factor between 1.5- 2.5 between different currencies.
RISK MANAGEMENT
In this example, the stop loss is 0.5% of the price fluctuation ( 10.000 -> 9950 our sl), and tp is 15% (10.000 - > 11500).
In this example also we use a 100.000 capital account, risking 5% on each trade, but since its underleveraged, we only use 5000 of that ammount on every trade. With leveraged it can be achieved better profits and of course at the same time we will encounter bigger losses.
The comission applied is 5$ and a slippage of 5 points aswell added.
For any questions or suggestions regarding the script , please let me know.

Ruckard TradingLatinoThis strategy tries to mimic TradingLatino strategy.
The current implementation is beta.
Si hablas castellano o espanyol por favor consulta MENSAJE EN CASTELLANO más abajo.
It's aimed at BTCUSDT pair and 4h timeframe.
STRATEGY DEFAULT SETTINGS EXPLANATION
max_bars_back=5000 : This is a random number of bars so that the strategy test lasts for one or two years
calc_on_order_fills=false : To wait for the 4h closing is too much. Try to check if it's worth entering a position after closing one. I finally decided not to recheck if it's worth entering after an order is closed. So it is false.
calc_on_every_tick=false
pyramiding=0 : We only want one entry allowed in the same direction. And we don't want the order to scale by error.
initial_capital=1000 : These are 1000 USDT. By using 1% maximum loss per trade and 7% as a default stop loss by using 1000 USDT at 12000 USDT per BTC price you would entry with around 142 USDT which are converted into: 0.010 BTC . The maximum number of decimal for contracts on this BTCUSDT market is 3 decimals. E.g. the minimum might be: 0.001 BTC . So, this minimal 1000 amount ensures us not to entry with less than 0.001 entries which might have happened when using 100 USDT as an initial capital.
slippage=1 : Binance BTCUSDT mintick is: 0.01. Binance slippage: 0.1 % (Let's assume). TV has an integer slippage. It does not have a percentage based slippage. If we assume a 1000 initial capital, the recommended equity is 142 which at 11996 USDT per BTC price means: 0.011 BTC. The 0.1% slippage of: 0.011 BTC would be: 0.000011 . This is way smaller than the mintick. So our slippage is going to be 1. E.g. 1 (slippage) * 0.01 (mintick)
commission_type=strategy.commission.percent and commission_value=0.1 : According to: binance . com / en / fee / schedule in VIP 0 level both maker and taker fees are: 0.1 %.
BACKGROUND
Jaime Merino is a well known Youtuber focused on crypto trading
His channel TradingLatino
features monday to friday videos where he explains his strategy.
JAIME MERINO STANCE ON BOTS
Jaime Merino stance on bots (taken from memory out of a 2020 June video from him):
'~
You know. They can program you a bot and it might work.
But, there are some special situations that the bot would not be able to handle.
And, I, as a human, I would handle it. And the bot wouldn't do it.
~'
My long term target with this strategy script is add as many
special situations as I can to the script
so that it can match Jaime Merino behaviour even in non normal circumstances.
My alternate target is learn Pine script
and enjoy programming with it.
WARNING
This script might be bigger than other TradingView scripts.
However, please, do not be confused because the current status is beta.
This script has not been tested with real money.
This is NOT an official strategy from Jaime Merino.
This is NOT an official strategy from TradingLatino . net .
HOW IT WORKS
It basically uses ADX slope and LazyBear's Squeeze Momentum Indicator
to make its buy and sell decisions.
Fast paced EMA being bigger than slow paced EMA
(on higher timeframe) advices going long.
Fast paced EMA being smaller than slow paced EMA
(on higher timeframe) advices going short.
It finally add many substrats that TradingLatino uses.
SETTINGS
__ SETTINGS - Basics
____ SETTINGS - Basics - ADX
(ADX) Smoothing {14}
(ADX) DI Length {14}
(ADX) key level {23}
____ SETTINGS - Basics - LazyBear Squeeze Momentum
(SQZMOM) BB Length {20}
(SQZMOM) BB MultFactor {2.0}
(SQZMOM) KC Length {20}
(SQZMOM) KC MultFactor {1.5}
(SQZMOM) Use TrueRange (KC) {True}
____ SETTINGS - Basics - EMAs
(EMAS) EMA10 - Length {10}
(EMAS) EMA10 - Source {close}
(EMAS) EMA55 - Length {55}
(EMAS) EMA55 - Source {close}
____ SETTINGS - Volume Profile
Lowest and highest VPoC from last three days
is used to know if an entry has a support
VPVR of last 100 4h bars
is also taken into account
(VP) Use number of bars (not VP timeframe): Uses 'Number of bars {100}' setting instead of 'Volume Profile timeframe' setting for calculating session VPoC
(VP) Show tick difference from current price {False}: BETA . Might be useful for actions some day.
(VP) Number of bars {100}: If 'Use number of bars (not VP timeframe)' is turned on this setting is used to calculate session VPoC.
(VP) Volume Profile timeframe {1 day}: If 'Use number of bars (not VP timeframe)' is turned off this setting is used to calculate session VPoC.
(VP) Row width multiplier {0.6}: Adjust how the extra Volume Profile bars are shown in the chart.
(VP) Resistances prices number of decimal digits : Round Volume Profile bars label numbers so that they don't have so many decimals.
(VP) Number of bars for bottom VPOC {18}: 18 bars equals 3 days in suggested timeframe of 4 hours. It's used to calculate lowest session VPoC from previous three days. It's also used as a top VPOC for sells.
(VP) Ignore VPOC bottom advice on long {False}: If turned on it ignores bottom VPOC (or top VPOC on sells) when evaluating if a buy entry is worth it.
(VP) Number of bars for VPVR VPOC {100}: Number of bars to calculate the VPVR VPoC. We use 100 as Jaime once used. When the price bounces back to the EMA55 it might just bounce to this VPVR VPoC if its price it's lower than the EMA55 (Sells have inverse algorithm).
____ SETTINGS - ADX Slope
ADX Slope
help us to understand if ADX
has a positive slope, negative slope
or it is rather still.
(ADXSLOPE) ADX cut {23}: If ADX value is greater than this cut (23) then ADX has strength
(ADXSLOPE) ADX minimum steepness entry {45}: ADX slope needs to be 45 degrees to be considered as a positive one.
(ADXSLOPE) ADX minimum steepness exit {45}: ADX slope needs to be -45 degrees to be considered as a negative one.
(ADXSLOPE) ADX steepness periods {3}: In order to avoid false detection the slope is calculated along 3 periods.
____ SETTINGS - Next to EMA55
(NEXTEMA55) EMA10 to EMA55 bounce back percentage {80}: EMA10 might bounce back to EMA55 or maybe to 80% of its complete way to EMA55
(NEXTEMA55) Next to EMA55 percentage {15}: How much next to the EMA55 you need to be to consider it's going to bounce back upwards again.
____ SETTINGS - Stop Loss and Take Profit
You can set a default stop loss or a default take profit.
(STOPTAKE) Stop Loss % {7.0}
(STOPTAKE) Take Profit % {2.0}
____ SETTINGS - Trailing Take Profit
You can customize the default trailing take profit values
(TRAILING) Trailing Take Profit (%) {1.0}: Trailing take profit offset in percentage
(TRAILING) Trailing Take Profit Trigger (%) {2.0}: When 2.0% of benefit is reached then activate the trailing take profit.
____ SETTINGS - MAIN TURN ON/OFF OPTIONS
(EMAS) Ignore advice based on emas {false}.
(EMAS) Ignore advice based on emas (On closing long signal) {False}: Ignore advice based on emas but only when deciding to close a buy entry.
(SQZMOM) Ignore advice based on SQZMOM {false}: Ignores advice based on SQZMOM indicator.
(ADXSLOPE) Ignore advice based on ADX positive slope {false}
(ADXSLOPE) Ignore advice based on ADX cut (23) {true}
(STOPTAKE) Take Profit? {false}: Enables simple Take Profit.
(STOPTAKE) Stop Loss? {True}: Enables simple Stop Loss.
(TRAILING) Enable Trailing Take Profit (%) {True}: Enables Trailing Take Profit.
____ SETTINGS - Strategy mode
(STRAT) Type Strategy: 'Long and Short', 'Long Only' or 'Short Only'. Default: 'Long and Short'.
____ SETTINGS - Risk Management
(RISKM) Risk Management Type: 'Safe', 'Somewhat safe compound' or 'Unsafe compound'. ' Safe ': Calculations are always done with the initial capital (1000) in mind. The maximum losses per trade/day/week/month are taken into account. ' Somewhat safe compound ': Calculations are done with initial capital (1000) or a higher capital if it increases. The maximum losses per trade/day/week/month are taken into account. ' Unsafe compound ': In each order all the current capital is gambled and only the default stop loss per order is taken into account. That means that the maximum losses per trade/day/week/month are not taken into account. Default : 'Somewhat safe compound'.
(RISKM) Maximum loss per trade % {1.0}.
(RISKM) Maximum loss per day % {6.0}.
(RISKM) Maximum loss per week % {8.0}.
(RISKM) Maximum loss per month % {10.0}.
____ SETTINGS - Decimals
(DECIMAL) Maximum number of decimal for contracts {3}: How small (3 decimals means 0.001) an entry position might be in your exchange.
EXTRA 1 - PRICE IS IN RANGE indicator
(PRANGE) Print price is in range {False}: Enable a bottom label that indicates if the price is in range or not.
(PRANGE) Price range periods {5}: How many previous periods are used to calculate the medians
(PRANGE) Price range maximum desviation (%) {0.6} ( > 0 ): Maximum positive desviation for range detection
(PRANGE) Price range minimum desviation (%) {0.6} ( > 0 ): Mininum negative desviation for range detection
EXTRA 2 - SQUEEZE MOMENTUM Desviation indicator
(SQZDIVER) Show degrees {False}: Show degrees of each Squeeze Momentum Divergence lines to the x-axis.
(SQZDIVER) Show desviation labels {False}: Whether to show or not desviation labels for the Squeeze Momentum Divergences.
(SQZDIVER) Show desviation lines {False}: Whether to show or not desviation lines for the Squeeze Momentum Divergences.
EXTRA 3 - VOLUME PROFILE indicator
WARNING: This indicator works not on current bar but on previous bar. So in the worst case it might be VP from 4 hours ago. Don't worry, inside the strategy calculus the correct values are used. It's just that I cannot show the most recent one in the chart.
(VP) Print recent profile {False}: Show Volume Profile indicator
(VP) Avoid label price overlaps {False}: Avoid label prices to overlap on the chart.
EXTRA 4 - ZIGNALY SUPPORT
(ZIG) Zignaly Alert Type {Email}: 'Email', 'Webhook'. ' Email ': Prepare alert_message variable content to be compatible with zignaly expected email content format. ' Webhook ': Prepare alert_message variable content to be compatible with zignaly expected json content format.
EXTRA 5 - DEBUG
(DEBUG) Enable debug on order comments {False}: If set to true it prepares the order message to match the alert_message variable. It makes easier to debug what would have been sent by email or webhook on each of the times an order is triggered.
HOW TO USE THIS STRATEGY
BOT MODE: This is the default setting.
PROPER VOLUME PROFILE VIEWING: Click on this strategy settings. Properties tab. Make sure Recalculate 'each time the order was run' is turned off.
NEWBIE USER: (Check PROPER VOLUME PROFILE VIEWING above!) You might want to turn on the 'Print recent profile {False}' setting. Alternatively you can use my alternate realtime study: 'Resistances and supports based on simplified Volume Profile' but, be aware, it might consume one indicator.
ADVANCED USER 1: Turn on the 'Print price is in range {False}' setting and help us to debug this subindicator. Also help us to figure out how to include this value in the strategy.
ADVANCED USER 2: Turn on the all the (SQZDIVER) settings and help us to figure out how to include this value in the strategy.
ADVANCED USER 3: (Check PROPER VOLUME PROFILE VIEWING above!) Turn on the 'Print recent profile {False}' setting and report any problem with it.
JAIME MERINO: Just use the indicator as it comes by default. It should only show BUY signals, SELL signals and their associated closing signals. From time to time you might want to check 'ADVANCED USER 2' instructions to check that there's actually a divergence. Check also 'ADVANCED USER 1' instructions for your amusement.
EXTRA ADVICE
It's advised that you use this strategy in addition to these two other indicators:
* Squeeze Momentum Indicator
* ADX
so that your chart matches as close as possible to TradingLatino chart.
ZIGNALY INTEGRATION
This strategy supports Zignaly email integration by default. It also supports Zignaly Webhook integration.
ZIGNALY INTEGRATION - Email integration example
What you would write in your alert message:
||{{strategy.order.alert_message}}||key=MYSECRETKEY||
ZIGNALY INTEGRATION - Webhook integration example
What you would write in your alert message:
{ {{strategy.order.alert_message}} , "key" : "MYSECRETKEY" }
CREDITS
I have reused and adapted some code from
'Directional Movement Index + ADX & Keylevel Support' study
which it's from TradingView console user.
I have reused and adapted some code from
'3ema' study
which it's from TradingView hunganhnguyen1193 user.
I have reused and adapted some code from
'Squeeze Momentum Indicator ' study
which it's from TradingView LazyBear user.
I have reused and adapted some code from
'Strategy Tester EMA-SMA-RSI-MACD' study
which it's from TradingView fikira user.
I have reused and adapted some code from
'Support Resistance MTF' study
which it's from TradingView LonesomeTheBlue user.
I have reused and adapted some code from
'TF Segmented Linear Regression' study
which it's from TradingView alexgrover user.
I have reused and adapted some code from
"Poor man's volume profile" study
which it's from TradingView IldarAkhmetgaleev user.
FEEDBACK
Please check the strategy source code for more detailed information
where, among others, I explain all of the substrats
and if they are implemented or not.
Q1. Did I understand wrong any of the Jaime substrats (which I have implemented)?
Q2. The strategy yields quite profit when we should long (EMA10 from 1d timeframe is higher than EMA55 from 1d timeframe.
Why the strategy yields much less profit when we should short (EMA10 from 1d timeframe is lower than EMA55 from 1d timeframe)?
Any idea if you need to do something else rather than just reverse what Jaime does when longing?
FREQUENTLY ASKED QUESTIONS
FAQ1. Why are you giving this strategy for free?
TradingLatino and his fellow enthusiasts taught me this strategy. Now I'm giving back to them.
FAQ2. Seriously! Why are you giving this strategy for free?
I'm confident his strategy might be improved a lot. By keeping it to myself I would avoid other people contributions to improve it.
Now that everyone can contribute this is a win-win.
FAQ3. How can I connect this strategy to my Exchange account?
It seems that you can attach alerts to strategies.
You might want to combine it with a paying account which enable Webhook URLs to work.
I don't know how all of this works right now so I cannot give you advice on it.
You will have to do your own research on this subject. But, be careful. Automating trades, if not done properly,
might end on you automating losses.
FAQ4. I have just found that this strategy by default gives more than 3.97% of 'maximum series of losses'. That's unacceptable according to my risk management policy.
You might want to reduce default stop loss setting from 7% to something like 5% till you are ok with the 'maximum series of losses'.
FAQ5. Where can I learn more about your work on this strategy?
Check the source code. You might find unused strategies. Either because there's not a substantial increases on earnings. Or maybe because they have not been implemented yet.
FAQ6. How much leverage is applied in this strategy?
No leverage.
FAQ7. Any difference with original Jaime Merino strategy?
Most of the times Jaime defines an stop loss at the price entry. That's not the case here. The default stop loss is 7% (but, don't be confused it only means losing 1% of your investment thanks to risk management). There's also a trailing take profit that triggers at 2% profit with a 1% trailing.
FAQ8. Why this strategy return is so small?
The strategy should be improved a lot. And, well, backtesting in this platform is not guaranteed to return theoric results comparable to real-life returns. That's why I'm personally forward testing this strategy to verify it.
MENSAJE EN CASTELLANO
En primer lugar se agradece feedback para mejorar la estrategia.
Si eres un usuario avanzado y quieres colaborar en mejorar el script no dudes en comentar abajo.
Ten en cuenta que aunque toda esta descripción tenga que estar en inglés no es obligatorio que el comentario esté en inglés.
CHISTE - CASTELLANO
¡Pero Jaime!
¡400.000!
¡Tu da mun!

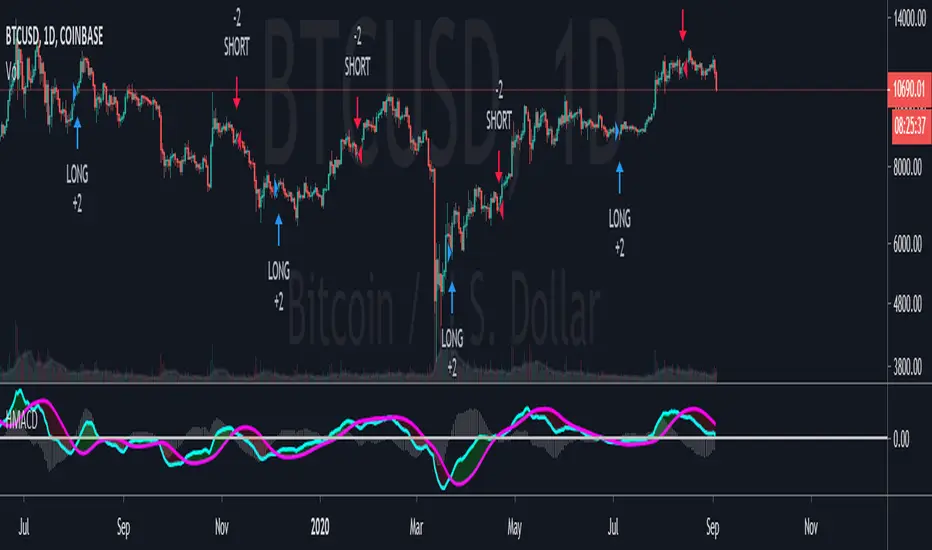
Coppock Curve StrategyThis strategy makes use of a not widely known technical indicator called "Coppock Curve".
The indicator is derived by taking a weighted moving average of the rate-of-change (ROC) of a market index such as the S&P 500 or a trading equivalent such as the S&P 500 SPDR ETF. For more info: (www.investopedia.com)
This strategy uses $SPY Coppock curve as a proxy to generate buy signals on other ETF's and stocks.
Buy signals are generated when the Coppock Curve crosses above zero, and sell signals are generated when it crosses below.
An optional, trailing stop loss is available, with default settings to 100% so that it does not currently affect the buy and sell signals solely generated by the Coppock Curve. But you may find adding a Trailing stop loss may improve results on certain ETF's/Stocks.
You may also change the symbol for which signals are generated for, default is $SPY.
The published example shows using this strategy on a leverage ETF $TQQQ w/ starting capital of 10k, w/ 10k per trade. Try it on other stocks such as $AAPL, $AMZN $NFLX ect... I have found it to be an effective strategy that has a favorable risk to reward profile.
Any questions, please let me know!

HULL MACDA modified version of MACD.
Uses Hull moving average for the signal line instead of your typical EMA.
Can be used as a crossover strategy with decent win rate.
Alternatively, can also be used for histogram divergences.
Try it out! :)
MACD Strategy KMACK Rev 1.1Hull smoothed 45/10 macd
Please note that the macd/rsi values do not print unless the current day is Monday-Friday and the market will be open.
14 period hull smoothed rsi marks the rsi value at each macd reversal and will not signal a long position above 70 or a short position below 30
Macd and rsi will only display on the current day and will only display the last 2 hours
Lit candles occur after 0920 nyse time
Alerts or entries will only fire after 0931 nyse time
Entry signal will confirm with the 5 minute candle.
Long entry requires the current 5 minute candle to close>=hlc3
Short entry requires the current 5 minute candle to close<=hlc3
Buy/sell alerts will only fire in the last 10 seconds of the realtime (current) bar
Options:
Select bias
Modify macd lookback period(s)
Alerts:
Buy
Sell
Rsi crossing into the power region (60)
Rsi crossing into the weakness region (40)
Current strategy exits position upon signal opposite to selected bias, this is for simplicity.
There are currently no add-on strat signals but the alerts/lit candles will fire
Successful trades average >55% with an average profit factor of 3%
Net profit averages 3%
Max drawdown averages below 0.25%
Added order size input
Added show/hide strat signals. Still lights the bars green/red. Make sure your bar color setting in tv is set to a transparent color so you can see the bright reds and greens.
Added a couple lines of code that fire the alert/strat if macd reverses and the corresponding 5min candle does not agree and the following candle does agree. Added an average of 1.5% winning trades.
Message me for free trial access
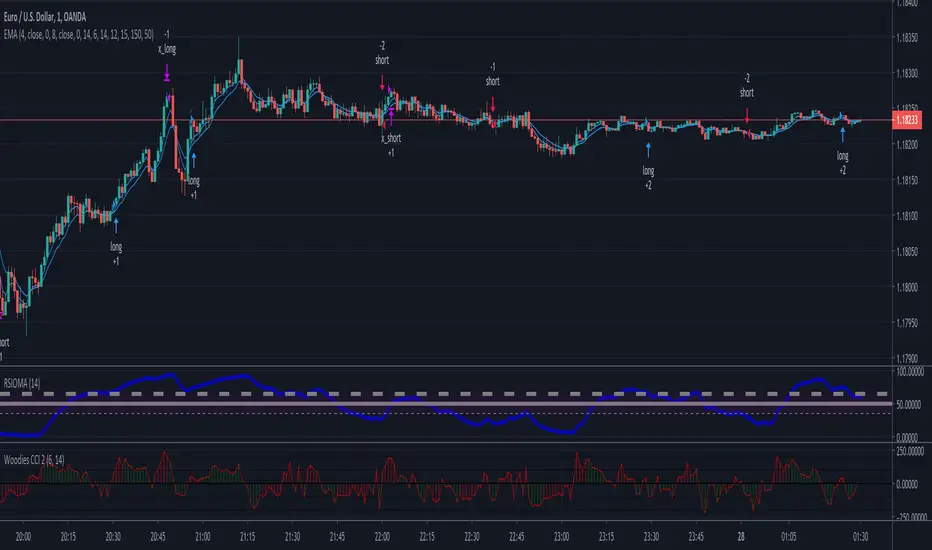
Daytrade strategy RSI CCI EMA 4/8This strategy is designed for daytrade charts.
Its made from
EMA 4 / EMA 8 to check for crosses
RSI levels for overbough/oversold
CCI levels
For entry, we check first if the ema 4 crossed ema 8
Secondly we confirm by checking the level of RSI level
Finally we confirm with CCI level
If all of them are on the same page we enter.
For exit we have a fixed pip points system for TP/SL
Full strategy AllinOne with risk management MACD RSI PSAR ATR MAHey, I am glad to present you one of the strategies where I put a lot of time in it.
This strategy can be adapted to all type of timecharts like scalping, daytrading or swing.
The context is the next one :
First we have the ATR to calculate our TP/SL points. At the same time we have another rule once we enter(we enter based on % risk from total equity, in this example 1%, at the same time, lowest ammount for this example is 0.1 lots, but can be modified to 0.01), so we can exit both by tp/sl points, or by losing 1% of our equity or winning 1% of our total equity. It's dinamic.
The strategy is made from
Trend direction :
PSAR
First confirmation point :
Crossover between 10EMA and Bollinger bands middle point
Second confirmation
MACD histogram
Third confirmation
RSI overbought/oversold levels
For entries : we check trend with psar, then once ema cross bb middle point, we confirm together with rsi level for overbought/oversold and macd histogram ( > 0 or <0).
We exit, when we have opposite sign, like from buy to sell or sell to buy, or when we reach tp/sl points, or when we reach % basaed equity points.
It can be changed to be fixed lots, or fixed tp/sl , you just have to uncomment the size from entries, and tp/sl lines.
At the same time, it has the possibility if one desires, to trade only concrete forex session like european, asian and so on for intraday trading.
Hope you enjoy it.
Let me know how it goes.

MACD++ Strategy [SystemAlpha]This is a strategy based on MACD Oscillator. Instead of using just the normal crossovers, we use trend filters, trailing stop loss and take profit targets. This strategy was developed for crypto, forex and stocks on daily timeframe but feel free to experiment on 15 minutes or higher using heikin ashi or normal candles
In this strategy you have a choice of:
Trend Filters:
- Average Directional Index ( ADX ) – buy when price is trend is up and sell when trend is down.
- Moving Average (MA) – buy when price close above the defined moving average and sell when price close below moving average
- Parabolic SAR – buy when SAR is above price is above price and sell when SAR is below price.
- All - Use ADX , MA and SAR as filters
For MA Filter , you can use the “TF MA Type” and "TF MA Period" parameter to select Simple or Exponential Moving Average and length.
Stop Loss:
- Average True Range (ATR) – ATR % stop as trailing stop loss.
- Parabolic SAR ( SAR ) – Parabolic SAR adapted as trailing stop loss.
For ATR , you can use the “ATR Trailing Stop Multiplier” parameter to set an initial offset for trailing stop loss.
Take Profit Target:
- Average True Range (ATR) – ATR % stop as trailing stop loss.
- Standard % – Percent as target profit
For ATR , you can use the “ATR Take Profit Multiplier” parameter to set an initial offset for trailing stop loss.
Additional feature include:
- Regular and Hidden Divergence display and alerts
STRATEGY ONLY:
- Set back test date range
- Set trade direction - Long, Short or Both
- Use timed exit - Select method and bars
- Method 1: Exit after specified number of bars.
- Method 2: Exit after specified number of bars, ONLY if position is currently profitable.
- Method 3: Exit after specified number of bars, ONLY if position is currently losing.
TradingView Links:
Alerts:
MACD:
How to use:
1. Apply the script by browsing through Indicators --> Invite-Only scripts and select the indicator
2. Once loaded, click the gear (settings) button to select/adjust the parameters based on your preference.
3. Wait for the next BUY or SELL signal to enter the trade!
Disclaimer:
The indicator and signals generated do not constitute investment advice; are provided solely for informational purposes and therefore is not an offer to buy or sell a security; are not warranted to be correct, complete or accurate; and are subject to change without notice.

MACD+ Strategy [SystemAlpha]This is a strategy based on MACD Oscillator . Instead of using just the normal crossovers, we use trend filters, trailing stop loss and take profit targets. This strategy was developed for crypto, forex and stocks on daily timeframe but feel free to experiment on 15 minutes or higher using heikin ashi or normal candles
In this strategy you have a choice of:
Trend Filters:
- Average Directional Index ( ADX ) – buy when price is trend is up and sell when trend is down.
- Moving Average (MA) – buy when price close above the defined moving average and sell when price close below moving average
- Parabolic SAR – buy when SAR is above price is above price and sell when SAR is below price.
- All - Use ADX , MA and SAR as filters
For MA Filter , you can use the “TF MA Type” and "TF MA Period" parameter to select Simple or Exponential Moving Average and length.
Stop Loss:
- Average True Range (ATR) – ATR % stop as trailing stop loss.
- Parabolic SAR ( SAR ) – Parabolic SAR adapted as trailing stop loss.
For ATR , you can use the “ATR Trailing Stop Multiplier” parameter to set an initial offset for trailing stop loss.
Take Profit Target:
- Average True Range (ATR) – ATR % stop as trailing stop loss.
- Standard % – Percent as target profit
For ATR , you can use the “ATR Take Profit Multiplier” parameter to set an initial offset for trailing stop loss.
Additional feature include:
- Regular and Hidden Divergence display and alerts
STRATEGY ONLY:
- Set back test date range
- Set trade direction - Long, Short or Both
- Use timed exit - Select method and bars
- Method 1: Exit after specified number of bars.
- Method 2: Exit after specified number of bars, ONLY if position is currently profitable.
- Method 3: Exit after specified number of bars, ONLY if position is currently losing.
TradingView Links:
Alerts:
MACD:
How to use:
1. Apply the script by browsing through Indicators --> Invite-Only scripts and select the indicator
2. Once loaded, click the gear (settings) button to select/adjust the parameters based on your preference.
3. Wait for the next BUY or SELL signal to enter the trade!
Disclaimer:
The indicator and signals generated do not constitute investment advice; are provided solely for informational purposes and therefore is not an offer to buy or sell a security; are not warranted to be correct, complete or accurate; and are subject to change without notice.

M4x Rainbow V4i strat LINK-USDTGRID & TREND Multiplier Experiment
// "M4x Rainbow" is a Strategy Grid Trend Multiplier bot, who is following the trend.
// I built it as an experimental tool with Strategy implemented, even if that numbers are far out...!
// Because.....it not only depends on the bot setup, the timings of the TradingBot (eg.3Commas) are very relevant too!
// Like amount of Trades, Security Orders, Deviation and so on...
// Please feedback your experience with a Comment , as I would like to improve this bot.
// Updates will follow ;-)
//
// "M4x Rainbow" is not bound on FIFO, each trade get's his own exit.
// It is set for Pyramiding, which can be changed in the "Strategy" line
// Fees are set equal to Binance numbers at 0.1%, about...
// The coloring of the lines is:
//
// green = linestate is LONG
// blue = linestate is WAIT
// yellow = linestate is SHORT
//
// Give it a try and let me know.
//
// ...have fun ;-)

PSAR Strategy (No Overnight Holds)This script utilizes the logic of the TradingView built-in Parabolic SAR strategy, and is adjusted to only give signals during real trading hours (in other words excluding pre-market and after-hours) and to exit all trades before the close of the market.
I personally have found the best results for this strategy to be on a 1 minute time period, and have a great interest in optimizing the profits of this strategy relative to the amount of closed trades and commissions involved. These results are calculated on a 100-share basis, with an estimated $1.00 commission per closed trade. Note that this strategy is extremely active and assumes a long or short 100-share position at any given moment throughout real trading hours.
Definitely take some time to play with the settings to find what works best for a given ticker, as results will vary; using a 100-share basis, I have found profits of over $15,000 with less than 1500 closed trades (on a 1 minute time period, back-tested to one month), and I have also found profits of over $30,000 with nearly 5000 closed trades. There is surely room for a lot of optimization with this strategy.

MACD Crossover Trading Strategy tested 100xI have scripted recently seen youtube video MACD Crossover Trading Strategy tested 100x to see the actual results.
Strategy longs if:
- macd line crossover signal line above zero and price closes above baseline
Strategy shorts if:
- macd line crossunder singnal line below zero and price closes below baseline
As baseline is used ema(200)
As Stop-loss is used swing low/high calculated from last 50 candless or baseline value
As Take-profit is used stop-loss multiplied by RRR 1.5
Settings can be adjusted as you like
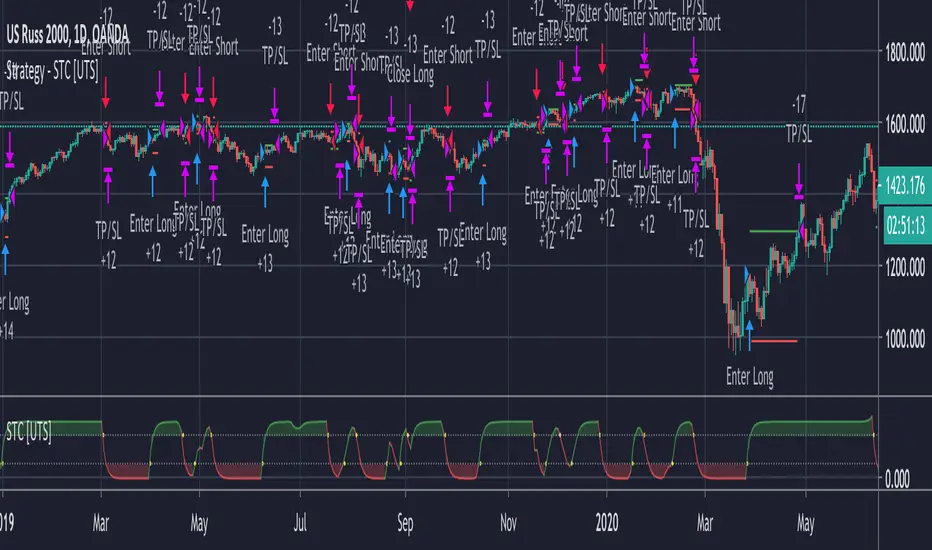
Strategy - Uber STC - Schaff Trend Cycle [UTS]Backtesting of Uber STC - Schaff Trend Cycle
Backtest with focus win/loss profitability.
Formula: profitability = win / (win+loss)
Default equity 100k USD
Default 2% Risk per trade
Default currency USD
Define backtest interval precisely by month, year, day
LONG and SHORT positions
Visualize SL and TP on chart
ATR (len: 14, smooth: SMA)
ATR based Stop-Loss, if hit trade will be closed and considered as loss
ATR based Take-Profit, if hit trade will be closed and considered as win
On TP or SL hit the trade is closed and marked as win/loss
percentrank strategySrategy for percentrank
Percent rank is the percents of how many previous values was less than or equal to the current value of given series.
long entry: intersection line 1 from bottom to top
short entry: crossing line 2 from top to bottom
Стратегия для индикатора percentrank
Процентный рейтинг — это процент от количества предыдущих значений, которые были меньше или равны текущему значению данной серии.
вход в лонг: пересечение line 1 снизу вверх
вход в шорт: пересечение line 2 сверху вниз
S&P Bear Warning IndicatorTHIS SCRIPT HAS BEEN BUILT TO BE USED AS A S&P500 SPY CRASH INDICATOR ON A DAILY TIME FRAME (should not be used as a strategy).
THIS SCRIPT HAS BEEN BUILT AS A STRATEGY FOR VISUALIZATION PURPOSES ONLY AND HAS NOT BEEN OPTIMIZED FOR PROFIT.
The script has been built to show as a lower indicator and also gives visual SELL signal on top when conditions are met. BARE IN MIND NO STOP LOSS, NOR ADVANCED EXIT STRATEGY HAS BEEN BUILT.
As well as the chart SELL signal an alert option has also been built into this script.
The script utilizes a VIX indicator (maroon line) and 50 period Momentum (blue line) and Danger/No trade zone(pink shading).
When the Momentum line crosses down across the VIX this is a sell off but in order to only signal major sell offs the SELL signal only triggers if the momentum continues down through the danger zone.
A SELL signal could be given earlier by removing the need to wait for momentum to continue down through the Danger Zone however this is designed only to catch major market weakness not small sell offs.
As you can see from the picture between the big October 2018 and March 2020 market declines only 2 additional SELLS were triggered.
To use this indicator to identify ideal buying then you should only buy when Momentum line is crossed above the VIX and the Momentum line is above the Danger Zone (ideally 3 - 5 days above danger zone)

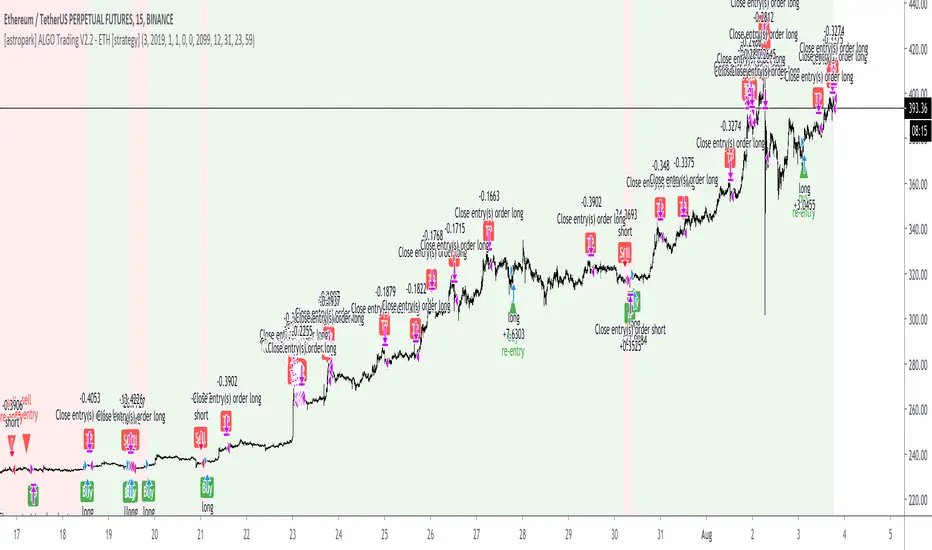
[astropark] ALGO Trading V2.2 - ETH [strategy]Dear Followers,
today another awesome Swing and Scalping Trading Strategy indicator : the upgraded version of ALGO Trading V2 for Binance Ethereum PERP on 15m timeframe!
It is runnable on a bot , just write me in order to help you do it.
If you are a scalper or you are a swing trader, you will love suggested entries for fast and long-lasting profit.
Keep in mind that a proper trailing stop strategy and risk management and money management strategies are very important (DM me if you need any clarification on these points).
This is an upgrade version of ALGO Trading V2 for Ethereum.
You can find ALGO Trading V2 indicator here below:
If you are interested in Bitcoin Trading , you will like for sure ALGO Trading V1.2, which is a customized version for Bitcoin trading:
This strategy has the following options:
enable/disable signals on chart
enable/disable bars and background coloring based on trend
enable/disable a Filter Noise option, which reduces overtrading
enable/disable a Trailing Stop option
enable/disable/config a Take Profit option, with Re-Entry
enable/disable a secret Smart Close Option which may improve profit on your chart (again, check it on you chart if it helps or not)
This strategy only trigger 1 buy (where to start a long trade) or 1 sell (for short trade). If you enable Take Profit / Stop Loss option, consider that many TP can be triggered before trend reversal, so take partial profit on every TP an eventually buy/sell back lower/higher on RE-ENTRY signal to maximize your profit.
Strategy results are calculated on the time window from December 2019 to now, so on more than 7 months, using 1000$ as initial capital and working at 1x leverage (so no leverage at all! If you like to use leverage, be sure to use a safe option, like 3x or 5x at most in order to have liquidation price very far).
This is not the "Holy Grail", so use proper money and risk management strategies.
In order to get notified when a signal is triggered, you need to use the "alarms" version of this indicator (just search for astropark's "ALGO Trading V2.2 - ETH" indicator and choose the one with "alarms" suffix).
This is a premium indicator , so send me a private message in order to get access to this script.
Combo Backtest 123 Reversal & Ergodic MDI This is combo strategies for get a cumulative signal.
First strategy
This System was created from the Book "How I Tripled My Money In The
Futures Market" by Ulf Jensen, Page 183. This is reverse type of strategies.
The strategy buys at market, if close price is higher than the previous close
during 2 days and the meaning of 9-days Stochastic Slow Oscillator is lower than 50.
The strategy sells at market, if close price is lower than the previous close price
during 2 days and the meaning of 9-days Stochastic Fast Oscillator is higher than 50.
Second strategy
This is one of the techniques described by William Blau in his book "Momentum,
Direction and Divergence" (1995). If you like to learn more, we advise you to
read this book. His book focuses on three key aspects of trading: momentum,
direction and divergence. Blau, who was an electrical engineer before becoming
a trader, thoroughly examines the relationship between price and momentum in
step-by-step examples. From this grounding, he then looks at the deficiencies
in other oscillators and introduces some innovative techniques, including a
fresh twist on Stochastics. On directional issues, he analyzes the intricacies
of ADX and offers a unique approach to help define trending and non-trending periods.
WARNING:
- For purpose educate only
- This script to change bars colors.
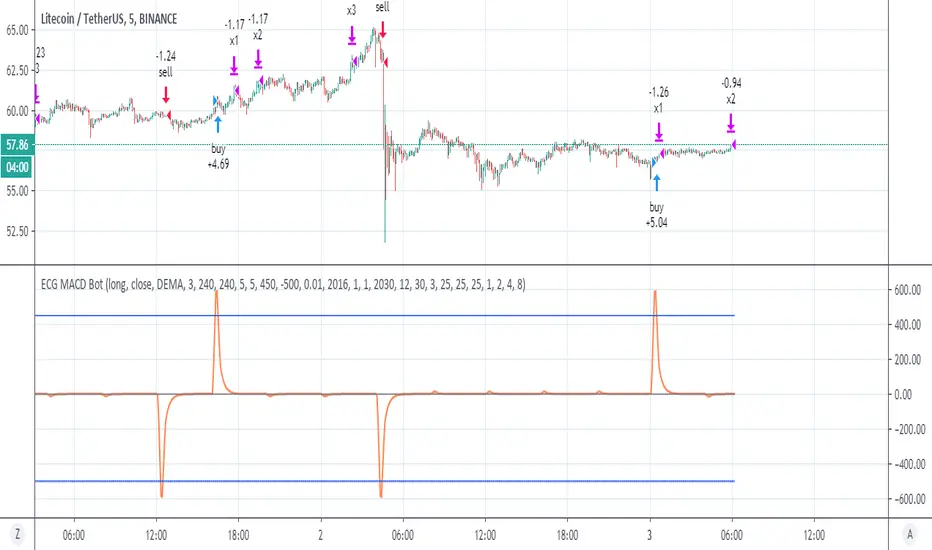
ECG MACD Botok this is hybrid of ECG bot -and MACD
in the ECG bot it combination of vwap and RSI
here I use different combination that may be even better which is a regular MACD and the rsi ECG bot .
you need to understand how this system work in order to make it best for you
first theory-
The ECG bot and this one base on simple but very strong idea which is there is differnt between repainted MTF to non repainted MTF
So if you put the same MTF 1 security (repaint ) and MTF 2 security (non repaint ) then the difference between them is the repaint distance.
so if i build model of buy force vs sell force on this diffrence.
SInce security is so dominant in the repaint model it force the signal to be at certain time . but also doing so it calculate the buy and sell force of the privoius day . which is very powerfull signal.
so puting to system of minus and plus the repaint model will produce signals. and due to security the strongest one will be when security finish it calculation at a specic time done by the MTF. so this is the "repaint signal" that make the repiant strategy to work so well.
my system is just to dump the unwanted noise and to keep the repaint ones. so by this reduce true repaint to be mimimum.
I hope you understand the idea . it not perfect but i thnk we are very close (i hope)
The MACD is your source so you can change the fast and slow to what ever you wish
the repaint system is conrol by the repaint control
if you use 60 min it need to to be 60 or more then that . if you use 30 min candle then use 30 etc
for each thing you do you must use the bar control to adjust it
as you need to adjust the upper treshold of the buy and the sell
for crypto this setting ok, you may change the lower treshold so use bar repaly to see where it was repaint and by that you can fix it
for stocks use 1 week MTF on 4 hour candle , increase repiant control to 240
for forex it same as crypto but you need to adjust to any coin that you use.
for further questions please let me know
once this project prove it idea that it safe i will make study version .
So do not put any 1 cent before you run all the test needed and live demo test to see how it work on real life
I put lower treshold on -450, on alts change it o -400