PinBar and Bloom Pattern Concept (Zeiierman)█ Overview
The Precision PinBar and Bloom Pattern Concept by Zeiierman introduces two new patterns, which we call the Bloom Pattern and the Precision PinBar Pattern. These patterns are used in conjunction with market open, high, and low values from different periods and timeframes. Together, they form the basis of the "PinBar and Bloom Pattern Concept." The main idea is to identify key bullish and bearish candlestick patterns around key levels plotted on the chart.
The key levels are the Open, High, and Low from the current and previous periods of the selected timeframe. Users can choose how many previous periods to be drawn on the chart.
█ How It Works
The indicator operates by analyzing market data over selected timeframes. It uses inputs such as previous period open-high-low lines, timeframe selections, and pattern detection settings like Symmetry Precision and Range Threshold. These parameters allow the indicator to identify specific market conditions, including symmetrical movements in price and significant price range deviations, which form the basis of the Bloom and Precision PinBar patterns.
Symmetry Signal:
Purpose: To detect symmetry in price movements based on a precision threshold.
How It Works: This function calculates the symmetry of high and low prices within the specified precision. It returns two boolean values indicating whether the high and low prices are within the symmetry precision.
BaselineBound Pattern:
Purpose: To identify bullish or bearish patterns based on a range factor.
How It Works: The function calculates whether the current close price is within a certain range of the high-low difference of the previous period. It returns bullish and bearish signals based on these calculations.
█ ● Bloom Pattern
The Bloom Pattern is a unique candlestick pattern designed to identify significant trend reversals or continuations. It's not a single candlestick formation but a combination of a few elements that signal a potential strong move in the market.
⚪ Previous and Current Candle Analysis: The Bloom Pattern looks at the relationship between the current candle and the previous one. It checks whether the current candle's body (the range between its opening and closing prices) fully encompasses the body of the previous candle. This condition is known as "embodying."
⚪ Baseline Bound: The Baseline Bound concept involves comparing the closing price to a range established by the high and low of the previous candle, adjusted by a factor (the rangeFactor). This helps in identifying if the current price is showing a bullish or bearish tendency relative to the previous period's price movement.
⚪ Symmetry Signal: Additionally, it uses the Symmetry Signal, which measures the symmetry between the high and low prices of two consecutive candles.
⚪ Bullish and Bearish Signals: The combination of these conditions (embodying, baseline bound, and symmetry) results in either a bullish or bearish signal. A bullish signal suggests a potential upward trend, while a bearish signal indicates a possible downward trend.
█ ● Precision PinBar Pattern
The Precision PinBar Pattern is a refined version of the traditional Pin Bar, a well-known candlestick pattern used in trading. This pattern focuses on identifying market reversals with a high degree of accuracy.
⚪ Identification of Pin Bars: The function first identifies a pin bar, characterized by a small body and a long wick. The long wick indicates a rejection of certain price levels, and the small body shows little change between the opening and closing prices.
⚪ Tail and Body Length Analysis: The script calculates the length of the bar's tail (wick) and compares it to the length of the body. A qualifying pin bar typically has a tail at least three times longer than its body, suggesting a strong rejection of prices.
⚪ Positioning and Thresholds:
Open-Close Position: The function checks whether the opening and closing prices are within a certain threshold of the high or low of the bar, which helps in distinguishing between bullish and bearish pin bars.
⚪ Baseline Bound and Symmetry: Like the Bloom Pattern, it incorporates Baseline Bound and Symmetry Signal concepts to validate the significance of the pin bar.
⚪ Bullish and Bearish Signals: Depending on these factors, a bullish or bearish pin bar is identified. A bullish PinBar suggests potential upward price movement, while a bearish PinBar indicates possible downward price movement.
█ How to Use
Using the Bloom and Precision PinBar patterns in conjunction with key market levels, such as previous highs and lows, can be a powerful strategy for traders. These market levels often act as significant points of support and resistance, and combining them with the patterns can offer strong trade signals. Here's how traders can effectively utilize these patterns:
Identifying Key Market Levels
Previous Highs and Lows: These are the highest and lowest points reached in previous trading periods and are often considered strong levels of resistance (in the case of previous highs) and support (in the case of previous lows).
Using the Bloom Pattern
Near Previous Highs (Resistance): If a Bloom Pattern emerges near a previous high, it could indicate a potential bearish reversal. Traders might interpret this as a signal to consider short positions, especially if the pattern shows bearish characteristics.
Near Previous Lows (Support): Conversely, a bullish Bloom Pattern near a previous low could suggest a trend reversal to the upside. This could be a signal for traders to consider long positions.
Using the Precision PinBar Pattern
Precision PinBar at Resistance: A bearish Precision PinBar appearing near a previous high can be a strong signal for a potential downward move. This setup is often used by traders to enter short positions, anticipating a price rejection at this resistance level.
Precision PinBar at Support: Similarly, a bullish Precision PinBar at or near a previous low suggests that the market is rejecting lower prices, indicating potential upward momentum. This is typically used by traders as a cue to go long.
█ Settings
Previous Open-High-Low Lines: Determine the number of historical periods to analyze. Settings include toggling the visibility of lines and labels and specifying the number of periods.
Timeframe & Current Period: Select the timeframe for current market analysis. Options include different timeframes (e.g., 1H, 1D) and customization of line styles and colors.
Pattern Settings: Adjust the Symmetry Precision and Range Threshold to fine-tune the indicator's sensitivity to specific market movements.
Bloom & Precision PinBar Pattern: Enable or disable the detection of specific patterns and customize the visual representation of these patterns on the chart.
-----------------
Disclaimer
The information contained in my Scripts/Indicators/Ideas/Algos/Systems does not constitute financial advice or a solicitation to buy or sell any securities of any type. I will not accept liability for any loss or damage, including without limitation any loss of profit, which may arise directly or indirectly from the use of or reliance on such information.
All investments involve risk, and the past performance of a security, industry, sector, market, financial product, trading strategy, backtest, or individual's trading does not guarantee future results or returns. Investors are fully responsible for any investment decisions they make. Such decisions should be based solely on an evaluation of their financial circumstances, investment objectives, risk tolerance, and liquidity needs.
My Scripts/Indicators/Ideas/Algos/Systems are only for educational purposes!
캔들스틱 분석

Crypto Candlestick Patterns - CN VersionIntroduction:
The candlestick chart has been used for centuries since the Japanese applications. Based on the candlestick charting, people developed candle pattern analysis. Now we have tons of books or articles illustrating the usage of reversal patterns and continuation patterns, and computers provide a faster and preciser way to recognize these pattern.
Originally we have a common *All Candlestick Patterns* indicator to use. This indicator works well for most of the markets or commodities including stocks and futures. However, for cryptocurrency market, quite a few patterns are not suitable anymore. For example, crypto markets are continuously running 7x24hrs and the big coins with good volume tend to have almost continuous price in commonly used time periods. Hence, original patterns with "window" or "jump" concepts are usually not applied to crypto.
For these issues, I modified the original *All Candlestick Patterns* indicator and introduced the Chinese version for people speaking such language.
Like most of the other indicators, I personally do not recommend anyone to simply follow the patterns it shows to enter the market. You may take these recognized patterns as a reference, and further actions on trading should be done with several other tools, such as MACD, RSI, Stochastic and etc.
Usage:
The application of this indicator is basically the same as the original *All Candlestick Patterns* and you will get an automatically generated pattern recognition by your computer system.
There are a few parameters to adjust for the indicator:
Trending Detection Settings: Here you can choose SMA-Fast, SMA-Fast/Slow or None detecting options to recognize the current market trend. This is a minor improvement from the original indicator and you can choose your preferred trending detecting settings by changing the length of SMA.
Candlestick Settings: You may adjust the rules to recognize the properties of candlesticks. I add a "perturbation" parameter here, which actually is an error tolerance for pattern recognition. Some seemingly pattern may not fulfill the strict rules of classic candlestick patterns, but we may recognize them by watch the charting on our own. Hence this error tolerance may show more potential patterns from the charting.
Plot Settings: It is the usually colour choice and providing options for bullish/bearish.
Pattern Settings: Here you can select the patterns that you would like to see from the charting. You can pick the preferred reversal patterns or choose to show all the patterns. It's all up to you!
Features:
Language Translation: Since this is a Chinese language version. I have replaced all the English explanation of patterns to Chinese ones. Move your mouse to the label, you will find a brief intro of the pattern and a notice about bullish or bearish signals it indicates.
Alerts: As the same as the original one, we will have the alert options from this indicator. All the alerts and their messages are Chinese. You can activate alerts based on this indicator from the alert management section, as the same as many other indicators you have used before.
Future Improvements:
For now I am satisfied with the work I have done, and I may apply it to several charts. It's welcome for any users to take a look at the codes and put modifications or improvements towards it. Currently most of the comments in the code are in Chinese language, since basically it's for Chinese speaking users, while the code itself and the parameter names should be pretty easy to understand in English. (I have been using English for writing in the past 8 years, hence this introduction is in English as well.)

Inside Bars/Candles [CodeCraftedTrading]This Pine Script indicator is designed to identify and visually represent inside bars or candles. Here's a breakdown of its features and functionality:
1. Inputs:
insideCandlesColor: Color of the inside bars or candles.
highColor: Color of the horizontal line representing the high of the inside bar.
lowColor: Color of the horizontal line representing the low of the inside bar.
showHighLowLabel: Option to display labels for the high and low prices.
2. Logic:
The script checks for the conditions of an inside bar:
high < high and low > low
If an inside bar is detected and is not already in the range:
* Stores the high and low prices of the previous bar.
* Records the parent bar index and sets the broken flag to false.
If the current bar's high exceeds the stored high or the low falls below the stored low, the broken flag is set to true.
If the current bar is within the stored high and low range, it is considered in-range.
The script then dynamically plots horizontal lines at the high and low prices of the parent bar until the inside bar is broken.
3. Visualization:
The inside bars are colored based on the insideCandlesColor.
Horizontal lines are drawn at the high and low prices of the parent bar within the inside bar.
Optional labels display the rounded values of the high and low prices.
4. Usage:
Apply the script to your chart.
Adjust the input parameters according to your preferences.
The indicator will highlight inside bars with colored bars and draw lines representing the high and low prices. Labels are optional.
5. Note:
Inside bars are bars where the entire price range is within the high and low of the previous bar.
The script uses historical bar information and visualizes the inside bars dynamically on the chart.

CT - Candle TrendHighlight candle tails in a trend in order to find previous area of resistance or support.
Recommended for D, W or higher timeframes.

Hammer and inverted Hammer
The "Hammer and Inverted Hammer" indicator is straightforward and effective. It automatically spots key candlestick patterns for you, making it easier to see potential market turns. You can also adjust a few settings to fit your trading style. Simple, yet quite handy for traders!
Alerts for Hammer Pattern: When the script identifies a Hammer pattern, it can trigger an alert. This is particularly useful if you're looking for potential bullish reversal signals and don't want to miss them.
Alerts for Inverted Hammer Pattern: Similarly, when an Inverted Hammer pattern is detected, the script can also trigger an alert. This is helpful for spotting potential bearish reversal signals.
SETTINGS EXPLAINED
Minimum Lower Tail Length (%): This setting allows you to define what percentage of the total candle size should be considered a significant lower tail. This is important for identifying the Hammer pattern.
Number of Consecutive Candles (for Lower Tails): This input lets you choose how many consecutive candles with significant lower tails must be present to identify a pattern.
Percentage of Candle Below Previous Low: This setting determines what percentage of the candle's range must extend below the lowest low of a specified number of previous candles. It's used to assess the significance of a Hammer pattern.
Number of Previous Candles for Lowest Low: This decides how many previous candles the script should look at to calculate the lowest low, which is then used in the Hammer pattern analysis.
Minimum Upper Tail Length (%): Similar to the lower tail setting, this defines the significant length of an upper tail, used for identifying the Inverted Hammer pattern.
Number of Consecutive Candles (for Upper Tails): This input is for setting how many consecutive candles with significant upper tails are required to confirm an Inverted Hammer pattern.
Percentage of Candle Above Previous High: This setting is used to determine how much of the candle's range must be above the highest high of a set number of previous candles, aiding in the identification of the Inverted Hammer pattern.
Number of Previous Candles for Highest High: It specifies the number of past candles to consider for calculating the highest high, which is important for the analysis of Inverted Hammer patterns.
These settings allow you to customize how the script identifies Hammer and Inverted Hammer patterns, making it adaptable to different trading strategies and market conditions.

CBC FlipThis is an indicator for the Candle By Candle (CBC) Flip strategy as created by @MapleStax
It’s useful to traders because it’s a simple approach to gauge if bulls or bears are in control for any particular candle. The logic is as follows:
If the most recent candle close is above the previous candle high, then bulls are in control.
If the most recent candle close is below the previous candle low, then bears are in control.
If neither of these 2 conditions are met, then whoever was already in control remains in force until one of the 2 conditions is met and the sentiment is flipped, hence the name CBC Flip.
My script is original because there are no other CBC Flip scripts available on TV. This is the first, which is why I created it, to help other traders benefit from the power of CBC Flips.
The indicator output is simply interpreted as follows:
Triangle up = bulls in control
Triangle down = bears in control
In my experience this script is best used on the 5 or 10 minute time frames, as it helps to keep you in the trade for the bigger moves once a trend is established, while not getting shaken out from the “noisy” up/down candle price action of lower time frames like the 1 minute.
I’ve also had more success with this indicator when only taking long trades once the green triangle appears and price is above VWAP, and only taking short trades once the red triangle appears and price is below VWAP.
Trend FinderThe "𝙏𝙍𝙀𝙉𝘿 𝙁𝙄𝙉𝘿𝙀𝙍" indicator is a powerful tool designed to detect trends and identify potential reversal points in asset prices. It operates as both a trend-following and mean reversion indicator, offering insights into market movements.
Trend Identification:
Trend Detection:
This indicator primarily identifies trends in asset prices.
When the "𝙏𝙍𝙀𝙉𝘿 𝙁𝙄𝙉𝘿𝙀𝙍" value is above the middle line, it typically indicates an upward trend in the asset's price.
Color Coding: During an upward trend, the bars are colored green, signaling strength in the upward movement. Conversely, during a downtrend, the bars turn red, indicating a potential downward movement in the asset's price.
Calculation Process:
Moving Averages: The calculation involves using multiple Simple Moving Averages (SMAs) based on the open and close prices of the asset.
Incremental SMA Lengths: These SMAs are calculated with increasing lengths, creating a series of comparisons between closing and opening SMAs. If the closing SMA exceeds the opening SMA, a value of 1 is assigned; otherwise, it's assigned as 0.
Aggregation: All these SMA values are compiled into an array and processed to derive an average, emphasizing the trend direction and strength.
Application:
Trend Strength: The indicator's value reflects the overall strength and direction of the trend. Higher values suggest an end or reversing of trend, while lower values what crosses over or under Midline may indicate a trend changing and indicate incrising of trend strength.
Reversal Indication: Besides identifying trends, it can also serve as a mean reversion indicator, potentially pinpointing potential tops and bottoms in the market.
Midline: Additional in settings can be changed a position of midline to up or down to your personal preference.
The "𝙏𝙍𝙀𝙉𝘿 𝙁𝙄𝙉𝘿𝙀𝙍" indicator amalgamates moving averages and trend analysis, offering a comprehensive view of market trends and potential reversal points. Its adaptability through parameter adjustments allows for fine-tuning to suit various market conditions.

Trend-based Price Action StrategyThis is a strategy script that combines trend-based price action analysis with the Relative Strength Index (RSI) and Exponential Moving Averages (EMA) as trend filters. Here's a summary of the key components and logic:
Price Action Candlestick Patterns:
Bullish patterns: Engulfing candle and Morning Star.
Bearish patterns: Engulfing candle and Evening Star.
RSI Integration:
RSI is used to identify overbought and oversold conditions.
EMA Trend Filter:
Three EMAs with different periods: Fast , Medium and Slow.
Long trend condition occur when the fast EMA is above the medium and the medium is above the slow EMA.
Short trend condition occur when the slow EMA is above the medium and the medium is above the fast EMA.
Long entry conditions: RSI is oversold, RSI is decreasing, bullish candlestick pattern, and EMA trend filter conditions are met.
Short entry conditions: RSI is overbought, RSI is decreasing, bearish candlestick pattern, and EMA trend filter conditions are met.
Exit conditions:
Take profit or stop loss is reached.
Plotting:
Signals are plotted on the chart when entry conditions are met.
EMAs are plotted when the EMA trend filter is enabled.
This script aims to capture potential trend reversal points based on a combination of candlestick patterns, RSI, and EMA trend analysis.
Traders can use this script as a starting point for further customization or as a reference for developing their own trading strategies. It's important to note that past performance is not indicative of future results, and thorough testing and validation are recommended before deploying any trading strategy.

Alert on Candle CloseAlert on Candle Close is a simple indicator allowing you to set alerts when a candlestick closes.
Instructions for use
From the chart window, click on "Indicators" and search for "Alert on Candle Close".
Click on "Alert on Candle Close" to add the indicator to your chart. Click on the star icon to add it to your favourites to easily access later.
Set your chart timeframe to the timeframe you wish to alert on. For example, to create an alert when a 4h candlestick closes, set your chart to the "4h" timeframe.
Hover over the "Alert on Candle Close" indicator which has been added to your chart and click the ellipsis "..." icon, then click "Add alert on Alert on Candle Close" or use the keyboard shortcut "Alt+A" from the chart.
In the alert pop-up window, make sure "Condition" is set to "Alert on Candle Close" and "Trigger" is set to "Once Per Bar".
Optionally, you can set a custom expiry for the alert, give the alert a name and customise the alert message. You can configure notification settings from the "Notifications" tab.
Click "Create" and your alert is set up!
Each alert is tied to the timeframe and chart it was created on, so you can change the timeframe or asset and create more alerts by repeating the above process.
Note : this indicator is only designed to work with time-based chart types, such as Bars, Candles or Heikin Ashi. It will not work for non-time charts such as Renko.
FAQs
Why do my alerts sometimes not fire as soon as the candle closes?
This is a limitation with Pine Script's execution model. Indicators are calculated whenever a price or volume change occurs i.e. when a new trade happens. For illiquid or slow moving markets, there may be some time between when a candle closes and the next trade, leading to a delay in the alert triggering. The alert will trigger on the next tick of data on the chart.
Why can't I create more alerts?
TradingView has a limit on the number of active technical alerts you can have based on your membership tier. To configure more alerts, consider upgrading your TradingView plan to a higher tier. See a comparison of TradingView plans at www.tradingview.com
My alert only fired once, how can I get it to keep working?
When configuring the alert in the alert pop-up window, make sure you set "Trigger" to "Once Per Bar" and "Expiration" to "Open-ended alert".

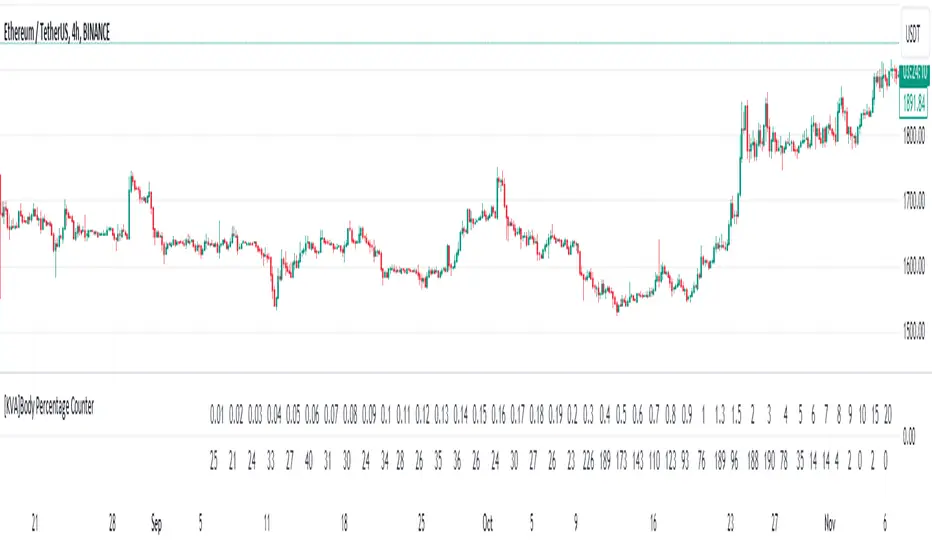
[KVA]Body Percentage Counter This indicator presents a comprehensive view of the historical candle data within user-defined body percentage ranges. Each column represents a specific body size percentage threshold, starting from as low as 0.01% and extending up to 20%.
The rows categorize candles by their closing and opening price differences, effectively sorting them into green (bullish) and red (bearish) candles based on whether they closed higher or lower than their opening prices.
First Row of the table is the bu
For developers, this table can be immensely useful in determining stop-loss ranges. By analyzing the frequency of candles that fall within certain body percentage ranges, developers can better understand where to set stop-loss orders. For instance, if a developer notices a high frequency of candles with body sizes within a specific percentage range, they may choose to set their stop-loss orders outside of this range to avoid being stopped out by normal market fluctuations.
Moreover, the indicator can be used to:
Volatility Assessment : The indicator can be used to gauge market volatility. Smaller bodies may indicate consolidation periods, while larger bodies might suggest more volatile market conditions.
Optimize Trading Strategies : Adjust entry and exit points based on the prevalence of certain candle sizes.
Risk Management : Determine the commonality of price movements within a certain range to better manage risks.
Backtesting : Use historical data to backtest how different stop-loss ranges would have performed in the past.
Comparative Analysis : Traders can compare the frequency of different body sizes over a selected period, providing insights into how the market is evolving.
Educational Use : For new traders, the indicator can serve as an educational tool to understand the implications of candlestick sizes and their relationship with market dynamics
The data provided in this output can guide developers to make more informed decisions about where to place stop-loss orders, potentially increasing the effectiveness of their trading algorithms or manual trading strategies.
The output of the " Body Percentage Counter" indicator is organized into a table format, which can be broken down as follows:
Header (First Row) : This row lists the body percentage thresholds used to categorize the candles. It starts from 0.01% and increases incrementally to 20%. These thresholds are likely set by the user and represent the range of candle body sizes as a percentage of the total candle size.
Green Candle Count (Second Row) : This row displays the count of green candles—candles where the close price is higher than the open price—that fall within each body percentage threshold. For example, under the column "0.01", the number 25 indicates there are 25 green candles whose body size is 0.01% of the total candle size.
Red Candle Count (Third Row) : This row shows the count of red candles—candles where the close price is lower than the open price—for each body percentage threshold. The numbers in this row reflect the number of red candles that match the body percentage criteria in the corresponding column.
Total Candle Count (Fourth Row) : This row sums the counts of both green and red candles for each body percentage threshold, providing a total count of candles that have a body size within the specific range. For instance, if under "0.01" the green count is 25 and the red count is 26, then the total would be 51.
This organized data representation allows users to quickly assess the distribution of candle body sizes over a historical period, which is especially useful for determining the frequency of price movements that are significant enough to consider for stop-loss settings or other trade management decisions.
Heat profileA trader once told me that top wicks equals sell interest and bottom wicks equals buy interest. If that's true then this indicator tries to organize and visualize this idea.
It uses transparent boxes to give the impression of a heat map. Due to limitations of my own skill and possibly pinescript it is not possible to render it in a useful manner using different colors that depicts buy and sell interests respectively. This means it works more like a volume profile in that it mixes the buy and sell interest together in the heat map. This can still be helpful because it help traders focus their attention on areas other than the current price candle.
In my limited time of using it, it seems like on the large timeframes the highlighted areas is where the price wants to go, and on small time frames the darkest areas is where the price wants to go. But i will leave it up to any user to spot and use their own patterns with the indicator.
Last but not least, the indicator only uses the last 50 candles, which can be too little on a small timeframe. Unfortunately the way i have done it this limitation is hardcoded in the script due to how pinescript works, by editing the code you can increase it. (Put max_boxes_count = x after overlay = true. Maximum number is 500)
Hope you enjoy. Have a nice day.

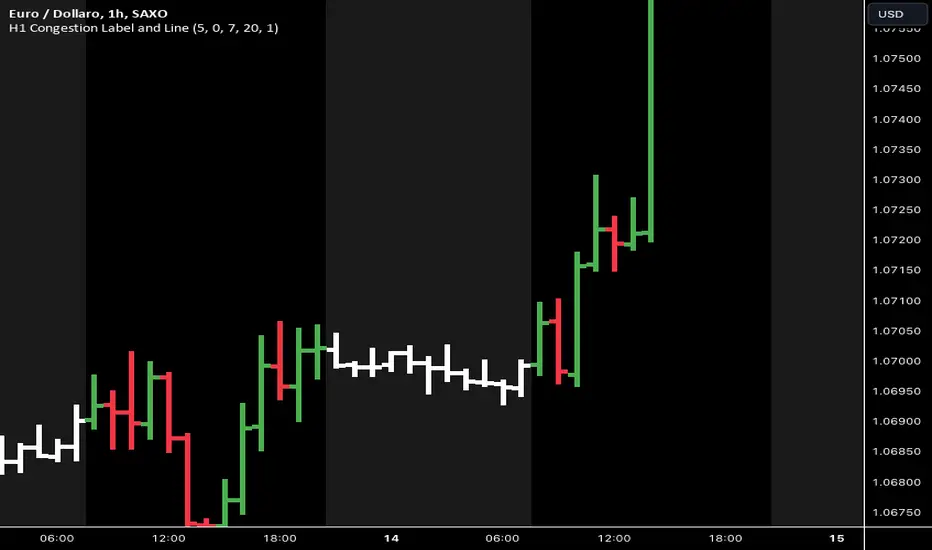
H1 Congestions V-1.0This indicator is designed to highlight the night session, from 20:00 to 07:00 in the morning . The purpose is to study the congestion ranges. This is a useful condition to anticipate the volatility break out that occurs in the morning, driven by the European markets.
Below is the logic I have applied:
First of all, I defined a directive to activate the highlighter . I had to activate a highlighter for today's session and another one for yesterday's session, and I included fields to potentially modify the time range. I also added the possibility to change the time zone, as I did not understand the time zone of the TradingView server.
Then, I added a directive to color the night bars in white, from 20:00 to 07:00 . For this function too, I added fields to modify the range. Finally, I inserted labels to count the range of the bars in pips, but only for bars over 20 pips. However, I was not able to correct the position to prevent the label from overlapping with the bars. If you have any suggestions on this issue, I would be grateful.
Trend Bar Dow Theory V-1.0The indicator is designed to signal the presence of a trend bar with reduced profit-taking the following day. Below, I explain the logic that I have defined for this first version.
The guidelines I provided are as follows: We identify a trend bar, if it sets a market change, between opening and closing, equal to or greater than 50 pips . This first guideline is used to find a day with good liquidity , which usually leads to a trend bar.
If the first guideline is met, the indicator should change the bar color to white . This way, we can proceed to the second guideline, to detect the presence of reduced profit-taking.
The second guideline should indicate the presence of reduced profit-taking, as explained by Dow Theory, to find a trend context with potential to exploit. Therefore, the second guideline involves coloring the bars near the trend bars in grey, if they have a range equal to or less than 30 pips.
Dow Theory states that a market in trend measures reduced profit-taking, within 33%, up to a maximum of 50% compared to the previous trend bar, but I have not yet been able to make Pine Script calculate the percentage value. If you have any suggestions, I would be grateful.

Japanese Candle Patterns Detector in Potential Price ZoneThis script would find the 8 famous "Japanese Candle Stick Patterns" in your chart.
Please be aware it find patterns in "Potential price zones" only, which help you to avoid none-important patterns during a price trend.
I used RSI and ATR in my codes to find best candle forms and price conditions.
*** This indicator shared before but without source code. According to follow requests, I publish it again with source codes. I hope it helps you in trading journey...
Bellow patterns are detecting:
Hammer | ShootingStar | Engulfing Candle | Doji | Tweezers Top/Buttom | Three White Soldiers/Three Black Crows | Marubozu | Harami
* You can select your preferred patterns from indicator setting.
* Pattern names are abbreviated for better view on chart.
* Separate alerts for different type of candles for whom looking for a specific candle pattern
* Main alert which notify about every kind of candle patterns detect in a chart

BarChangeDeltaThe "BarChangeDelta" indicator, facilitates the calculation of price delta or percent changes between user-defined start and end points within the current or between preceding and current bars. It offers several customizable options to fit various trading strategies.
// ================================================== INFO ==================================================
This indicator provides the following key functionalities:
- Two Modes:
* PreviousToCurrentBarDelta: Compares user-selected start points from the previous bar to the end points of the current bar.
* CurrentBarDelta: Compares user-selected start and end points within the current bar.
- Start Point/End Point Customization: Allows users to define the source for start and end points used in the delta calculations.
- ABS Mode: Option to display only absolute values, reflected on the histogram drawn.
- Show delta in percents: Enables users to calculate delta in percentage changes instead of price delta.
- Moving Average (MA) Plot: A plot of the MA of the last user-defined number of delta prices or percents.
// ================================================== NOTES ==================================================
The "BarChangeDelta" indicator finds practical application in various trading scenarios. It can be particularly useful for assessing daily price changes between open/close or high/low for determining strike prices, especially for 0DTE trading.

Trend Pinbar PT49 by CuancuanIdea Behind:
Buying the short-term trend that shows a pin-bar candlestick pattern. Meant to be traded on a daily chart / higher timeframe.
To determine the short-term trend we use short EMA such as 8-16-30 and check the slope of each one, and definitely, the shorter one must be above the longer one for an uptrend. Vice versa for a downtrend.
To determine a pin-bar candlestick, I calculate that the body size (open to close) is at maximum a-third of the candle size (high to low). Besides that, I ensure that the close of the candle is above the shortest MA for bullish and below it for bearish.
As extra filters to reduce trade numbers:
1. Longer MA Filter = You can turn it off if you think the higher timeframe filter is unnecessary.
2. Slope Filter = To ensure the slope of the shorter MA is steeper rather than the mid-MA.
3. Size Filter = To check whether the overall candle size (high to low) is bigger than the ATR number. When the size filter is turned on, it removes small insignificant candles.
PS: Don't trade anything live unless you find it comfortable after backtesting it by yourself .

Multiple Vertical LinesThis script allows you to have multiple vertical lines on your chart (for seeing how price action performs around certain times of interest to you.
You can adjust the code to add new lines or colours as you wish (or comment out any that are there if they don't suit you.
There is also a shaded area, so you can use that for delineating an amount of time.
The indicator is currently set to New York time, but you can adjust this to suit you.

Highlight BarHighlight bars in the past. I use this to show the start of moving average calculations - very helpful to anticipate the change in slope of moving averages. You can change color as well as how far back in time to highlight. The defaults are 20, 50 and 200.
I learned of the idea from Brian Shannon - thanks!

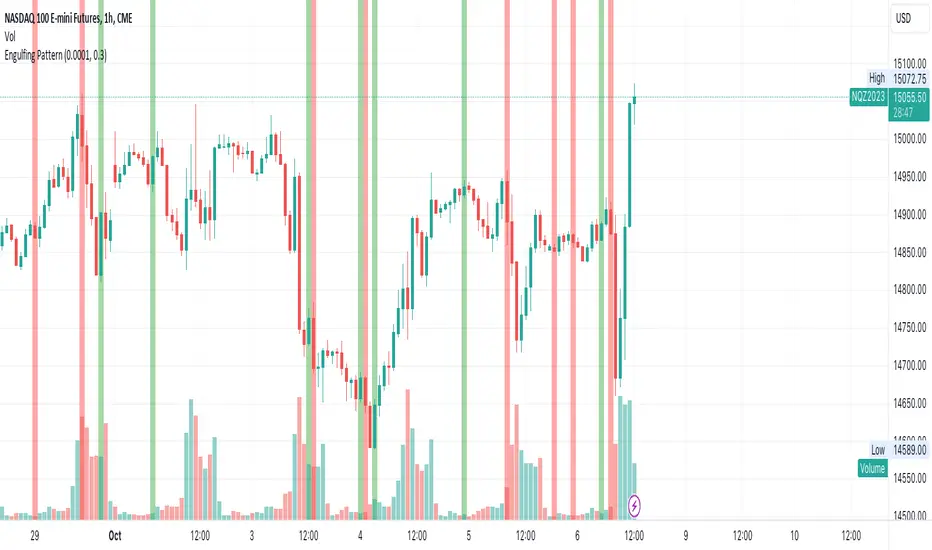
Custom Engulfing PatternThis script identifies bullish and bearish engulfing candlestick patterns based on user-defined criteria. It highlights the engulfing patterns on the chart for easy visualization. The script allows for customization of certain parameters to fine-tune the engulfing pattern detection according to the user's preferences.
Features:
Wick Ratio: Define a ratio to ensure that the body of both the current and previous candles comprises a significant portion of the total candle range.
Opposite Candle Condition: Ensures that the current and previous candles are of opposite types (one bullish and one bearish).
Body Size Relative to Previous Candles: Ensures that the body of the current candle is larger than the average body size of a specified number of previous candles.
Body Size Comparison: Ensures that the body of the engulfing candle is not more than 150% of the body of the previous candle.
Color Highlighting: Highlights bullish engulfing patterns in green and bearish engulfing patterns in red on the chart for easy identification.
Parameters:
tolerance (default: 0.0001): A tolerance value to account for minor price discrepancies when comparing candle open and close prices.
wick (default: 0.5): A ratio to define the significance of the candle body relative to the total candle range.
prevCandles (default: 6): Specifies the number of previous candles to consider when calculating the average body size for the body size relative condition.
Usage:
Adjust the tolerance, wick, and prevCandles parameters as needed to fine-tune the engulfing pattern detection to suit your trading style or the specific characteristics of the asset being analyzed. The script will highlight engulfing patterns on the chart, allowing for quick visual identification of potential trading opportunities based on these classic candlestick patterns.
Please note that this script is intended for educational and illustrative purposes. It should not be used as financial advice. Always conduct your own analysis and consult with a financial advisor before making any trading decisions.
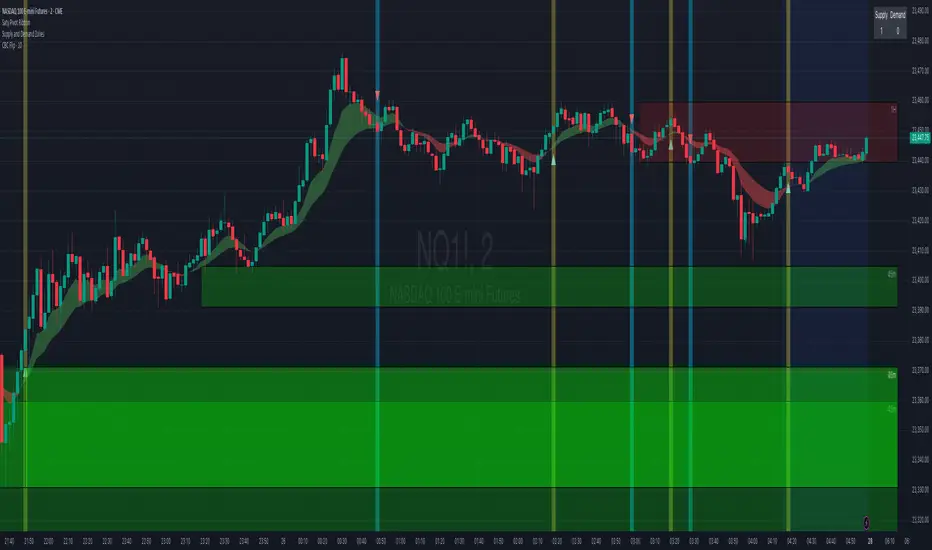
Liquidity Spike PoolThe “Liquidity Pools” indicator is a tool for market analysts that stands out for its ability to clearly project the intricate zones of manipulation present in financial markets. These crucial territories emerge when supply or demand takes over, resulting in long shadows (wicks) on the chart candles. Imagine these regions as "magnets" for prices, as they represent authentic "liquidity pools" where the flow of money into the market is significantly concentrated. But the value of the indicator goes beyond this simple visualization: these zones, when identified and interpreted correctly, can play a crucial role for traders looking for profitable entry points. They can mutate into important bastions of support or resistance, providing traders with key anchor points to make informed decisions within their trading strategies.
A key aspect to consider is the importance of different time frames in analyzing markets. Larger time frames, such as daily or 4h, tend to host larger and more relevant liquidity zones. Therefore, a successful strategy might involve identifying these areas of manipulation over longer time frames through the use of this indicator, and then applying these findings to shorter time frames. This approach allows you to turn manipulation zones into crucial reference points that merit constant surveillance while making trading decisions on shorter time frames.
The indicator uses color to convey information clearly and effectively:
- Dark blue lines highlight candles with significant upper wick, signaling the possible presence of an important manipulation area in the considered area.
- Dark red lines are reserved for sizable candlesticks with significant upper wick, emphasizing situations that are particularly relevant to traders.
- Dark gray lines highlight candles with significant lower wick, providing a valuable indication of manipulation zones where the bid may have prevailed.
- White lines highlight sizable candlesticks with significant lower wick, clearly indicating situations where demand has been predominant and may have helped form a liquidity pool.
This indicator constitutes an important resource for identifying and clearly displaying candles with significant wicks, allowing traders to distinguish between ordinary market conditions and circumstances particularly relevant to their trading strategies. Thanks to the distinctive colors of the lines, the indicator offers intuitive visual guidance, allowing traders to make more informed decisions while carrying out their analyses.

Tops & Bottoms - Time of Day Report█ OVERVIEW
The indicator tracks and reports the percentage of occurrence of daily tops and bottoms by the time of the day.
█ CONCEPTS
At certain times during the trading day, the market reverses and marks the high or low of the day. Tops and bottoms are vital when entering a trade, as they will decide if you are catching the train or being straight offside. They are equally crucial when exiting a position, as they will determine if you are closing at the optimal price or seeing your unrealized profits vanish.
This indicator is before all for educational purposes. It aims to make the knowledge available to all traders, facilitate understanding of the various markets, and ultimately get to know your trading pairs by heart.
Tops and bottoms percentage of occurrence on EURGBP (London time).
Up days versus down days on EURUSD (London time).
█ FEATURES
Selectable time zones
Present the column chart in your local time zone (or other market participants).
Configurable time range filter
Select the period to report from.
Day type filter
Analyze all days, or filter only up days or down days.
█ HOW TO USE
Plot the indicator and visit the 1-hour or 30-minute timeframe.
█ NOTES
Timeframe choice
The 1-hour timeframe produces a higher number of days sampled. Prefer the usage of the 30-minute timeframe when your market starts at 9:30 AM.
Daylight Saving Time (DST)
The exchange time and geographical time zone options may observe Daylight Saving Time, unlike UTC+0.

Extended Hour CandleThe Extended Hour Candle shows extended hour candle formations on the Daily chart. This indicator can be useful for those who want to analyse price movements during extended trading sessions without switching to intraday charts with "Extended trading hours" enabled.
How to Use:
Add the Extended Hour Candle indicator to a TradingView chart.
Adjust the color settings according to personal preferences, using the options to set the desired colors for up and down candles.
See the Candle during extended trading hours on the Daily chart

Buy/Sell BoxThis indicator tries to identify the points where the price exceeds or falls below a rectangle based on the opening and closing prices of the previous period, the creation of the boxes occurs when a doji is detected therefore it will calculate the coordinates of the rectangle that will be drawn around it, therefore the indicator offers buy or sell signals based on this logic. Specifically, the buy signal is generated if the closing price is above the top of the rectangle and satisfies some previous price conditions while the sell signal is generated if the closing price is below the bottom of the rectangle and satisfies some conditions of previous prices within a further threshold based on the Ema 150.
Lines are then drawn on the graph to visually display the extreme price levels, which can be useful for any confirmation of buy and sell signals, Stop Loss and Take Profit, Trend Filter (to visually understand if the trend is bullish or bearish)
A potentially effective trading strategy could involve identifying buy and sell signals near the extreme price level lines drawn by the indicator. This approach can be used to try to improve the accuracy of your trading signals and make more informed decisions. For example:
When you receive a buy or sell signal based on the dojis and rectangles generated by the indicator, check whether the price is also near one of the extreme price level lines. If you are receiving a buy signal and notice that the current price is near a low of the lower level line, this may further confirm the buying opportunity, as the price is near a significant resistance level. On the contrary, if the sell signal was close to a maximum price level it could confirm an excellent short entry.
It is also possible to use the boxes as reference points to set the stop loss and take profit levels. If you are entering a buy position, you might consider setting your stop loss just below an upper line of the last box. Additionally, you may want to set your take profit near a higher price level if you are looking to maximize profits. This will help manage risks and protect your capital.
