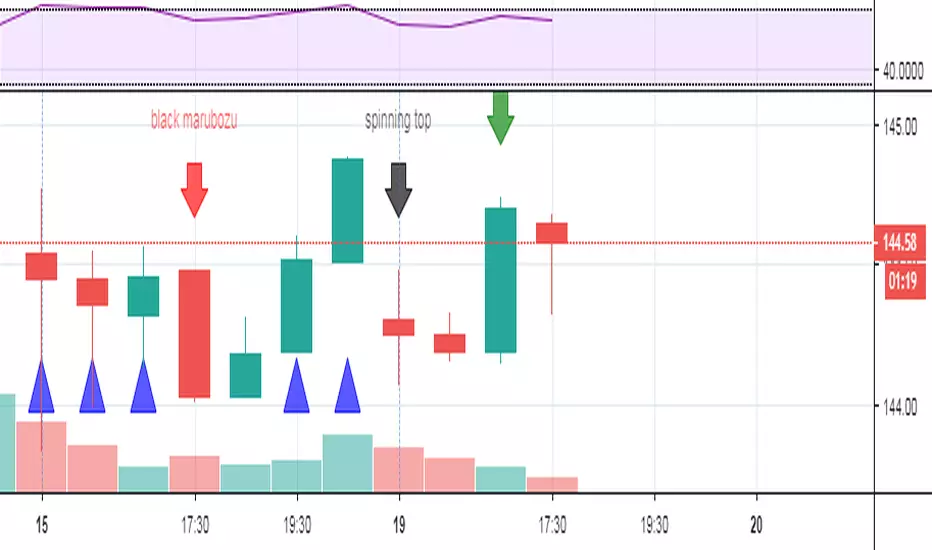
Candlestick identificationThis is a first draft of a candlestick pattern recognition study. As of now individual candles and some two-candle patterns can be identified. More to come ...
Candle
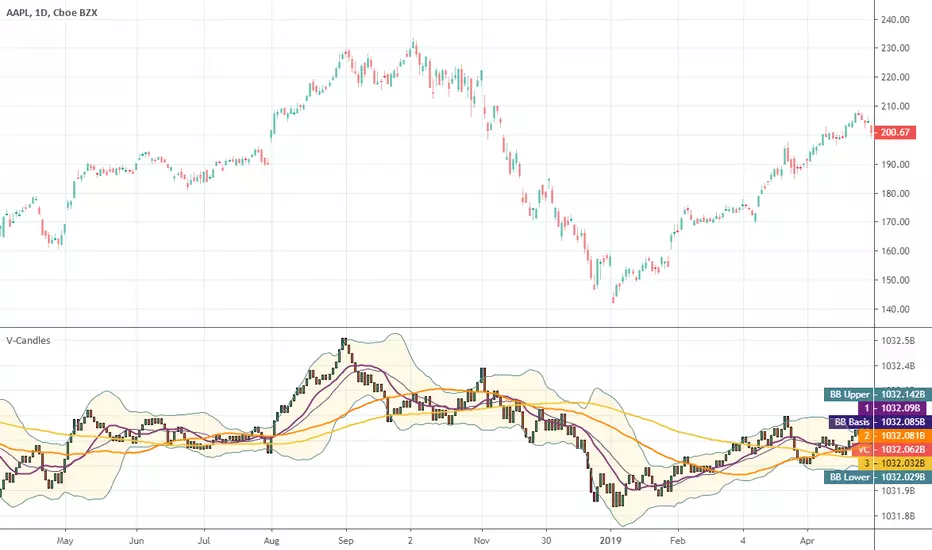
MA CandlesOHLC calculated with a moving average.
You can replace sma with anything. EMA, Hull, sma(sma(sma(sma(close, etc.
You could also make it look clean like Heikin Ashi candlesticks if you include min/max for low/high wicks on candles.

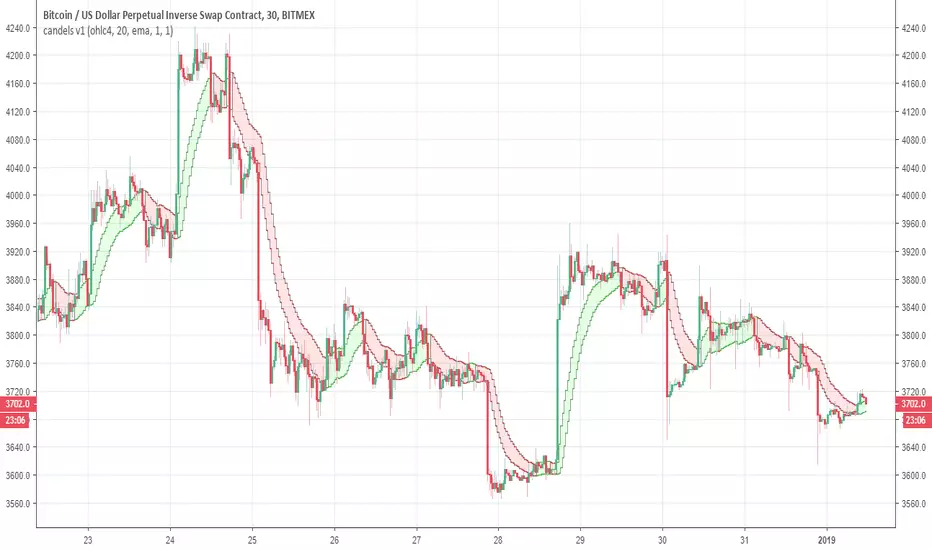
candels v1So this is a candel version with different smoothing methods (EMA ,KAMA 'WMA , ALMA etc)
you have option for MTF in the setting
the length is set to 1 -change it to the size you want (20 for example)
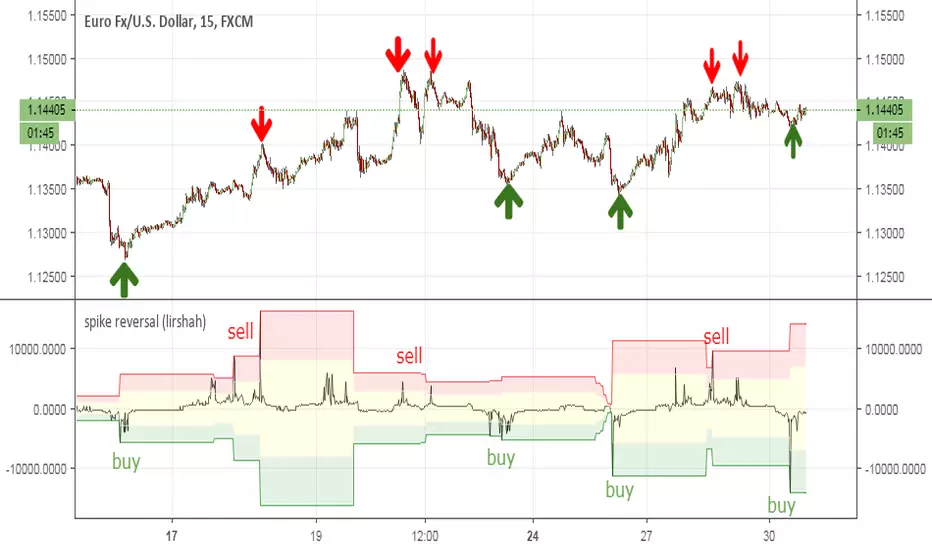
spike reversal (lirshah)spike reversal indicator is an innovation of lirshah programming team,
this indicator is combination of several indicators with candle sticks patterns.
good accuracy on reverse points and ease of interpretation are strong points of this indicator.
calculation of this indicator is based on opening price of each bar which means the value of indicator is constant on each candle and no repaints occur.
Directional filterThe idea is to show simply through colors "stronger or weaker" the relevance of candles in the current direction of the asset.
the indicator was made to be used in the graphics of 5m and 15m. based on the SMA20 already indicated previously and with a SMA20 of the graph of 60m.
candles will have their colors modified according to their relevance in the current trend, "A" through "D", where "A" is the strongest and "D" is the weakest.
Conditions:
Buy candle A: price closes above SMA20 (5m or 15m) and above SM20 of 60m.
Buy candle B: price closes above the SMA20 (5m or 15m) and below the SMA20 of 60m.
Buy candle C: Price closes below the SMA20 (5m or 15m) and above the SMA20 60m.
Buy candle D: price closes below the SMA20 (5m or 15m) and below the SMA20 of 60m.
Sell candle A: price closes below the SMA20 (5m or 15m) and below the SMA20 of 60m.
Sell candle B: price closes below the SMA20 (5m or 15m) and above the SMA20 of 60m.
Sell candle C: price closes above the SMA20 (5m or 15m) and below the SMA20 of 60m.
Sell candle D: price closes above the SMA20 (5m or 15m) and above the SMA20 of 60m.
Note 1: SMA8 and SMA200 are also inserted (but they do not interfere with the indicator)
Note 2:
I will leave an image with the colors that represent the relevance of each candle.
imageshack.com
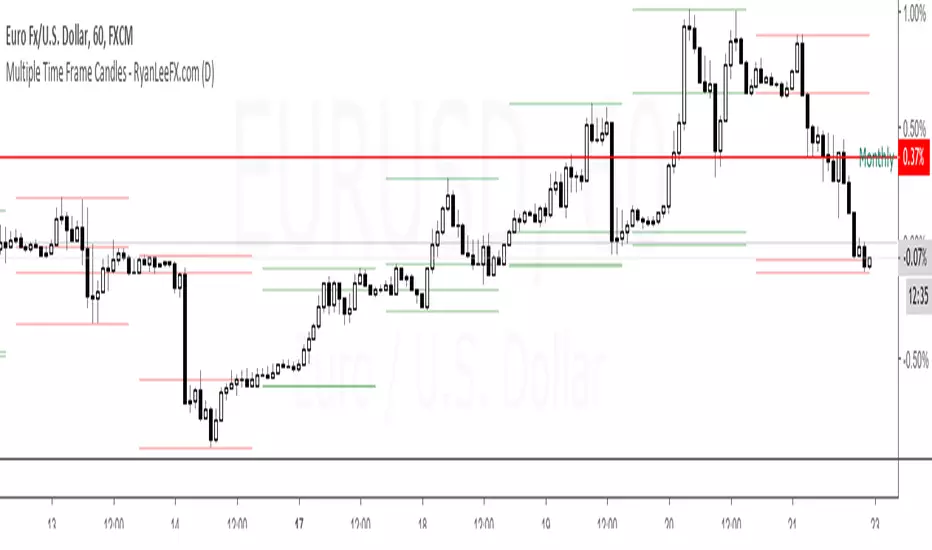
Multiple Time Frame Candles - RyanLeeFX.comMultiple Time Frame Candles is a unique script that allows traders to quickly and easily analyze price action candles across multiple time frames all from one chart. Multiple Time Frame Candles eliminates the need for price action traders to change chart time frames when trying to analyze multiple time frames. With this script, traders can easily see the candles from a lower time frame inside candles from a higher time frame.
For example, traders can see 1 Hour candles inside Daily candles. Or 5 Min candles inside Hourly candles. Or Daily candles inside Weekly candles. Or Hourly candles inside Daily candles inside Weekly candles. The options for comparing multiple time frame candles on one screen are almost limitless.
This script differs from other Multiple Time Frame Candle scripts by displaying the open, high, low and close of the larger time frame candle as well as highlighting the close price due to its proven importance.
The ability to quickly analyze multiple time frames from a single chart will make you more confident in your trades as well as save you valuable time during your analysis.
Multiple Time Frame Candles is also an amazing script to help beginning to experienced traders better visualize price movement across multiple time frames all from a single chart. Happy Trading!!
Candles HistoryA utility tool to get some metrics from the whole candles history.
Consider it as my Christmas gift to the community.
Available metrics
Starting Year
Starting Month
Starting Day
Starting Weekday
Starting Hour
Starting Minute
Highest Volume (works correctly only on the tickers with available volume data)
Lowest Volume (works correctly only on the tickers with available volume data)
Longest Candle Range
Average Candle Range
Longest Candle Body
Average Candle Body
Available Candles
Bullish Candles
Bullish Trend Candles (body >= range / 2)
Bearish Candles
Bearish Trend Candles (body >= range / 2)
Doji Candles
Bullish Marubozu Candles
Bearish Marubozu Candles
Longest Bullish Serie
Longest Bearish Serie
Good luck!

RSI Candles (with wicks)The script adds wicks to the RSI candle indicator.
It is based on the RSI candle indicator by cI8DH.
Note that the definition of these wicks is not unique.
The implementation uses an RSI calculated from the highs and lows for the wicks.

Color CandlesUses 6 most common indicators to color candles when they give buy/sell signals.
Use line view to see candle colors.
Purple = 6 buy signals
Teal = 5 buy signals
Navy = 4 buy signals
Lime = 3 buy signals
Green = 2 buy signals
Pale Green = 1 Buy signal
White = neutral
Gray = 1 sell signal
Yellow = 2 sell signals
Orange = 3 sell signals
Red = 4 sell signals
Firebrick = 5 sell signals
Black = 6 sell signals
Parabolic SAR calculated as .02, .02, .2. Traditional Buy/Sell. Green/Red Dots.
Bollinger Band calculated as 20, 1. Buy/Sell when above or below band. Aqua filled band.
MACD calculated with emas 12, 26, 9. Traditional MACD/Signal cross Buy/Sell. Filled Blue/Orange band.
RSI length 14. Traditional Buy/Sell below 30 and above 70. Green/Yellow/Red line below price.
ADX/DI len 14. Traditional crossover Buy/Sell. Filled Lime/Green above price.
Stochastic 14/3/3. Traditional 20/80 Buy/Sell. Filled teal/orange above price.

Volume CandlesHello traders!
Well, I was trying to implement EquiVolume Charts that were developed by Richard W. Arms, but unfortunately I got a poor result.
Instead, I used my groundwork on EquiVolumes to create Volume Candles indicator to help you make better, smarter trades.
What are the cool features?
Excellently filters the instrument's movements
Gives a better view of the accumulation/distribution phases
Completely removes price gaps
Works on ANY instrument that has available volume data.
Personally, I am a big fan of the volume-based indicators and to clarify my position I cite the following words of Buff Pelz Dormeier from his book "Investing with Volume Analysis: Identify, Follow, and Profit from Trends" :
A trade produces only two pieces of information: the price and price's neglected sibling, volume. Perhaps the least appreciated piece of the puzzle, volume represents fertile ground for technical analysis. Proficiency in volume analysis is a rare skill. Properly understood, though, volume analysis can provide its practitioner with the power to peer deeply into market mechanics.
Benjamin Graham, the father of value investing and a mentor of Warren Buffett, often called the market a 'voting machine'. If so, then volume is the ballot box. Volume is a literal illustration of the power behind the forces of supply and demand.
Volume is understood as the validation of price, the source of liquidity, the substantiation of information, the fulfillment of convictions, the revelation of divergent opinions, the fuel of the market, the proponent of truth, and the energy behind the velocity of money. If you believe any of this information might be important in making an investment decision, volume analysis is important to you.
I attached some screenshots to show you how it works with other instruments.
Happy Trading!
Morning Star PatternMorning star is signal for ending of downtrend and starting of uptrend.
For detail:
www.onlinetradingconcepts.com

Bull/Bear CandleThis script will display a small triangle under the latest two candles to indicate whether that candle is bullish or bearish based on the following definition.
A bullish candle closes in the top portion of the trading range of the candle while a bearish candle closes in the bottom portion of the trading range of the candle.
The cutoff is currently set at 65% (you can adjust it) so the close must be outside or equal to 65% of the trading range to be considered bullish or bearish. If less than 65% the triangle will indicate a neutral candle.
Colours are;
green triangle = bullish candle
red triangle = bearish candle
yellow triangle = neutral candle
I hope this helps those using TraderCobb's cradle strategy.

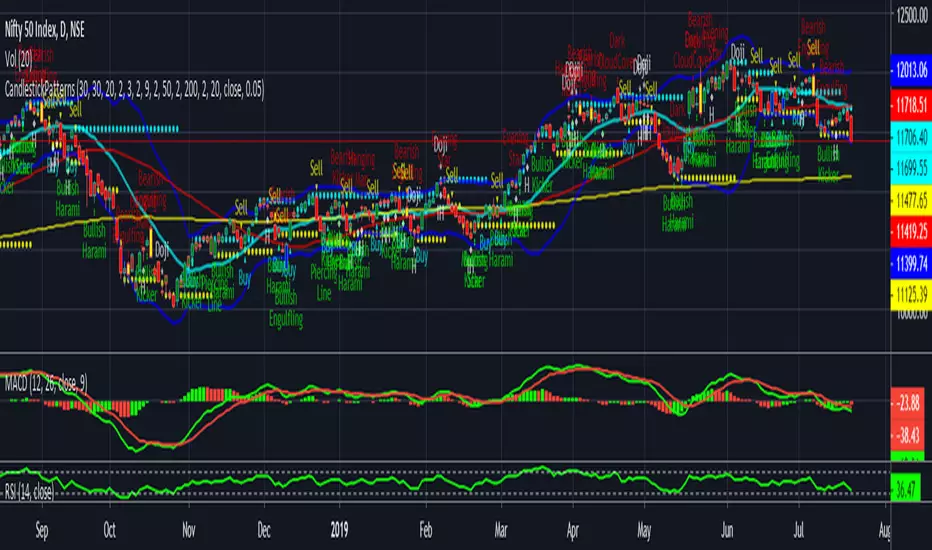
CandlestickPatternsIf moving average SMA (green line) crosses above SMA (red line) is uptrend , stock price will move up gradually. If suppose moving average SMA (green line) crosses below SMA (red line) is downtrend, stock price will move down. Also please validate with MACD & RSI for reference will get more clarification.
The default script have:
1) Bollinger Bands
2) Moving Average
3) Buy & Sell Signals
4) Engulfing patterns (like Doji , Bearish Harami, Bullish Harami, Bearish Engulfing , Bullish Engulfing , Piercing Line, Bullish Belt, Bullish Kicker, and Bearish Kicker)
The Piercing Line, Bullish Belt, and the Kickers will usually show up better in the daily charts.
Small candle indicatorI've modified the original script by WiscoDish to show candles as green while they are smaller than the median of the past 10 candles. Once they become larger than the median they'll change to gray.
I've also added a horizontal median line so you can see how close the candle is to the median candle size.
This is very useful if you're stalking a trade and waiting for the candle to close small.

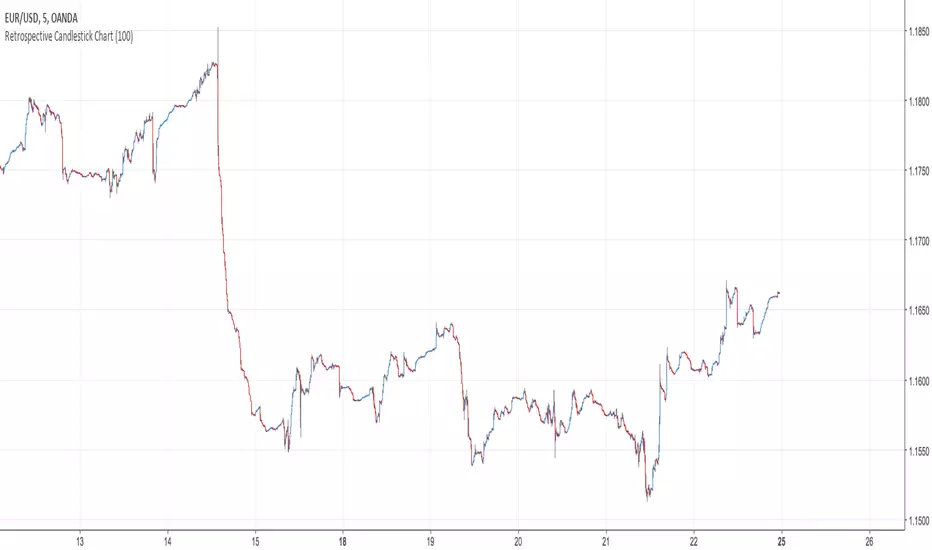
Retrospective Candlestick ChartWhen i was in Japan with some traders colleagues we talked about traditional charting tools from this country and how they changed the way we look at our charts today. Then suddenly one of the japanese traders i have met earlier said "Why not making another charting tool ? Smoother than Heikin-Ashi and including all the information a trader may need but easier to interpret".
So i had the idea of averaging the input and the output of the respective close / open / high and low price using a recursive exponential window functions, each values will be closer to their true value if they are volatile, if they are not then those values will look smoother, the length input represents the reactivity of the candles, high values represents smoother results but less reactive.The goal of those candles is to make all the information easier to interpret by a trader.
500 input length , the price look smoother, supports and resistances are easier to make.
The interpretation of highs and lows are important, the Retrospective Candlestick Chart save you time by showing only huge movements.
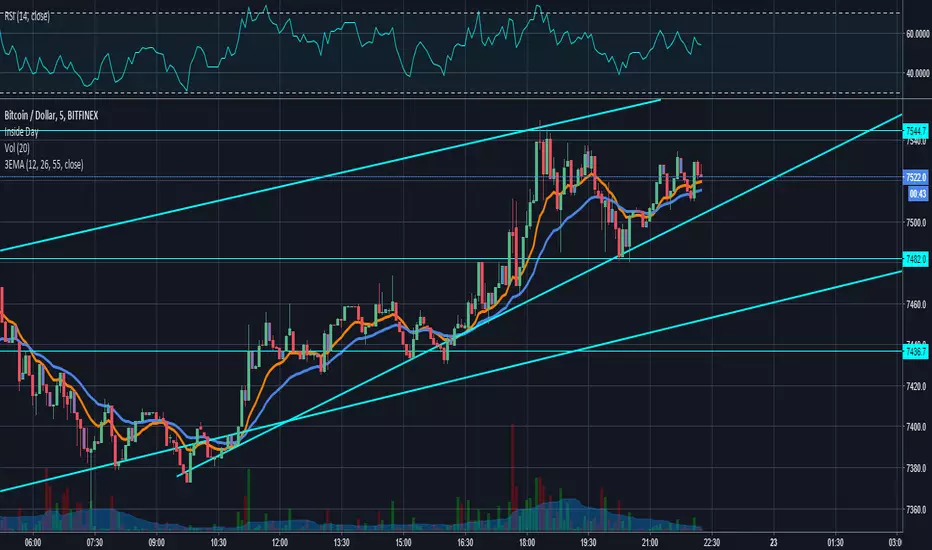
DRS - Daily Range SystemAn indicator that visualizes the evolution of a daily candle, inspired by a thread on forexfactory: www.forexfactory.com
Applied on a timeframe lower than D (actually lower than H4), it visualizes the evolution of the day's high and low, as well as mid and 25% and 75% lines.
The sole input parameters are the hour at which a day is supposed to start, and the extent of the "trade allowed" region as explained in the FF -1.44% thread.

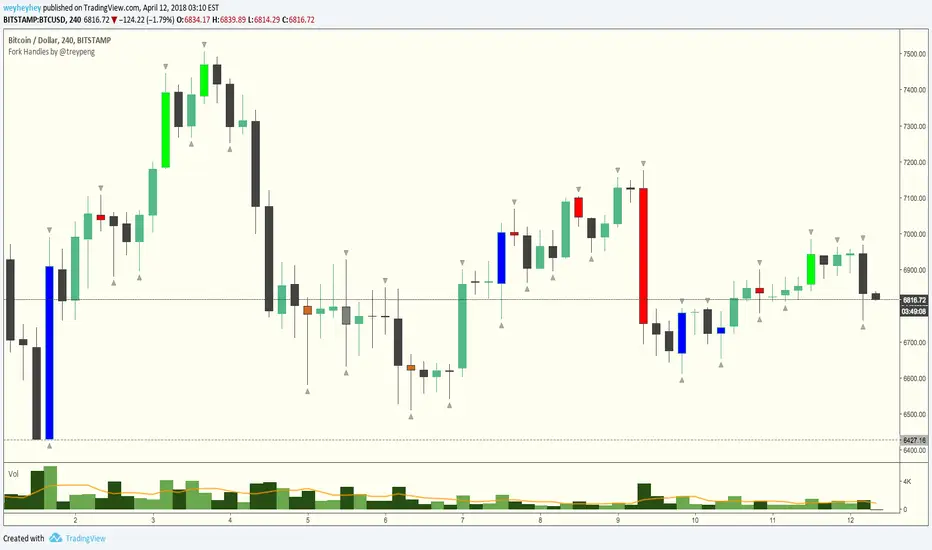
Deep CandleAccess two chart resolutions and/or securities with crystal clarity. Have your one minute candles built right into your one hour candles, or whatever other combinations you'd like. Use "Fade Mode" to accentuate low res candles when zoomed out and mute them when zoomed in. Choose any security/exchange and any resolution.
If you'd like to plug this concept into another indicator, I'm at your service.
~jdhadwin
Two resolutions, same exchange, one chart:
Two resolutions, Coinbase 1m & Bitfinex 30m, one chart:
Fade Mode Off
Fade Mode On
1 Minute Chart with 1 Day Candles applied
15 Minute Chart with 1 Day Candles applied (zoomed out)
15 Minute Chart with 1 Day Candles applied (zoomed in) with Fade Mode Off
15 Minute Chart with 1 Day Candles applied (zoomed in) with Fade Mode On

Fork Handles by @treypeng
Candle based indicator that shows swing highs and lows (pivots).
It draws an up or down arrow for simple three candle 'single' swings.
For stronger five candle 'double' swings, it colours the candle. Good for highlighting stronger reversals.
Both of these stylings can be toggled on/off individually.
Default colours
Swing HIGH on an UP candle: bright green
Swing HIGH on an DOWN candle: bright red
Swing LOW on an UP candle: blue
Swing LOW on an DOWN candle: brown
Double swings are grey or white.
Regular candles are just kept to your own default colours as specified in the chart settings.
👏 for anyone who gets the 'fork handles' joke reference.

Candle FMTFMultitimeframe candlesticks with shadows. Script draws each next candle gradually. Sorry for bad english. Good Luck in tradework!

EMA_Cross_Trading_JHVer3.0
- EMA14 and EMA50 Cross detection
- HA 1st profit taking
- Overshoot detection
- Candle shape and Wick analysis
