ZynIQ Breakout Essentials + Risk v1Overview
ZynIQ Breakout Essentials + Risk v1 is a breakout-based tool designed for traders who want a clean, rules-driven framework for identifying consolidation zones, breakout levels, and structured stop/target planning. It highlights key areas where price may transition from compression into momentum.
Key Components
• Breakout Range Detection – Identifies consolidation zones using a configurable lookback window and optional candle-range filters.
• Breakout Levels – Plots upper/lower boundaries that define potential breakout points.
• Signal Spacing Filters – Helps reduce noisy or clustered breakout triggers.
• Risk Helper – Provides both %-based and ATR-based structure for stop loss and take profit planning.
Use Cases
• Spotting breakouts from tight ranges.
• Structuring consistent entries for intraday or swing setups.
• Planning stops and targets with volatility-adjusted levels.
Notes
This tool provides structure for assessing breakout conditions and planning trade levels. It is not a standalone trading system. Use alongside your own confirmation and risk management.
Breakout!

MarketMind PRO v1.0 🜁 MarketMind PRO v1.0 — Multi-Session Real-Time Context Engine
Find opportunity faster. Trade with clarity and conviction.
🜁 MarketMind PRO is a real-time, session-aware context intelligence engine designed to answer one essential question:
Is this ticker truly in play today?
Its analysis adapts instantly to the current trading phase—Early Flow (Pre-Market), Volatility Burst (Open), Low-Vol Window (Midday), Rebuild Phase (Afternoon), or Power Hour (Pre-Close)—so the score and bias signals you see always reflect the conditions that matter right now.
This makes 🜁 MarketMind PRO a multi-timeframe environment engine with a strong emphasis on deep real-time analysis during the two highest-edge windows of the day: Pre-Market and Pre-Close .
By fusing macro alignment, sector flow, liquidity quality, volatility regime, microstructure behavior, and options-driven pressure into a single visual framework, 🜁 MarketMind PRO turns noisy charts into clean, decision-ready environments.
Whether you're hunting high-quality overnight setups in the final hour, scanning gap-driven opportunities before the open, or evaluating structure during the regular session, 🜁 MarketMind PRO highlights the context that matters—and filters out everything that doesn’t.
⭐ WHAT 🜁 MARKETMIND PRO ACTUALLY DOES
🜁 MarketMind PRO performs continuous real-time analysis across all trading phases.
It:
• detects when a ticker is aligned with broader market forces
• highlights high-quality conditions for intraday or overnight trades
• warns you when macro, VWAP, or gap conditions make the setup unsafe
• reveals trend, structure, liquidity, and flow context instantly
• consolidates cross-market awareness into one simple, unobtrusive chart
It’s built for traders who want clarity without complexity.
⭐ THE CORE OF 🜁 MARKETMIND PRO: THE SQS SCORE (0–100)
SQS (System Quality Score) compresses nine critical dimensions of market and setup readiness:
✓ Gap Behavior
✓ Sector Flow
✓ Liquidity Quality
✓ Relative Strength
✓ Macro Alignment
✓ Microstructure Strength
✓ Price Stability
✓ Options Flow
✓ Bonus Context (trend confluence, regime reinforcement)
SQS is fully session-aware and adjusts its weighting model in real time.
It automatically adapts to the two highest-opportunity phases:
• Pre-Close (15:30–16:00 ET) — for overnight hunters
• Pre-Market (04:00–09:30 ET) — for gap traders & open-drive setups
Scores translate into an intuitive tier:
• GO – High-quality environment
• WATCH – Developing conditions
• PASS – Low-quality environment
• SKIP – Hard block triggered (Macro, VWAP, Gap)
SQS doesn’t tell you what to trade — it tells you when the environment is worth your attention.
⭐ OPTIONS FLOW ENGINE v1.0 — A NEW DIMENSION OF CONVICTION
🜁 MarketMind PRO v1.0 introduces a dedicated Options Flow Engine, designed for traders who rely on flow-aligned environments.
Powered by a multi-layer fusion model, Options Flow measures:
• directional bias (Call vs Put)
• macro confirmation state
• RS, volatility, and trend bursts
• volume-imbalance pressure (buy/sell dominance)
• expansion bars & spike behavior
• early reversal/compression signals
• pre-market flow acceleration
• contextual flow multiplier (momentum × volatility × VWAP × sector alignment)
The output is a smooth, conservative, non-inflated flow signal that highlights genuine options pressure—not noise.
When enabled, Options Flow integrates directly into SQS as a weighted component, adding a powerful second layer of confirmation without overwhelming the trader.
⭐ THE HUD — EVERYTHING THAT MATTERS, INSTANTLY
The on-chart HUD is designed for ultra-fast interpretation and adapts automatically to your current session in real-time:
✔ Macro Bias (overall market tone & volatility environment)
✔ Sector Bias (how strong your ticker’s sector is today)
✔ Trend Bias (the chart’s structure, trend quality, VWAP position)
✔ Micro Bias (how similar tickers are behaving — peer confirmation)
✔ SQS Score (0–100) with tiers for GO / WATCH / PASS / SKIP
✔ Hard Block Reason (Macro, VWAP, or Gap — conditions that stop a setup from qualifying)
✔ Breakdown Panel (full 9-factor score display)
✔ Key Driver Analysis (which factor moved SQS the most)
✔ Options Mode Output (direction, expiry, delta, flow%)
Every element is tuned to reduce cognitive load and turn complex market states into clean, actionable context.
⭐ PRE-CLOSE MODE — IDENTIFY HIGH-QUALITY OVERNIGHT SETUPS
During 15:30–16:00 ET, 🜁 MarketMind PRO shifts into its highest-precision overnight model, emphasizing:
• structural integrity
• trend continuation
• sector agreement
• macro confirmation
• liquidity quality
• stability conditions
This helps uncover tickers building strength into the close—ideal for selective overnight positions.
⭐ PRE-MARKET MODE — FIND THE BEST GAP PLAYS BEFORE THE BELL
In the pre-market window, weightings shift toward:
• gap magnitude × character
• early liquidity quality
• volatility expansion vs compression
• microstructure acceleration
• macro alignment ahead of the open
• premarket flow strength (if Options Mode enabled)
You immediately see which tickers are warming up, which are accelerating, and which are fading before the open.
⭐ OPTIONS MODE (OPTIONAL FEATURE)
When activated, 🜁 MarketMind PRO displays:
• Call/Put direction
• Expiry (0DTE / 1DTE / 2DTE)
• Delta
• Options Flow %
• Flow Direction Bias (Bullish / Bearish)
This mode is ideal for:
• flow-confirmation traders
• macro-aligned momentum plays
• premarket sweep/chase setups
• intraday continuation plays
Options Mode is fully optional.
SQS remains complete and accurate without it.
⭐ WHY TRADERS USE 🜁 MARKETMIND PRO
✓ Avoid low-quality environments
No more wasting time in chop, illiquid tickers, or dead setups.
✓ Spot opportunity faster
A single glance tells you whether a ticker is heating up or not worth your time.
✓ Build confidence and clarity
You understand why the environment is favorable—or why it isn’t.
✓ Streamline your scanning routine
🜁 MarketMind PRO was engineered for fast, repeatable workflows.
✓ Stay aligned with broader market structure
Bias and regime context are always visible.
⭐ WHO 🜁 MARKETMIND PRO IS FOR
• Day traders
• Swing traders
• Options traders
• Pre-Market scanners
• Pre-Close overnight hunters
• Momentum, trend, and structure traders
• Systematic/algo traders who need human-readable context
If you value context first, decisions second, this tool was built for you.
⭐ RECOMMENDED SETTINGS & WORKFLOW
• Use Pre-Close Mode 15:30–16:00 ET for overnight setups
• Use Pre-Market Mode 07:00–09:30 ET for gap filtering & open-drive candidates
• Enable Options Mode only if your strategy benefits from flow context
• Keep HUD in Top Right for the cleanest chart layout
• Turn OFF Inputs/Values in Status Line for optimal display
⭐ IMPORTANT NOTES
• 🜁 MarketMind PRO is a context engine, not a buy/sell signal
• It pairs best with your existing strategy or system
• No proprietary signals or predictions are provided
• SQS is session-aware and adapts automatically
• Options Flow is intentionally conservative—greens are rare and meaningful
⭐ FINAL THOUGHTS
🜁 MarketMind PRO v1.0 is built for the modern trader who wants clarity, speed, and conviction.
It provides the macro, micro, structure, and flow context needed to choose smarter setups—without guessing or over-analyzing.
If you want a clean, disciplined way to identify when a ticker truly deserves your attention…
🜁 MarketMind PRO is the missing piece of your workflow.

Hyper Squeeze Sniper (Dual Side: Long + Short)Hyper Squeeze Sniper (Dual Side Strategy)
This script is a comprehensive Volatility Breakout System designed to identify and trade explosive price moves following periods of consolidation. It combines the classical "Squeeze" theory with Linear Regression Momentum, Volume Analysis, and an ATR-based Trailing Stop to filter false signals and manage risk effectively.
The script operates on a logic of "Compression -> Explosion -> Trend Following" suitable for both Long and Short positions.
🛠 Detailed Methodology (How it works)
1. The Squeeze Detection (Consolidation) The core concept relies on the relationship between Bollinger Bands (BB) and Keltner Channels (KC).
Condition: When the Bollinger Bands (Standard Deviation) contract and fall inside the Keltner Channels (ATR based), it indicates a period of extremely low volatility (The Squeeze).
Visual: The background turns Gray to indicate "Do Not Trade / Wait Mode".
2. Momentum Confirmation (Linear Regression) Instead of using standard lagging indicators, this script utilizes Linear Regression of the price deviation to determine the direction of the breakout.
If the Linear Regression Slope > 0, the bias is Bullish.
If the Linear Regression Slope < 0, the bias is Bearish.
3. Volume Validation To avoid fake breakouts, a Volume Spike filter is applied. A signal is only valid if the current volume exceeds its moving average by a defined multiplier (Default x1.2).
4. Risk Management: ATR Trailing Stop Once a trade is entered, the script calculates a dynamic Trailing Stop based on the Average True Range (ATR).
- Long: The stop line trails below the price and never moves down.
- Short: The stop line trails above the price and never moves up.
- Exit: The position is closed immediately when the price breaches this volatility-based safety line.
How to Use
1. Wait: Look for the Gray Background. This is the accumulation phase.
2. Entry:
LONG: Wait for a Green Triangle ▲ (Price breaks Upper BB + Vol Spike + Bullish Momentum).
SHORT: Wait for a Red Triangle ▼ (Price breaks Lower BB + Vol Spike + Bearish Momentum).
3. Exit: Close the position when the "X" mark appears or when candles cross the trailing safety line.
Settings
- BB Length/Mult: Adjust the sensitivity of the squeeze detection.
- Vol Spike Factor: Increase this to filter out low-volume breakouts.
- ATR Period/Mult: Adjust the trailing stop distance (Higher = Wider stop for swing trading).

Arkham ORB Indicator 3.815-Minute ORB Breakout Indicator with Volume Confirmation & Dynamic Risk Management
This closed-source indicator identifies high-probability breakout opportunities during the New York session open (8:30-9:30 AM ET) using a systematic Opening Range Breakout methodology combined with volume validation and adaptive volatility-based risk management.
Core Methodology - How It Works
Opening Range Framework
The indicator establishes the Opening Range by tracking the high and low of the first 15 minutes of the trading session (8:30-8:45 AM ET). This range represents the initial price discovery zone where early participants establish equilibrium. Breakouts above the high or below the low signal potential directional moves as liquidity enters the market during the full NY session.
Volume-Based Breakout Validation
To distinguish genuine breakouts from false moves, the indicator employs a rolling volume analysis system. It calculates a 12-period median of volume and applies a 1.2x threshold multiplier. Only price movements accompanied by volume exceeding this threshold are flagged as valid breakout signals. This approach filters out low-conviction breakouts that often occur in choppy, low-participation conditions and significantly reduces false signals at ORB levels.
Adaptive Volatility-Based Stop Loss Calculation
Unlike fixed-point stop losses, this indicator uses a dynamic calculation based on a 10-day lookback of historical ORB ranges. The stop loss is derived by analyzing recent Opening Range sizes and applying a 0.5x multiplier to the average. This creates three key advantages:
Compression adaptation: When recent ORBs shrink (low volatility), stops automatically tighten to reduce risk exposure
Expansion adaptation: When recent ORBs expand (high volatility), stops widen to prevent premature exits on legitimate moves
Hybrid intelligence: The system detects outlier volatility days by comparing current ORB size to the 10-day average. When divergence exceeds 50%, it recognizes abnormal conditions and adjusts stop placement accordingly rather than blindly using historical averages
Multi-Entry Risk Framework
The indicator recognizes that different traders enter at different points relative to the ORB level. It provides simultaneous risk calculations for three entry strategies:
Direct ORB Entry (0-point offset): Immediate breakout entries at the ORB high/low
Pullback Entry 1 (default 5.5 points): Conservative entries waiting for initial retracements
Pullback Entry 2 (default 11.0 points): Deeper retest entries for very conservative approaches
Each entry type displays independently calculated metrics (stop loss distance, contract sizing, take profit levels) that account for the actual entry point's distance from the ORB level. This ensures accurate position sizing and risk/reward ratios regardless of which entry method you use.
Smart Volatility Detection & Alerts
The indicator continuously compares the current day's ORB size against the 10-day historical average. When divergence exceeds a configurable threshold (default 50%), it alerts you to abnormal market conditions:
Compression warnings: When today's ORB is 50%+ smaller than average (potential low-volatility trap)
Expansion warnings: When today's ORB is 50%+ larger than average (potential news event or unusual volatility)
This allows you to adjust expectations and position sizing based on whether current conditions match your backtested historical environment.
Risk Management Safeguards
Min/Max Stop Loss Caps
To prevent extreme stop placements in unusual conditions:
Minimum stop: 35 points (prevents overly tight stops that get hit by noise)
Maximum stop: 75 points (caps risk exposure during extreme volatility events)
Both caps are fully adjustable and can be toggled on/off
Contract Rounding & Risk Display
The indicator automatically rounds to whole contracts and displays real-time risk metrics including:
Suggested stop loss level (adjusted for entry offset + volatility)
Number of contracts (sized to your account risk parameters)
Suggested take profit level (maintains your configured risk/reward ratio)
Dollar risk and potential profit for each entry type
What Makes This Original
This indicator combines several methodological elements that work together as a cohesive risk management system:
Volume confirmation prevents trading every ORB breakout indiscriminately
Adaptive volatility stops ensure your risk scales with current market conditions, not fixed assumptions
Multi-entry framework provides accurate calculations for various entry styles without requiring separate indicators
Outlier detection warns when today's conditions deviate significantly from your backtested norms
Integrated position sizing removes the mental math from determining contracts and risk/reward
Rather than simply plotting ORB levels or using fixed stops, this system adapts to changing volatility while validating breakouts with participation metrics.
How to Use It
Apply to a 5-minute chart of futures instruments (optimized for MNQ/NQ)
Set your account risk parameters in settings (account size, risk per trade %)
Monitor the ORB formation period (8:30-8:45 AM ET) - levels will be drawn
Watch for breakout signals during 8:45-9:30 AM ET with volume confirmation
Choose your entry style from the three displayed options based on your risk tolerance
Use the suggested stops and targets from the real-time risk table
Pay attention to volatility warnings - adjust position sizing if conditions are abnormal
Fully Customizable Settings
All parameters used in the indicator's calculations are user-adjustable, allowing you to adapt the system to your trading style and risk tolerance:
ORB Configuration
ORB formation period start/end times
Entry offset distances (Entry 1 and Entry 2 point values)
Display toggles for each entry type
Volume Analysis
Volume lookback period (default: 12)
Volume multiplier threshold (default: 1.2x)
Toggle volume filtering on/off
Stop Loss Calculation
Historical lookback period (default: 10 days)
Stop loss multiplier (default: 0.5x)
Calculation method: Historical Average, Current Day ORB, or Hybrid
Minimum stop cap (default: 35 points)
Maximum stop cap (default: 75 points)
Toggle min/max caps on/off
Volatility Alerts
Divergence threshold for outlier detection (default: 50%)
Alert display toggles
Risk Management
Account size
Risk percentage per trade
Risk/reward ratio for take profit calculations
Display Options
Table positions and sizes (compact mode)
Color schemes
Show/hide individual components
This flexibility allows you to backtest different parameter combinations and optimize the indicator for current market conditions or your specific trading approach. You are in full control of the calculations - the indicator simply automates the math based on your inputs.
Ideal For
Futures traders (MNQ/NQ) seeking a systematic, rule-based approach to NY session open breakouts with pre-calculated risk parameters that automatically adapt to changing market volatility. Particularly useful for traders who want to eliminate emotional decision-making around stop placement and position sizing.
Important Disclaimers
No Financial Advice
This indicator is provided for educational and informational purposes only. It does not constitute financial advice, investment advice, trading advice, or any other sort of advice. You should not treat any of the indicator's content, outputs, or signals as such. The author is not a licensed financial advisor.
Risk Warning
Trading futures and derivatives involves substantial risk of loss and is not suitable for all investors. Past performance of any trading system or methodology is not necessarily indicative of future results. You should carefully consider whether trading is appropriate for you in light of your experience, objectives, financial resources, and other relevant circumstances.
No Performance Guarantees
While this indicator is designed to identify high-probability setups based on historical analysis, there is no guarantee of profitable results. Market conditions change, and what worked in backtesting may not work in live trading. Due to the leveraged nature of futures trading, losses can significantly exceed your initial investment.
Use at Your Own Risk
All trading decisions made based on this indicator are your sole responsibility. The author assumes no responsibility for your trading results, losses, or any damages resulting from the use of this indicator. Always use proper risk management and never risk more than you can afford to lose.
Backtesting vs. Live Trading
Results generated from backtesting may not reflect actual trading performance due to factors including but not limited to: slippage, commissions, market liquidity, emotional decision-making, and differences between historical and real-time data.
Not a Guarantee of Accuracy
While efforts have been made to ensure the indicator functions as described, no software is perfect. You are responsible for verifying the indicator's calculations and outputs before making any trading decisions.

Support & Resistance Zone Hunter [BOSWaves]Support & Resistance Zone Hunter - Dynamic Structural Zones with Real-Time Breakout Intelligence
Overview
The Support & Resistance Zone Hunter is a professional-grade structural mapping framework designed to automatically detect high-probability support and resistance areas in real time. Unlike traditional static levels or manually drawn zones, this system leverages pivot detection, range thresholds, and optional volume validation to create dynamic zones that reflect the true structural architecture of the market.
Zones evolve as price interacts with their boundaries. The first touch of a zone determines its bias - bullish, bearish, or neutral - and the system tracks the full lifecycle of each zone from formation, testing, and bias establishment to potential breakout events. Diamond-shaped breakout signals highlight structurally significant price expansions while filtering noise using a configurable cooldown period.
By visualizing market structure in this way, traders gain a deeper understanding of price behavior, trend momentum, and areas where liquidity and reactive forces are concentrated.
Theoretical Foundation
The Support & Resistance Zone Hunter is built on the premise that meaningful structural zones arise from two core principles:
Pivot-Based Turning Points : Only significant highs and lows that represent actual swings in price are considered.
Contextual Validation : Zones must pass minimum range criteria and optional volume thresholds to ensure their relevance.
Markets naturally generate numerous micro-pivots that do not carry predictive significance. By filtering out minor swings and validating zones against volume and range, the system isolates levels that are more likely to attract future price interaction or act as catalysts for breakout moves.
This framework captures not only where price is likely to react but also the direction of potential pressure, providing a statistically grounded, visually intuitive representation of market structure.
How It Works
The Support & Resistance Zone Hunter constructs zones through a multi-layered process that blends pivot logic, range validation, and real-time bias determination:
1. Pivot Detection Core
The indicator identifies pivot highs and pivot lows using a configurable lookback period. Zones are only considered valid when both a top and bottom pivot are present.
2. Zone Qualification Engine
Prospective zones must satisfy two conditions:
Range Threshold : The distance between pivot high and low must exceed the minimum percentage set by the user.
Volume Requirement : If enabled, the current volume must exceed the 50-period moving average.
Only zones meeting these criteria are drawn, reducing noise and emphasizing high-probability structural levels.
3. Zone Lifecycle
Once a valid top and bottom pivot exist:
The zone is created starting from the pivot formation bar.
Zones remain active until both boundaries have been touched by price.
The first boundary touched establishes bias: resistance first → bullish bias ,support first → bearish bias, neither → neutral.
Inactive zones stop expanding but remain visible historically to maintain a clear structural context.
4. Visual Rendering
Active zones are displayed as filled boxes with color corresponding to their bias. Top, bottom, and midpoint lines are drawn for reference. Once a zone becomes inactive, its lines are removed while the filled box remains as a historical footprint.
5. Breakout Detection
Breakout signals occur when price closes above the top boundary or below the bottom boundary of an active zone. The system applies a cooldown period and requires price to return to the zone since the previous breakout to prevent signal spam. Bullish and bearish breakouts are visually represented by diamond-shaped markers with configurable colors.
Interpretation
The Support & Resistance Zone Hunter provides a structural view of market balance:
Bullish Zones : Form when resistance is tested first, indicating upward pressure and potential continuation.
Bearish Zones : Form when support is tested first, reflecting downward pressure and continuation risk.
Neutral Zones : Fresh zones that have not yet been interacted with, representing undiscovered liquidity.
Breakout Diamonds : Highlight significant structural price expansions, helping traders identify confirmed continuation moves while filtering noise.
Zones do not simply indicate past levels; they dynamically reflect the evolving battle between buyers and sellers, providing actionable context for both trend continuation and reversion strategies.
Strategy Integration
The Support & Resistance Zone Hunter is versatile and can be applied across multiple trading approaches:
Trend Continuation : Use bullish and bearish zones to confirm directional bias. Breakout diamonds indicate structural continuation opportunities.
Reversion Entries : Neutral zones often act as magnets in ranging markets, allowing for high-probability mean-reversion setups.
Breakout Trading : Diamonds mark true structural expansions, reducing false breakout risk and guiding stop placement or momentum entries.
Liquidity Zone Alignment : Combining the indicator with order block, breaker, or volume-based tools helps validate zones against broader market participation.
Technical Implementation Details
Pivot Engine : Two-sided pivot detection based on configurable lookback.
Zone Qualification : Minimum range requirement and optional volume filter.
Bias Logic : Determined by the first boundary touched.
Zone Lifecycle : Active until both boundaries are touched, historical visibility retained.
Breakout Signals : Diamond markers with cooldown filtering and price-return validation.
Visuals : Transparent filled zones with live top, bottom, and midpoint lines.
Suggested Optimal Parameters
Pivot Lookback : 10 - 30 for intraday, 20 - 50 for swing trading.
Minimum Range % : 0.5 - 2% for crypto or indices, 1 - 3% for metals or forex.
Volume Filter : Enable for assets with inconsistent liquidity; disable for consistently liquid markets.
Breakout Cooldown : 5 - 20 bars depending on volatility.
These suggested parameters should be used as a baseline; their effectiveness depends on the asset and timeframe, so fine-tuning is expected for optimal performance.
Performance Characteristics
High Effectiveness:
Markets with clear pivot structure and reliable volume.
Trending symbols with consistent retests.
Assets where zones attract repeated price interaction.
Reduced Effectiveness:
Random walk markets lacking structural pivots.
Low-volatility periods with minimal price reaction.
Assets with irregular volume distribution or erratic price action.
Integration Guidelines
Use zone color as contextual bias rather than a standalone signal.
Combine with structural tools, order blocks, or volume-based indicators for confluence.
Validate zones on higher timeframes to refine lower timeframe entries.
Treat breakout diamonds as confirmation of continuation rather than independent triggers.
Disclaimer
The Support & Resistance Zone Hunter provides structural zone mapping and breakout analytics. It does not predict price movement or guarantee profitability. Success requires disciplined risk management, proper parameter calibration, and integration into a comprehensive trading strategy.

Smart Range Breakout System (Zeiierman)█ Overview
Smart Range Breakout System (Zeiierman) is a full breakout–trend–risk framework engineered around volatility compression, adaptive range detection, and a volatility-adaptive structural mapping layer that continuously reshapes itself as price migrates away from compression zones. Rather than reacting to simple line breaks, the system identifies statistically quiet regimes, models the expansion phase as momentum re-enters the market, and then deploys a unified architecture of trend projection, dynamic trailing stops, and risk–reward structuring that evolves in real time with the unfolding move.
This tool is designed for traders who want a self-contained breakout workflow: first detect valid ranges, then trade the expansion, then manage the trend and exits via automatically generated levels and alerts.
⚪ Why This One Is Unique
The core engine combines a custom price-contraction model with volatility-responsive boundary levels to detect when the market is transitioning between quiet and active phases. From this model, the script generates a smoothed synthetic average that acts as the reference point for identifying compression zones and validating breakout conditions. Using this foundation, the system builds a complete visual trade map: breakout boxes that mark consolidation, breakout markers that signal expansion, a trend cloud that tracks directional bias, adaptive trailing stops that follow price movement, and optional risk-reward levels that automatically adjust to each new breakout.
Unlike conventional breakout indicators that rely on a single high/low lookback, this system uses:
A price contraction engine that re-weights candle structure through a momentum-like transform, generating a stabilized price that better captures compression and release.
An adaptive low-volatility counter that waits for statistically quiet behavior before declaring a range.
█ Main Features
⚪ Breakout Signals With Dynamic Risk-Reward Levels
The system identifies meaningful breakouts emerging from compressed price zones and immediately maps a complete trade structure around each signal.
Each breakout generates:
Directional breakout markers to confirm expansion
Entry, Stop, TP1, and TP2 levels that are automatically projected
A dynamic trailing stop is added to lock in profits as the price moves
Risk and reward zones visualized through adaptive fills
Labels that update in real time as targets are reached or invalidated
This creates a clear, self-contained decision map that helps traders evaluate opportunities, manage risk, and track the progression of each breakout without manual calculations.
⚪ Trend Cloud
A continuously updating Trend Cloud highlights the active directional regime and offers immediate visual trend identification through its color-coded bias. It shows whether a breakout aligns with the prevailing direction, provides a smoother and more stable representation of the trend than raw price alone, and creates an intuitive backdrop for distinguishing trend-following opportunities from countertrend setups. By filtering out noise and emphasizing directional stability, the cloud helps improve timing, signal quality, and overall alignment with the dominant market structure.
█ How to Use
⚪ Breakout Trading from Range Boxes
1. Identify Compression Zones
Look for periods where the Range Breakout Box appears: this signals a statistically quiet regime where price has compressed around a bounded range.
The box top and bottom approximate the upper and lower bounds of the market’s recent equilibrium.
2. Trade the Expansion
Bullish Breakout:
Triggered when the synthetic price crosses above the box top.
A green breakout marker appears below the price (triangle up).
This signals that price is breaking out of the compression zone with enough momentum to establish a meaningful structural move to the upside.
Bearish Breakout:
Triggered when the price crosses below the box bottom.
A red breakout marker appears above the price (triangle down).
Signals a breakdown out of the range to the downside.
⚪ Trend Following with the Trend Cloud
The Trend Cloud is a volatility-responsive band that adjusts to the system’s internal trend. In bullish conditions, it shifts to the up-color beneath price, and in bearish conditions, it flips to the down-color above price, giving a clear visual read of market direction.
The cloud effectively separates impulsive trend legs from noise, so you can align breakout trades only with the dominant directional regime.
Long Setups
Favor long setups (Break Up) when the price is traveling above or inside a bullish cloud.
Short Steups
Favor short setups (Break Down) when the price is below or inside a bearish cloud.
Ignore counter-trend breakouts that form directly against a strong, stable cloud unless you are intentionally trading mean reversion.
⚪ Breakout Management and Risk-Reward
Once a breakout occurs, the system instantly activates a directional trailing stop that follows the trend. For long setups, the stop stays below the price and moves upward as momentum builds. For short setups, it stays above the price and moves downward as the trend strengthens. If price hits the trailing stop, an X-cross appears on the chart to mark the exit, and the stop is reset for the next signal. You can adjust the sensitivity to make the stop tighter or more relaxed, depending on your preference.
When Risk-Reward Levels are enabled, the script also builds a complete trade structure around the breakout. It places an entry line at the breakout close, and projects two target levels forward. The area between entry and stop is shaded as risk, while the area toward the targets is shaded as reward. Labels update automatically as targets are reached, turning into a clear confirmation mark when a level is hit and signaling with an icon if the stop is touched.
Together, the trailing stop and risk-reward ladder create a clear, real-time map of each breakout’s progression, helping you manage risk, monitor targets, and follow the move with structure and confidence.
█ How It Works
⚪ Compression Detection & Range Formation
The system identifies quiet market phases where price contracts into narrow zones and stabilizes around a synthetic equilibrium level. These zones form the foundation for valid breakout opportunities.
Calculation: Persistence-based boundary tracking with volatility-normalized change detection and equilibrium anchoring to identify statistically constrained price regimes.
⚪ Breakout Engine
Breakouts occur only when the internal average breaks out of a validated compression zone, confirming that the market is transitioning from containment to expansion.
Calculation: Boundary-crossing logic on dispersion-expanded structures with directional state shifts encoded through threshold-gated transitions.
⚪ Trend State
A dynamic trend state guides directional bias, while the Trend Cloud visually expresses this bias directly on the chart, shifting beneath or above the price depending on the active regime.
Calculation: Dual-regime state modeling using filtered directional vectors, volatility-responsive offsets, and continuity enforcement to avoid noise-driven flips.
-----------------
Disclaimer
The content provided in my scripts, indicators, ideas, algorithms, and systems is for educational and informational purposes only. It does not constitute financial advice, investment recommendations, or a solicitation to buy or sell any financial instruments. I will not accept liability for any loss or damage, including without limitation any loss of profit, which may arise directly or indirectly from the use of or reliance on such information.
All investments involve risk, and the past performance of a security, industry, sector, market, financial product, trading strategy, backtest, or individual's trading does not guarantee future results or returns. Investors are fully responsible for any investment decisions they make. Such decisions should be based solely on an evaluation of their financial circumstances, investment objectives, risk tolerance, and liquidity needs.

Average True Range % infoATR% is a modified version of the classic Average True Range indicator that displays price volatility as a percentage of the instrument's value, rather than in absolute values. This allows you to easily compare the volatility of different assets (e.g., Bitcoin vs Tesla stock) regardless of their price.
Main Features
1. ATR% Chart
The red line shows the average volatility from the last N candles (default 14), expressed as a percentage. For example:
ATR% = 2.5% means that the average daily move is approximately 2.5% of the asset's value
Higher values = greater volatility (higher profit potential, but also greater risk)
Lower values = lower volatility (calmer market)
2. Volatility Trend Analysis
The indicator automatically detects whether volatility is rising, falling, or stable:
Up arrow (↑) - volatility is rising (price becomes more "nervous")
Down arrow (↓) - volatility is falling (market is calming down)
Horizontal arrow (⮆) - volatility is stable (within ±3% of the moving average)
3. Information Table
In the upper right corner of the chart you will see Current ATR% value and Trend arrow with color coding:
- Green = rising volatility
- Red = falling volatility
- Gray = stable volatility
Parameters to Configure
Indicator Length (default: 14) - How many candles back to include in calculations:
Lower values (5-10): more sensitive to sudden changes, reacts faster
Higher values (20-30): more smoothed, shows long-term volatility picture
Trend Length (default: 10) - Period to analyze whether volatility is rising/falling:
Lower values: faster trend change signals
Higher values: more reliable, but slower signals
Sample Interpretations
ATR% Volatility Asset Type/Situation
< 1% Very low Stable blue-chip stocks, calm market
1-3% Low-medium Typical stocks, normal conditions
3-5% Medium-high Volatile stocks, cryptocurrencies at rest
5-10% High Cryptocurrencies, penny stocks
> 10% Extremely high Market panic, crash, pump & dump

Draw Trendline with Breakout by Pooja🌟 Draw Trendline with Breakout by Pooja
Draw Trendline with Breakout by Pooja
✨ A smart & clean auto–trendline tool that detects swings, plots dynamic trendlines, and highlights real-time breakouts — designed for intraday, swing & positional traders.
Indicator intelligently reads market structure using objective statistical calculations (ATR / Stdev / LinReg) and gives you clarity on trend direction, structural shifts, and breakout opportunities.
Works on Stocks • Indian Stock Market • Crypto • Forex • Commodities
Suitable for Scalping • Day Trading • Swing Trading
🔥 Key Features
🔹 Auto Trendline Detection
Auto-detects swing highs/lows
Draws adaptive upper & lower trendlines
No manual drawing required
🔹 Dynamic Slope Engine
Choose from 3 professional slope methods:
📏 ATR Mode – volatility-adaptive
📊 Stdev Mode – statistical noise filtering
📐 Linear Regression Mode – structural slope mapping
🔹 Real-Time Breakout Signals
⚡ Instant breakout markers (Up/Down)
🔔 Alert support for both breakout types
Helps catch trend continuation & reversals early
🔹 Extended Projection Lines
➡️ Projects trendlines forward
🎯 Helps identify possible future reaction zones
🔹 Backpaint Control
🧩 Optional historical offset display
Great for forward testing & clean charts
🔹 Flexible Customization
Swing length
Colors
Slope sensitivity
Extended line visibility
📈 How to Use
Apply indicator
Set swing length based on volatility
Choose slope mode (ATR/Stdev/LinReg)
Observe auto trendlines
Watch for breakout markers
Set alerts for faster entries
Best used together with:
📌 Support & Resistance
📉 Price Action
🧭 Market Structure
🔊 Volume
💡 Why Traders Like It
Clean & lag-free structure mapping
Zero manual drawing
Breakouts are visually clear
Works on all assets & timeframes
⚠️ Disclaimer
This indicator is a technical analysis tool meant for charting assistance.
It does not guarantee profits or predict markets with certainty.
Always combine with your own analysis and proper risk management.
Past performance ≠ future results.

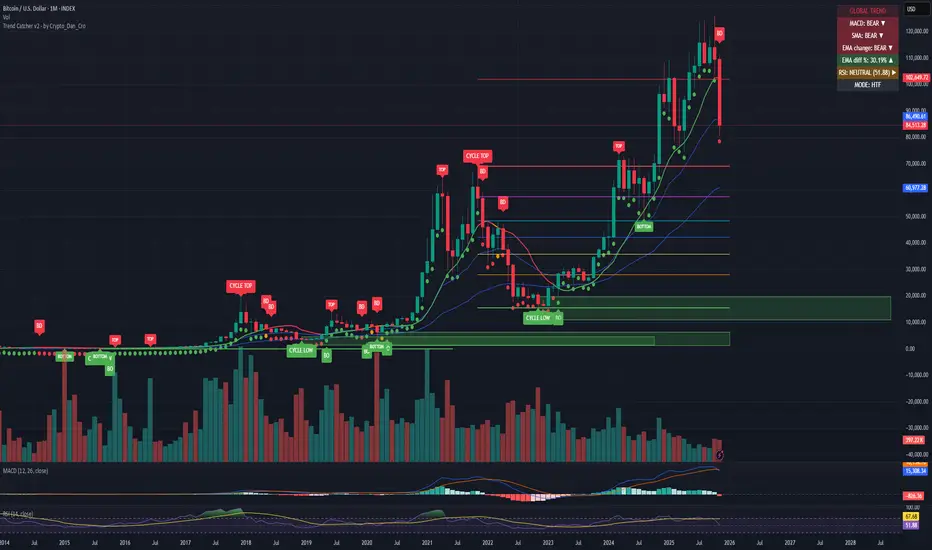
Trend Catcher - Alpha v2 - by Crypto_Dan_CroIf you want to get this indicator, contact me on
X handle: @crypto_dan_cro
What is Trend Catcher v2?
This is the only indicator you need ;)
This indicator is a proprietary market analysis system designed to identify high-probability trading zones by synchronizing multiple layers of market structure, momentum behaviour and cyclical dynamics.
It dynamically adapts to changing market conditions by evaluating:
- macro trend alignment
- structural price positioning
- momentum acceleration & deceleration
- volatility-based reaction zones
- cycle maturity levels
The system filters out low-quality setups and highlights only areas where multiple hidden conditions align, providing:
- trend continuation signals
- structural shift detection
- cycle-based expansion targets
- adaptive support & resistance mapping
Rather than reacting to price alone, the indicator anticipates areas where market psychology historically shifts, allowing traders to position themselves ahead of major moves.
Core philosophy:
This tool does not attempt to predict the market — it tracks the underlying pressure points where probability favours expansion or exhaustion.
It functions as:
- a trend alignment engine
- a cycle decoder
- a volatility interpreter
- a structure validation system
What it gives the user:
- Clear visual guidance without overloading the chart
- Objective market context independent of emotion
- Early trend recognition
- Cycle-aware price targeting
- Decision zones instead of random entries
Ideal for:
- traders who trade structure, not noise
- investors who respect market cycles
- strategists focused on probability over prediction
- disciplined entries & exits
In short:
It is a market interpretation framework built for traders who think two steps ahead.
Contains:
1. Higher Timeframe mode (Monthly / Weekly) on all timeframes
2. Current Chart Timeframe mode
3. Global Trend via BTC MACD
4. SMA
5. EMA
6. BO (Break Out), BD (Break Down) signals
7. TOP & BOTTOM Detection
8. Support & Resistance Zones
9. RSI confirmation
10. Smart Info Panel (Global trend, MACD, SMA, EMA, RSI statuses - Bull, Bear, Neutral)
11. Monthly timeframe (Fibbonaci Retracement levels)
12. Monthly timeframe (all Cycle tops, and Cycle bottoms)
Crypto markets are volatile, if you choose to use this indicator for trading, you are doing it on your own. Crypto_dan_cro is not responsible for any profits or losses created by using this Indicator.
Scalper Pro Pattern Recognition & Price Action📘 Scalper Pro Pattern Recognition & Price Action
Overview
Scalper Pro is a dynamic multi-layer trend recognition and price action strategy that integrates Supertrend, Smart Money Concepts (SMC), and volatility-based risk control.
It adapts to market volatility in real time to enhance entry precision and optimize risk.
⚠️ This script is for educational and research purposes only.
Past performance does not guarantee future results.
🎯 Strategy Objectives
Detect structural market shifts (BOS / CHoCH) automatically.
Identify Order Blocks (OB), Fair Value Gaps (FVG), and key liquidity zones.
Plot dynamic Take-Profit (TP) and Stop-Loss (SL) levels based on ATR.
Avoid low-volatility (sideways) conditions using ADX filtering.
Combine trend-following signals with structural confirmation.
✨ Key Features
Supertrend Entry Signals — Generates precise buy/sell markers based on price crossovers with the Supertrend line.
Order Block Detection — Automatically plots both Internal and Swing Order Blocks for smart money insights.
Fair Value Gap Visualization — Highlights inefficiency zones in bullish or bearish structures.
Market Structure Labels — Marks Break of Structure (BOS) and Change of Character (CHoCH) points for clear trend shifts.
Dynamic Risk Levels — Automatically generates TP/SL lines and price labels using ATR-based distance.
📊 Trading Rules
Long Entry:
• Price crosses above the Supertrend (ta.crossover(close, supertrend))
• ADX above sideways threshold (trend condition confirmed)
• Optional confirmation from a bullish BOS or CHoCH
Short Entry:
• Price crosses below the Supertrend (ta.crossunder(close, supertrend))
• ADX above threshold
• Optional confirmation from a bearish BOS or CHoCH
Exit (or Reverse):
• Opposite Supertrend crossover
• Price hits TP/SL lines
• Trend shift confirmed by internal BOS/CHoCH
💰 Risk Management Parameters
Stop Loss & Take Profit based on ATR × risk multiplier
ATR Length: 14 (default)
Risk %: 3% per trade
Sideways Filter: ADX < 15 → no trade zone
TP1–TP3 = Entry ± (ATR × 1~3)
⚙️ Indicator Settings
Supertrend Module:
ATR Length: 10
Factor: nsensitivity × 7
ADX Module:
ADX Length: 15
Sideways Threshold: 15
EMA Set:
EMA (5, 9, 13, 34, 50) × Volatility Factor (3)
SMA Filter:
SMA(8) & SMA(9) for short-term trend confirmation
Smart Money Concepts Module:
Displays BOS/CHoCH, Order Blocks, FVGs, Equal Highs/Lows, and Premium/Discount zones
🔧 Improvements & Uniqueness
Integrates Supertrend momentum with Smart Money Concepts (SMC) structural analysis.
Dual detection layers: Internal (micro) and Swing (macro) structures.
ATR-driven auto labeling for entry, stop, and profit targets.
Premium/Discount and Equilibrium zones visualized on the chart.
Built-in ADX filter to skip low-trend market conditions.
✅ Summary
Scalper Pro Pattern Recognition & Price Action merges classical trend-following with modern market structure analytics.
It combines momentum detection, volatility control, and smart money mapping into one cohesive framework.
Unified trend, structure, and risk visualization.
Auto-marked BOS/CHoCH, OB, FVG, and liquidity zones.
Usable for scalping, intraday, or swing trading setups.
⚠️ This strategy is based on historical data and designed for educational use only.
Always apply sound risk management and forward testing before live trading.

1Hr Stock Breakout HunterThis is a script works for 15min or 1hr, it tells you a trend is breakingout

Swing Traces [BigBeluga]🔵 OVERVIEW
The Swing Traces indicator identifies significant swing points in the market and extends them forward as fading traces. These traces represent the memory of recent highs and lows, showing how price interacts with past turning points over time. Traders can use the fading intensity and breakout signals to gauge when a swing has lost influence or when price reacts to it again.
🔵 CONCEPTS
Swing Detection – Detects recent upper and lower swing points using sensitivity-based highs and lows.
Trace Longevity – Each swing projects a “trace” forward in time, gradually fading with age until it expires.
Trace Size – Each trace is drawn with both a main level and a size extension (half of the bar range) to highlight swing influence.
Longevity Counters – Swings remain active for a customizable number of bars before fading out or being crossed by price.
Swing Retest – Labels appear when price retest above/below an active trace extension levels, confirming potential reversal.
🔵 FEATURES
Adjustable sensitivity length for swing detection.
Separate longevity controls for upper and lower swing traces.
Fading gradient coloring for visualizing how long a trace has been active.
Double-trace plotting: one at the swing level and one offset by trace size.
Clear BUY/SELL signals when price crosses a swing trace after it has matured.
🔵 HOW TO USE
Use blue (upper) traces as resistance zones; lime (lower) traces as support zones.
Watch for fading traces: the longer they persist, the weaker their influence becomes.
Retest dots (●) confirm when price retest a trace, signaling a potential reversal.
Shorter sensitivity values detect faster, smaller swings; longer values capture major swing structures.
Combine with trend indicators or volume to filter false breakout signals.
🔵 CONCLUSION
The Swing Traces indicator is a powerful tool for mapping price memory. By projecting recent swing highs and lows forward and fading them over time, it helps traders see where price may react, consolidate, or break through with strength. Its dynamic traces and breakout labels make it especially useful for swing traders, breakout traders, and liquidity hunters.

MTF Checklist DashboardMTF Checklist Dashboard
Overview
The MTF Checklist Dashboard is an advanced multi-timeframe analysis tool that provides traders with a comprehensive visual dashboard to analyze market conditions across six customizable timeframes simultaneously. This indicator combines multiple technical analysis methods, including Opening Range Breakouts (ORB), VWAP, EMAs, and daily price levels, to generate high-probability confluence-based trading signals.
Unlike traditional single-timeframe indicators, this dashboard displays all critical information in one organized table, allowing traders to instantly identify when multiple timeframes align for optimal entry and exit opportunities.
Key Features
Multi-Timeframe Analysis
Analyzes up to 6 timeframes simultaneously (default: 1m, 5m, 15m, 30m, 1h, 4h)
Fully customizable timeframe selection via comma-separated input
Color-coded cells for instant visual recognition (green=bullish, red=bearish, yellow=neutral)
Technical Indicators Tracked
Current and previous candle direction
Opening Range Breakout (ORB) positioning with custom period
VWAP relationship (above/below)
200 EMA positioning
Daily and previous day high/low proximity
EMA crossovers (9 vs 21, both vs 200)
Advanced Signal Filtering System
Confluence scoring: Requires multiple timeframes to align (3-6 timeframes)
Higher timeframe confirmation: Ensures 30m/1h/4h agreement
Volume filter: Confirms signals with above-average volume (1.5x default)
ATR volatility filter: Validates sufficient market movement
Session timing: Restricts signals to optimal trading hours (EST)
Momentum confirmation: Requires recent directional strength
Range positioning: Blocks signals near daily extremes
Candle strength: Validates strong directional candles (60%+ body ratio)
Visual Signals
Optional entry arrows (above/below bars)
Background color highlighting
Organized dashboard with real-time price levels
ORB range, current day, and previous day summary rows
Alert Conditions
JSON-formatted alerts for automated trading integration
Separate alerts for long entry, short entry, long exit, and short exit
Compatible with webhook automation systems
How To Use
Dashboard Interpretation
The dashboard displays a color-coded table with the following columns:
TF: Timeframe being analyzed
C: Current candle (Green=bullish, Red=bearish)
P: Previous candle (Green=bullish, Red=bearish)
ORB: Opening Range Breakout position (A=Above, B=Below, W=Within)
VWAP: Price vs VWAP (A=Above, B=Below)
E200: Price vs 200 EMA (A=Above, B=Below)
D Hi/Lo: Proximity to current day high/low (Hi/Lo/Mid)
PD Hi/Lo: Proximity to previous day high/low (Hi/Lo/Mid)
9 vs 21: EMA 9 vs EMA 21 relationship (A=9 above 21, B=9 below 21)
9&21 v200: Both EMAs vs 200 EMA (>>=both above, <<=both below, <>=mixed)
Signal Generation
Long Entry Signal triggers when:
Minimum number of timeframes show bullish alignment (default: 5 of 6)
Higher timeframes (30m/1h/4h) confirm direction (default: 2 of 3)
Price breaks above ORB high with sufficient distance
Volume exceeds average by specified multiplier
ATR shows adequate volatility
Trade occurs during optimal session hours
Recent momentum is upward
Price not too close to daily high
Strong bullish candle forms
Short Entry Signal uses opposite conditions
Exit Signals trigger when opposing timeframe confluence reaches threshold (default: 3 timeframes)
Recommended Workflow
Select your asset and primary trading timeframe
Observe the dashboard - Look for rows showing mostly green (bullish) or red (bearish)
Wait for alignment - The indicator will show arrows when confluence requirements are met
Check the bottom rows - Review ORB levels and daily ranges for context
Set alerts - Enable TradingView alerts using the built-in alert conditions
Manage risk - Use appropriate position sizing and stop losses based on ORB range or daily ATR
Settings Guide
Basic Settings
Timeframes: Enter comma-separated values (e.g., "1,5,15,30,60,240")
Show Header: Toggle column headers on/off
ORB Minutes: Set opening range period (default: 15 minutes)
Near % for daily highs/lows: Define proximity threshold (default: 0.20%)
Use close for comparisons: Compare using close vs current price
Dashboard Position: Choose from 9 screen positions
Confluence Filters
Minimum Timeframes Aligned: Set required confluence (3-6, default: 5)
Require Higher Timeframe Confirmation: Toggle HTF requirement on/off
Min Higher Timeframes: Specify HTF agreement needed (1-3, default: 2)
Volume Filter
Volume Confirmation: Enable/disable volume filtering
Volume vs Average: Set multiplier threshold (default: 1.5x)
Volume Average Length: Period for volume average (default: 20 bars)
Volatility Filter (ATR)
Volatility Filter: Enable/disable ATR confirmation
ATR Length: Calculation period (default: 14)
Min ATR vs Average: Required ATR level (default: 0.5x = 50%)
ORB Filters
ORB Breakout Distance Required: Toggle distance requirement
Min Breakout % Beyond ORB: Additional breakout threshold (default: 0.10%)
Session Filter
Trade Only During Best Hours: Enable time-based filtering
Session 1: First trading window (default: 0930-1130 EST)
Session 2: Second trading window (default: 1400-1530 EST)
Momentum Filter
Recent Momentum Required: Enable directional momentum check
Lookback Bars: Period for momentum comparison (default: 3 bars)
Daily Range Filter
Block Signals Near Daily Extremes: Prevent entries at extremes
Distance from High/Low %: Minimum distance required (default: 2.0%)
Candle Filter
Strong Directional Candle: Require candle strength
Min Candle Body %: Body-to-range ratio threshold (default: 60%)
Visual Signals
Show Entry Signals: Master toggle for visual signals
Show Arrows: Display entry arrows on chart
Background Color: Enable background highlighting
Best Practices
Start with default settings and adjust based on your trading style and asset volatility
Higher confluence requirements (5-6 timeframes) produce fewer but higher-quality signals
Enable all filters for conservative trading; disable some for more frequent signals
Use the dashboard as confirmation alongside your existing trading strategy
Backtest on your specific instruments before live trading
Consider market conditions—trending vs ranging markets may require different settings
Alerts
This indicator includes four alert conditions with JSON formatting for webhook integration:
Long Entry Signal: Triggers when all long conditions are met
Short Entry Signal: Triggers when all short conditions are met
Long Exit Signal: Triggers when opposing confluence reaches exit threshold
Short Exit Signal: Triggers when opposing confluence reaches exit threshold
Alert messages include ticker symbol, action (buy/sell), price, and quantity for automated trading systems.
Important Notes
This indicator works best on liquid instruments with clear price action
Highly volatile markets may require adjusted ATR and ORB distance settings
Session times are in EST timezone—adjust if trading non-US markets
The ORB calculation requires sufficient price history for the day
Signals are generated in real-time but should be confirmed at candle close
Limitations
Maximum of 6 timeframes can be analyzed due to TradingView's security call limits
ORB calculations may not work correctly on instruments with gaps or irregular sessions
The indicator is most effective during regular market hours when volume and volatility are adequate
Lower timeframes (1m, 5m) may produce more false signals in choppy conditions
License
Mozilla Public License 2.0 (MPL-2.0)
This indicator is licensed under the Mozilla Public License 2.0. You are free to use, modify, and distribute this code under the terms of the MPL-2.0. The full license text is available at mozilla.org
Key license provisions:
You may use this code commercially
You may modify and distribute modified versions
Modified versions must be released under the same license
You must include the original license notice in any distributions
No trademark rights are granted
Disclaimer
This indicator is provided for educational and informational purposes only. It is not financial advice, and past performance does not guarantee future results. Trading involves substantial risk of loss. Always:
Practice proper risk management
Test thoroughly on paper/demo accounts before live trading
Use appropriate position sizing
Never risk more than you can afford to lose
Consult with a financial advisor for personalized advice
The creator assumes no liability for trading losses incurred using this indicator.
Version: 2.0
Pine Script Version: v6
Author: © EliasVictor

Liquidity Hunt Detector PDH/PDL [SmartFoxy]Liquidity Hunt Detector PDH/PDL
The Liquidity Hunt Detector (LHD) is designed to identify and anticipate liquidity grabs around the:
• Previous Day High (PDH);
• Previous Day Low (PDL).
It builds dynamic trigger levels that highlight where price may deliver its first impulse before reaching PDH/PDL.
The Liquidity Hunt Detector (LHD) identifies high-probability reversals and continuations around the Previous Day High (PDH) and Previous Day Low (PDL).
It dynamically tracks the market’s move from the session open, builds trigger levels toward PDH/PDL, and highlights where liquidity is most likely to be taken.
When price taps a Trigger Up/Down level, the indicator generates Long/Short signals with optional confirmation from the integrated MA Ribbon , ensuring only high-quality, trend-aligned setups are shown.
When price interacts with these trigger levels, the indicator generates signals that help traders evaluate the market structure and prepare for potential entries.
Designed for Forex, Crypto, Indices, Stocks , the LHD provides a clean and intuitive structure for navigating intraday liquidity grabs, session impulses, and directional bias shifts.
The indicator is built from three fully independent modules, each of which can be used separately:
Liquidity Hunt Detector (LHD)
Moving Average Ribbon (MA Ribbon)
Previous Day High/Low (PDH/PDL) levels
Liquidity Hunt Detector (LHD) Logic
1.1 Display LHD – Enables or disables the entire Liquidity Hunt Detector module.
1.2 Max Days – Number of previous days used to generate PDH/PDL levels.
1.3 GMT – Corrects all time-based calculations based on your broker/session timezone.
1.4 Calculation Method (Point A Logic)
1) Static Method
Point A = the session’s opening price.
Trigger lines are calculated strictly as a percentage of the move A → PDH or A → PDL.
Intraday fluctuations do not affect the calculation.
2) Dynamic Method
Point A updates using the current intraday high/low:
• If price forms a new low, Point A updates for the PDH-side calculations;
• If price forms a new high, Point A updates for the PDL-side calculations.
This produces trigger lines that reflect the true live market structure rather than a fixed opening reference.
1.5 Main OTT Time (Operational Trading Time)
This is the core time window during which the indicator:
• updates Point A;
• calculates trigger levels;
• validates PDH/PDL;
• draws AB / AC movement structure;
• generates entry signals.
Outside this window, no new signals or recalculations occur.
⚠ If your broker’s first candle opens at a non-standard time (e.g., 00:08), adjust the OTT start time to avoid visual artifacts.
1.6 Show Line A – Displays the opening price level (Point A) until the end of the OTT window.
Style, width, and color are customizable.
1.7 Show Line AB — Price Movement Toward PDH.
Static Method – Single line: A → PDH
Dynamic Method – Two segments:
• A → Daily Low;
• Daily Low → PDH.
If PDH is swept, the “B” label switches to Sweep PDH.
1.8 Show Line AC – Price Movement Toward PDL.
Static Method – Single line: A → PDL
Dynamic Method – Two segments:
• A → Daily High;
• Daily High → PDL.
If PDL is swept, the “C” label switches to Sweep PDL.
1.9 Show Trigger Up Line (LONG Trigger) – Defines the level where the Long signal can activate.
By default, at 50% of the A → PDH movement.
When price touches this line, the script may:
• show a LONG label;
• trigger an alert.
All visual parameters are customizable.
1.10 Show Trigger Up Line (LONG Trigger)
Same logic as Trigger Up, but based on A → PDL.
1.11 Show Main Zone (OTT Zone) – Visual background highlighting of the active OTT window.
Helps instantly see:
• whether signals are allowed;
• how much time remains in the trading window?
Color and opacity are adjustable.
1.12 Upper Zone (toward PDH) – Tracks the protected area towards PDH.
Updates dynamically with new highs.
1.13 Lower Zone (toward PDL) – Tracks the zone toward PDL.
Updates dynamically with new lows.
1.14 Show Labels – Displays reference labels (A, B, C, Trigger Up, Trigger Down).
Label size is customizable.
1.15 Add Price – Adds the exact price value to each label.
1.16 Change Color after Sweep PDH or PDL – After PDH or PDL is broken, the indicator automatically recolors lines and labels to visually confirm the sweep.
1.17 Show SHORT Label – Displays the SHORT entry label when all conditions for a bearish signal are met.
Style parameters are set in the previous blocks.
1.18 Alert on Bearish Trigger Down – Triggers an alert when the price activates the bearish trigger.
1.19 Show LONG Label – Displays the LONG entry label when bullish conditions are met.
Style parameters are set in the previous blocks.
1.20 Alert on Bullish Trigger Up – Triggers an alert when the price activates the bullish trigger.
1.21 Alerts Active Time – Defines a custom time interval during which trigger signals are allowed.
Even if price touches a trigger level,
❗ signals will NOT be generated outside this allowed time.
Useful for:
• avoiding Asian session signals;
• reducing noise in low-liquidity periods.
1.22 Labels and Alerts Display Mode
Two settings modes:
• On Trigger (Instant Mode) – Signals appear immediately when price touches the trigger.
• On Candle Close (Conservative Mode) – Signals form only after the candle closes beyond the trigger level.
A more conservative option.
1.23 Delay LHD Signal Until MA Ribbon Confirms Direction – If enabled, LHD signals will NOT fire until the MA Ribbon produces a matching directional signal.
Logic:
• Price hits the trigger → LHD conditions become “armed”;
• The indicator waits;
• When MA Ribbon confirms trend direction (Long/Short);
• The final LHD label + alert is generated.
This ensures LHD trades are filtered and aligned with MA-based trend confirmation.
⚠ Works only when the MA Ribbon module is active.

Consolidation Value Zones (Recio)Consolidation Value Zones introduces an original algorithm to identify consolidation ranges and locate areas of importance within them. This new method "looks" at the chart and draws zones based on price with the goal of producing actionable zones which appear natural, as if they were found through a human analysis.
> Consider the following...
The chart image above displays Bitcoin, at no specific date, for no specific reason. What I have done here is simply glanced at the chart for about 5 seconds, and circled a few areas which stood out as "obvious" consolidation. It does not take a savant to look at a chart and circle ranging price. However, what we have just done defies many common systems for identifying consolidation. We have located ranges of various zone lengths, as small as roughly 25 bars to as large as roughly 100 bars. Regardless of this, we still determined these zones with our eyes and brain in a few seconds, for some it's practically instant. The issue with us humans doing this, is that we are subjective. We did not really use any concrete rules to determine these areas with our eyes. So the problem becomes "How do we identify these zones in a way which seems natural to us with a repeatable system?" Because of this, my approach is simply a logical attempt to reverse engineer our human intuition.
> Consolidation Value Zones
The name of this indicator is generic. To dissect it, we are identifying consolidation ranges, then using a volume profile to determine the value zone within that range. The specific method used to identify these consolidation zones is something I've personally been referring to as the "skewer" method. Another name that may fit better is "Linear Range Alignment/Overlap".
Ultimately, the goal is to locate a single price level or range that overlaps many adjacent bars.
This should, in theory, return areas of visually obvious consolidation.
> The Skewer Method (Identification Method & Bar Gap Allowances)
One consistent concept across the different identification methods for determining consolidation is time. How long do we chop around before calling it consolidation? This is the "Identification Threshold". Once we have located a consolidation zone "this" wide, we will then consider it as consolidation.
In the chart image above, we are considering a six-bar consolidation formation. The figure on the left shows an example of a perfect raw bar overlap, we can see that the six bars all overlap at one price range. This is a perfect example of what we are looking to identify as consolidation. Unfortunately, if this was all we looked at, we would have a very scarce identification method.
For that reason, we have the example on the right, which shows the additional allowances for the identification of these ranges. At most, the example on the right shows a gapless three-bar overlap. However, if we allow the identification to bridge across the gaps, we are able to draw a zone directly through the center and still be within our parameters. This allowance is the "Bar Gap Allowance" and will determine the leniency of the identification.
Between our identification threshold and bar gap allowance, we can start to piece together how the script is "looking" at our chart.
> Detecting Consolidation (Live Detection)
To aid in transparency and user understanding, the live detection calculation can be seen on the chart as a box, skewering the recent historical bars with a number next to it, indicating the number of bars found as potential consolidation.
As we can see in the chart image above, the script, by default, is looking for a 15-bar consolidation, with a 5-bar gap allowance. In the image, the specific gap count is labeled, we can see the script scan backwards as far as it can before counting five gaps in the data. Once that occurs, the detection stops.
Notice how the zone found is a range, consisting of all price levels which meet the parameters. The lower level of the range only had two gaps, but the upper level reached five.
> Consolidation Range and Value Zones (Volume Profiles)
Once the script has identified the consolidation formation, it calculates a volume profile across the identified consolidation range. From this it calculates and draws the Point of Control (POC) and Value Area in addition to the full consolidation range.
Once we have our zones drawn, and understand what they identify, we can go one step further and apply concepts from volume profile trading.
Range High/Low: Displays the current extent of the identified consolidation.
Value High/Low: Shows the specific area within the consolidation where buyers and sellers found the most value.
POC: The single point, where the most volume was transacted during consolidation.
In a balanced market, we would anticipate price to rotate around POC, oscillating from Value High (VAH) to Value Low (VAL). In contrast, a market in motion moves directionally, building volume at new price levels as value, naturally the POC shifts with it.
> Zone Extensions
Unlike many other scripts, there is no mitigation logic at play here, since crossing a zone simply tells us "buyers and sellers are not currently active here", but it does not guarantee that value cannot return or react from previous areas of value.
Obviously the current zone will always be most relevant, but historical zones can retain relevance depending on the context of the market.
Remember: Each area of consolidation is an area where buyers and sellers were once facing off, resulting in price's consolidation. Amidst this, the value zone was the area of greatest agreement between the participants at that time. When moving outside of a range, we would typically look at historical value areas and price's interaction with them for further context.
Due to the ever changing market, there is no fixed extension lookback that will cover every scenario. By default, the Extension Lookback is "1", meaning the script will extend the most recent zone forward until a new zone is detected.
Note: For clarity, zone extensions are colored differently from core zones.
The following chart image shows a few examples of these unique interactions.
As seen in the chart image, looking to previous areas of value as well as POC can provide context in the form of acceptance or rejection at these levels, providing further insight into the auction for us to respond to.
The zones do contain logic to maintain a clean display. By default, the zones extend conditionally when price returns to the previous consolidation range. If desired, the zones can be extended regardless of price action; this can be toggled with the option "Regardless Extension Mode", as seen below.
> Hollow Candles & Zone Merging
When consolidation is identified, a hollow candle is drawn; these can be used to see exactly when each zone is identified. It is important to understand that consolidation zones stemming from the same origin are merged into one zone. This is a frequent occurrence when the consolidation threshold is passed, but the consolidation continues. For this reason you will often see multiple hollow candles in the later areas of the zones.
Similarly, zones from different origin points that overlap are also merged into one consolidation zone. This ensures that no core zones overlap.
Additionally, every time a zone is merged, a new volume profile for the area is calculated.
> Bar Gap Allowance Type (Technical Explanation)
The specific bar gap allowance value can be altered, but so can the type of allowance being used. While some analyses may benefit from counting the total amount of bar gaps within the consolidation, others may benefit from detecting based on consecutive bar gaps.
The chart image above displays the gap counts for each gap allowance type.
The total bar gap allowance type will count until the gap amount is reached, then terminate detection once the allowed number of gaps has been exceeded.
The consecutive bar gap allowance type resets its count once it finds a valid bar within range, by doing so, it only counts the bars that separate each island of in-range bars.
Both methods have merit.
> Implementation
This identification method has proven effective to identify consolidation across market types. As a result, there cannot be one configuration of settings to fit every application. Adapting the detection type and method for each trader's specific market conditions is highly recommended.
When determining parameters, it is helpful to consider time, as it plays a major role in the identification method.
On a 1D chart, the default threshold of 15 corresponds to 15 days, or about 3 weeks depending on the ticker. To identify periods of one-week consolidation, a threshold of 5 would be suitable. To detect perfect gapless weeks, a bar gap allowance of 0 could be used, as seen in the chart image below.
Additional Example:
In the chart image above, we see a 15-second forex chart over the span of a few hours. The detection parameters are set up to detect 15-minute consolidation with a 2-minute max dead zone (consecutive bar gap).
> Detection Source
By default, the script detects consolidation ranges using the full extent of candle wicks. While this is traditional, detection can also be done using only the candle bodies. These identifications are much more nuanced, detecting only from confirmed candle price action; they do not trigger at the same frequency as wick detection.
Optionally, a "Wick/Body Average" can be chosen as the source for detection; as the name implies, this uses the average value between the candle body and its respective wick.
> Additional Settings
The settings mentioned thus far serve as core parameters for identifying consolidation. The following parameters are simply included for the benefit of the advanced user. It is not recommended to adjust these settings under normal circumstances.
- Value Area Percent: Default = 68.26, while traditionally 70 for volume profiles, 68.26 is accurate to the values of a standard bell-curve distribution. The differences are minimal in application.
- VP Rows: Default = 99, Sets the number of rows to be used when calculating the Volume Profiles (VP); note that higher values will lead to a slower calculation. Max value: 999
> Final Notes
If you have made it this far, thank you for reading.
I hope you find value in this new consolidation identification system and understand the logic behind it.
That's it.
유료 스크립트

Breakout ScannerThis is a Breakout Scanner that shows you the immediate trend across 4 higher timeframes for up to 10 different tickers. It calculates a score from 1 to 3 for bullish and -1 to -3 for bearish based on where price is currently at compared to the previous higher timeframe’s candle levels.
When price is breaking out of the previous higher timeframe candle’s range, then it will have a score of 3 for bullish breakout or -3 for bearish breakout. When price is above the high or below the low of multiple different higher timeframe candles, you can expect price to continue the breakout and move to a new area of price range.
The brighter red or green the color is, the stronger the trend is on that timeframe. When it shows a bright green or red box on the far right side of a ticker, it is notifying you that the ticker is bullish or bearish on all timeframes and trending strongly, so switch over to that chart and look to trade in the direction of that trend.
The tickers, colors and time frames can be customized to suit your preference and you can also turn off as many tickers or time frames as you’d like if you want less tickers or time frames to show up on the indicator. It also includes alerts for when all timeframes are bullish or all timeframes are bearish for one ticker.
Make sure to keep each timeframe set to a timeframe that is higher than your chart timeframe.
Bullish Scoring & Colors
If the current candle close is above the midline of the higher time frame candle, it is given a score of 1 and a dark green background. If the current candle close is above the higher timeframe candle body, then it is given a score of 2 and a medium green background. If the current candle close is above the high of the higher time frame candle, it is given a score of 3 and a bright green background.
The higher the score the stronger the bullish trend and the brighter green the color will be.
Bearish Scoring & Colors
If the current candle close is below the midline of the higher timeframe candle, it is given a score of -1 and a dark red background. If the current candle close is below the higher timeframe candle body, then it is given a score of -2 and a medium red background. If the current candle close is below the low of the higher timeframe candle, it is given a score of -3 and a bright red background.
The lower the score, the stronger the bearish trend and the brighter red the color will be.
Total Score Display
On the right side of the indicator table, there is a column that displays the total score by adding all the scores together so you can easily tell the overall strength of the trend across all timeframes. Wait for the trend score to be at least 75% of the possible score to trade so you can ensure you are only trading very strong trends and increase your probability of winning your trade. The total score will update according to how many time frames you have enabled in the settings. You can also turn on or off the total score count if you prefer. The default setting is off.
All Timeframe Trends Agree
When all of the timeframes that you have turned on are in the same direction at the same time, a green or red box will appear on the far right side of the scanner. This is a visual cue that lets you know the strongest trending markets without having to read any of the numbers. Make sure to check out the charts for the markets that have a green or red box on the far right side and look for potential trend trading opportunities.
Alerts
You can set alerts for when all time frames for a certain ticker are bullish or bearish. If you have some time frames turned off at the time of creating your alerts, then it will only require all time frames that are on to be all bullish or bearish to generate an alert. Make sure to set your alerts to once per bar close to ensure you don’t get premature alerts that aren’t yet valid.
Best Way To Use The Scanner
For best results, make sure you wait for the trend to show all bullish or all bearish at the same time and then look to trade in the direction of the strong trend. If you can be patient enough to do that, you will increase the probability of winning your trade because you are trading with the direction of the overall higher timeframe trend when the market is trending strongly and making new highs or lows.
When one of the markets in the scanner shows all timeframes trending, go to that chart and see how price action is reacting to the previous higher timeframe candle levels. You can see those levels easily by adding our Higher Timeframe Candle Levels indicator to your chart and using the same timeframes as your Breakout Scanner is using.
If price is holding the higher timeframe candle levels well, then look to place trades in the direction of the trend that the Breakout Scanner is showing.
Other Indicators To Pair This With
Use this in combination with our Higher Timeframe Candle Levels indicator so you can see all of these levels being used to calculate the trend strength scores and watch how price reacts to those levels. You should also use our Trend Strength Indicator to easily read the historical trends of price compared to the higher timeframes and use those trends to guide you on when to trade and which direction to trade.
Trend Strength Indicator, Higher Timeframe Candle Levels and the Breakout Scanner all use the same levels to calculate the trend scores so they are designed to work all together to help you quickly be able to read a chart and find what direction to trade in.

SibayakNa - v16.1 Entry Setup Indicator to confirm Entry Setup with simple MA Crossing, RSI, Volume, ATR, OBV, ADX at MTF.


Trend & Strength Detector TSDTrend Strength Detector (TSD)
*Objective Trend Quality Measurement for Educational Market Analysis*
Note: This mathematical framework is a proprietary quantitative model developed by Ario Pinelab, inspired by classical EMA, ADX, RSI and MACD principles, yet not documented in any public technical or academic publication.
## 🎯 Purpose & Design Philosophy
The ** Trend Strength Detector- TSD ** is an educational research tool that provides **quantitative measurement of trend quality** through two independent scoring systems (0-100 scale). It answers the analytical question: *"How strong and aligned is the current market trend environment?"*
This indicator is designed with a **modular, complementary approach** to work alongside various analysis methodologies, particularly pattern-based recognition systems.
## 🔗 Complementary Research Framework
### Designed to Work With Pattern Detection Systems
This indicator provides **environmental context measurement** that complements qualitative pattern recognition tools. It works particularly well alongside systems like:
- **RMBS Smart Detector - Multi-Factor Momentum System**
- Traditional chart pattern analyzers
- Any momentum-based pattern identification tools
🔍 **To find RMBS Smart Detector:**
- Search in TradingView Indicators Library: `" RMBS Smart Detector - Multi-Factor Momentum System"`
- Look for: *Multi-Factor Momentum System*
- By author: ` `
### Why This Complementary Approach?
**Trend Quality Measurement** (TSD - this tool) provides:
- ✅ Structural trend alignment (0-100 score)
- ✅ Momentum intensity levels (0-100 score)
- ✅ Environment classification (Strong/Moderate/Weak)
- 📌 **Answers:** *"HOW STRONG is the underlying trend environment?"*
### Educational Research Value
When used together in a research context, these tools enable systematic study of questions like:
- How do reversal patterns behave when Strength Score is above 70 vs below 30?
- Do continuation patterns in weakening environments (declining scores) show different characteristics?
- What is the correlation between high Alignment Scores and pattern "success rates"?
- Can environment classification help identify genuine trend initiation vs false starts?
⚠️ **Important Note:** Both tools are **independent and work standalone**. TSD provides value whether used alone or with other analysis methods. The relationship with RMBS (or any pattern tool) is **complementary for research purposes**, not dependent.
---
###Mathematical Foundation
##TSA Formula: scoring method developed by Ario
-Trend Model (0 – 100)
TAS = EMA Alignment (0–40) + Price Position (0–30) + Trend Consistency (0–30)
EMA Alignment checks EMA_fast vs EMA_slow vs EMA_trend structure.
Price Position evaluates if Close is above/below all EMAs.
Consistency = 3 × max(bullish,bearish bars within 10 candles).
-Strength Model (0 – 100)
Strength = ADX (0–50) + EMA Slope (0–25) + RSI (0–15) + MACD (0–10)
ADX measures trend energy; Slope shows EMA momentum %;
RSI assesses zone positioning; MACD confirms directional agreement.
Note: This formula represents a proprietary quantitative model by Ario_Pinelab, inspired by classical technical concepts but not published in any external reference.________________________________________
📊 Environment Classification
Based on Total Strength Score:
🟢 Strong Environment: Score ≥ 60
→ Well-defined momentum, clear directional bias
🟡 Moderate Environment: 40 ≤ Score < 60
→ Mixed signals, transitional conditions
🔴 Weak Environment: Score < 40
→ Ranging, choppy, low conviction movement
Color Coding:
• Green background: Strong (≥60)
• Yellow background: Moderate (40-59)
• Red background: Weak (<40)
________________________________________
📈 Visual Components
Main Chart Display
Score Labels (Top-Right Corner):
┌─────────────────────────────────┐
│ 📊 Alignment: 75 | Strength: 82 │
│ Environment: Strong 🟢 │
└─────────────────────────────────┘
Color-Coded Background:
• Environment strength visually indicated via background color
• Helps quick identification of market regime
• Customizable transparency (default: 90%)
Reference Lines:
• Dotted line at 60: Strong/Moderate threshold
• Dotted line at 40: Moderate/Weak threshold
• Mid-line at 50: Neutral reference
________________________________________
🔧 Customization Settings
Input Parameters
The best setting is the default mode.
🚫 Important Disclaimers & Limitations
What This Indicator IS:
✅ Educational measurement tool for trend quality research
✅ Quantitative assessment of current market environment
✅ Complementary analysis tool for pattern-based systems
✅ Historical data analyzer for systematic study
✅ Multi-factor scoring system based on technical calculations
What This Indicator IS NOT:
❌ NOT a trading system or signal generator
❌ NOT financial advice or trade recommendations
❌ NOT predictive of future price movements
❌ NOT a guarantee of pattern success/failure
❌ NOT a substitute for comprehensive risk management
________________________________________
Known Limitations
1. Lagging Nature:
⚠️ All components (EMA, ADX, RSI, MACD) are calculated
from historical price data
→ Scores reflect CURRENT and RECENT conditions
→ Cannot predict sudden reversals or black swan events
→ Trend measurements lag actual price turning points
2. Whipsaw Risk:
⚠️ In choppy/ranging markets, scores may fluctuate rapidly
→ Moderate zone (40-60) can see frequent transitions
→ Low timeframes more susceptible to noise
→ Consider higher timeframes for stable measurements
3. Component Conflicts:
⚠️ Individual components may disagree
→ Example: Strong ADX but weak RSI alignment
→ Scores average these conflicts (may hide nuance)
→ Check individual components for deeper insight
4. Not Predictive:
⚠️ High scores do NOT guarantee continuation
⚠️ Low scores do NOT guarantee reversal
→ Measurement ≠ Prediction
→ Use for CONTEXT, not SIGNALS
→ Combine with comprehensive analysis
________________________________________
Risk Acknowledgments
Market Risk:
• All trading involves substantial risk of loss
• Past performance (even systematic studies) does not guarantee future results
• No indicator, system, or methodology can eliminate market risk
Measurement Limitations:
• Scores are mathematical calculations, not market predictions
• Environmental classification is descriptive, not prescriptive
• Strong measurements can deteriorate rapidly without warning
Educational Purpose:
• This tool is designed for LEARNING about market structure
• Not designed, tested, or validated as a standalone trading system
• Any trading decisions are user’s sole responsibility
No Warranty:
• Indicator provided “as-is” for educational purposes
• No guarantee of accuracy, reliability, or profitability
• Users must verify calculations and apply critical thinking
Open Source
Full Pine Script code available for educational study and modification. Feedback and improvement suggestions welcome.
“All logic is presented for research and educational visualization.”
---

martingle trading bot⚙️ Martingle Trading Bot — Complete Description
The Martingle Trading Bot is a fully automated volatility-band visualization system that demonstrates the principles of breakout-based market logic combined with martingale-style position scaling. It is designed purely for educational, analytical, and backtesting visualization purposes on TradingView.
This tool shows how a simple mathematical band system can be used to define intraday breakout regions, evaluate sequential trade logic, and visualize how martingale-style compounding affects a trade sequence when price fluctuates around daily reference levels.
🧠 Conceptual Overview
The system works on a simple yet powerful market observation: markets oscillate within short-term ranges and occasionally break out beyond expected volatility envelopes. To capture and visualize these events, the Martingle Trading Bot uses a daily reset mechanism that defines a reference price, builds trading bands around it, and triggers theoretical buy/sell signals when price exceeds certain thresholds.
📅 1️⃣ Daily Reference Price (Central Core)
Every trading day begins with a reference price — typically the daily open. This reference acts as the neutral center for the system’s calculations. The indicator resets this reference daily and adjusts when target zones are hit, maintaining realistic adaptive logic.
📊 2️⃣ Dynamic Bands and Target Zones
From the reference price, the indicator constructs two key structures:
- Primary Band Range – defines the immediate trading zone using the “band range.”
- Target Band Range – extends beyond the primary band to define logical take-profit zones.
Price action beyond these regions indicates directional expansion and potential breakout strength.
📈 3️⃣ Breakout Logic (Trade Signal Simulation)
- When price crosses the upper band → bullish breakout condition.
- When price crosses the lower band → bearish breakout condition.
Each breakout is visualized on the chart and represents a theoretical position change.
🧮 4️⃣ Martingale Position Scaling
When a breakout occurs against the prior position, the system multiplies or increments position size based on user-defined settings. This models martingale-style compounding and resets when a target is reached. It helps illustrate how scaling affects drawdown and recovery potential.
💹 5️⃣ Virtual PnL Tracking
The indicator keeps virtual stats of profit/loss, win rate, and trade count. These metrics are illustrative only — no live or guaranteed results are implied.
🧭 6️⃣ Visual Chart Elements
Buy/Sell labels, take-profit labels, quantities, and color-coded zones appear on the chart to clearly display trade logic and band structure.
⚙️ 7️⃣ User Inputs
- Band Range
- Target Distance
- Initial Quantity
- Martingle Quantity
- Gap Detection Point
- Label Display Toggles
- Optional end-of-day reset
🧩 8️⃣ Use Cases
Ideal for traders, developers, and educators who want to study breakout systems, risk progression, and position scaling.
⚠️ 9️⃣ Risk Disclosure
This is not a live trading bot. It does not execute trades or guarantee profit. Martingale logic carries significant risk — consecutive losses can exponentially increase exposure. Use for study purposes only.
📜 License and Credits
Developed by @algo_coders.
Licensed under the Mozilla Public License 2.0 (MPL 2.0).
Uses internal bar-counting functions for session management.
🧠 Summary
The Martingle Trading Bot combines volatility envelopes, daily resets, and martingale scaling to visualize compounding risk behavior. It is an educational research tool for understanding probability-based trading concepts — not financial advice or a trading signal provider.

Willy ORB for Gold – Session Presets (NY 5m)What it does:
Plots the opening-range high/low for the main Gold sessions (Shanghai, Tokyo, Sydney, Frankfurt, London, New York 5-minute OR by default). It projects TP1/TP2 expansion targets, supports a timezone offset so opens line up with your broker, and includes breakout alerts on confirmed closes.
⸻
Why it’s Gold-friendly
• New York (COMEX pit): 5-minute opening range at ~20:20 local (via your offset) to capture the most active burst.
• London / Frankfurt: strong European volatility windows for XAU/USD.
• Shanghai / Tokyo / Sydney: structure-setting sessions before momentum builds.
⸻
Features
• Session presets: SH, TK, SY, FR, LDN, NY (5m) — toggle individually
• 15m OR for all sessions except NY (5m) by default (editable per session)
• TP1 / TP2 expansion targets (user-defined multiples)
• Labels for 15m/5m range and targets; customizable styles
• Timezone offset control (aligns lines to your local clock)
• Daily auto-reset for clean levels
• Alerts: “Closed Above Range High” / “Closed Below Range Low” per session
⸻
How to use
1. Add to chart (best on 1–15m).
2. In settings → Gold Sessions, toggle the sessions you want.
3. Set “My time offset from chart (hours)” so session lines match your broker time.
4. Trade the breakouts: when price closes beyond the session high/low, TP levels plot automatically.
⸻
Parameters (quick guide)
• Targets: TP1/TP2 multiples (e.g., 1.0 and 2.0).
• Labels: left/right label placement, line styles/colors.
• Sessions: enable/disable + choose each session’s OR length (NY defaults to 5m).
⸻
Tips for XAU/USD
• London often gives the cleanest first breakout.
• New York tends to drive continuation after data releases.
• Consider pairing with volume/volatility or HTF trend for confluence.
⸻
Notes
• Built in Pine Script v6.
• Indicator (not a strategy). For backtests, use a companion strategy that trades the closes beyond the OR with SL at the opposite side and TP by R.
⸻
Disclaimer
For educational purposes only. Not financial advice. Always backtest and manage risk.

Breakout Boxes [ChartPrime]⯁ OVERVIEW
The Breakout Boxes indicator identifies key structural levels by detecting and aligning two consecutive pivots — forming confirmation zones where potential breakouts are most likely to occur. Once two pivots align within a defined ATR range, the indicator constructs a Breakout Box around that area, tracking volume distribution and breakout strength. When price breaks above or below these boxes, breakout labels (⯁ BreakUp / BreakDn) are displayed to confirm trend continuation.
⯁ KEY FEATURES
Pivot-Based Detection: Uses a customizable pivot length to identify market swing highs and lows.
Two-Pivot Alignment Logic: A breakout box is only created when two pivot highs or lows form near the same level, confirming structural alignment and increasing breakout reliability.
Dynamic Box Generation: Builds upper and lower boxes once pivot alignment is confirmed, adapting automatically to new structures.
Volume Distribution Analysis: Each box measures total traded volume and separates it into bullish and bearish components, showing buy/sell percentages inside the range.
The volume data is calculated in real time as long as the box remains active and unbroken, allowing traders to monitor live accumulation or distribution before a breakout occurs.
Breakout Confirmation Signals: Labels appear when price decisively breaks above the upper box (⯁ BreakUp) or below the lower one (⯁ BreakDn).
Adaptive ATR Scaling: Box size dynamically adjusts to volatility, maintaining consistent proportions across assets and timeframes.
Color-Coded Visualization: Upper (bearish) boxes use pink tones; lower (bullish) boxes use green, both with transparent fill for volume clarity.
Automatic Box Resetting: Previous boxes close when a new pivot pair forms, ensuring only the most relevant structure is active.
⯁ USAGE
Watch for Two Pivot Alignments — the indicator only activates when structural confluence exists, reducing false breakout signals.
Upper Boxes represent resistance formed by two aligned swing highs; a breakout above indicates potential bullish continuation.
Lower Boxes represent support formed by two aligned swing lows; a breakdown below indicates bearish continuation.
Analyze the Volume Ratio inside each box — higher buy volume in upper boxes supports bullish breakouts, while higher sell volume in lower boxes supports bearish moves.
Use this tool alongside trend indicators or higher timeframe context to confirm the direction of breakouts.
⯁ CONCLUSION
The Breakout Boxes indicator refines breakout analysis by requiring two aligned pivots to validate structural zones. By combining pivot confluence with volume distribution and adaptive ATR scaling, it provides a precise, data-backed visualization of breakout strength and direction — a powerful tool for structure-based trading confirmation.

Killzone Session High/Low Levels [SmartFoxy]Killzone Session High/Low Levels
The Killzone Session High/Low Levels indicator by SmartFoxy provides a complete intraday framework for understanding session-based liquidity, market structure rotation, and breakout behavior across global trading sessions.
It automatically plots the High/Low ranges for each selected session, highlights session killzones, and tracks breakout events with optional alerts.
This tool is designed for traders who rely on session dynamics (Asia, Frankfurt, London, New York) to identify liquidity targets, sweep zones, key ranges, and continuation/reversal opportunities.
________________________________________
How It Works
The indicator detects the active trading sessions for each day and builds structural High/Low ranges for them:
• Asia Session Range (High/Low);
• Frankfurt Session Range;
• London Session Range;
• New York Session Range;
• Optional custom session (NY Open, or any killzone).
For each session, the script can display:
• Session box or column;
• High/Low levels;
• Labels for every range (H/L);
• True session boundaries using user-defined timezone;
• Auto-extended levels up to the latest candle;
• Break levels after a breakout;
• Conditional removal or recoloring after a level is breached.
This gives traders a clean visual map of session liquidity and how price interacts with it throughout the day.
________________________________________
Key Features
1. Multiple Global Sessions •➤ Asia, Frankfurt, London, New York, plus one custom session for advanced killzone mapping.
2. Session High/Low Liquidity Levels •➤ Automatic plotting of every session’s High and Low, with optional labels and price markers.
3. Session Boxes or Columns •➤ Two display modes allow traders to visualize the session either as a filled box or a clear vertical column.
4. Breakout Logic & Temporary Levels .
When price breaks a session High/Low:
• Levels can be extended for a selected number of bars
• Or removed instantly after a breakout
• Or recolored to highlight the sweep event
This enables clean identification of liquidity grabs, breakouts, and continuation setups.
5. Alerts for Session Breakouts .
Set alerts when price breaks:
• Any session level
• Only levels formed on the current day
Perfect for traders who want real-time notifications of sweeps or key structure breaks.
6. Full Customization
You can configure:
• Session times;
• Timezone;
• Colors;
• Labels;
• Line styles and widths;
• Breakout behavior;
• Killzone range handling.
Everything is adjustable to match any trading style.
________________________________________
How to Use
1. Enable the sessions you want to track •➤ Asia, Frankfurt, London, New York, or custom.
2. Choose display mode
Box mode for visual range blocks;
Column mode for clean vertical alignment.
3. Enable High/Low Levels .
These act as liquidity magnets and key rejection zones.
4. Turn on Breakout Levels (optional)
Useful for spotting sweeps and continuation setups.
5. Turn on Alerts if you want notifications when price breaks levels.
6. Use session levels as liquidity reference points .
They work exceptionally well with smart money concepts (SMC), ICT, and intraday structure analysis.
________________________________________
Why This Indicator Is Useful
Shows exactly where liquidity is placed each session;
Highlights market structure transitions as sessions hand over control;
Helps identify stop hunts, sweeps, reversals, and continuation patterns;
Provides real-time alerts for structural breaks;
Organizes the chart and reduces noise;
Works with any intraday timeframe and any market.
This makes it valuable for scalpers, day traders, and SMC/ICT-style analysts.
________________________________________
Summary
Killzone Session High/Low Levels delivers a complete, highly customizable intraday mapping system based on global trading sessions.
It clarifies the session structure, reveals liquidity targets, and empowers traders to make confident trading decisions using clean, objective market data.
