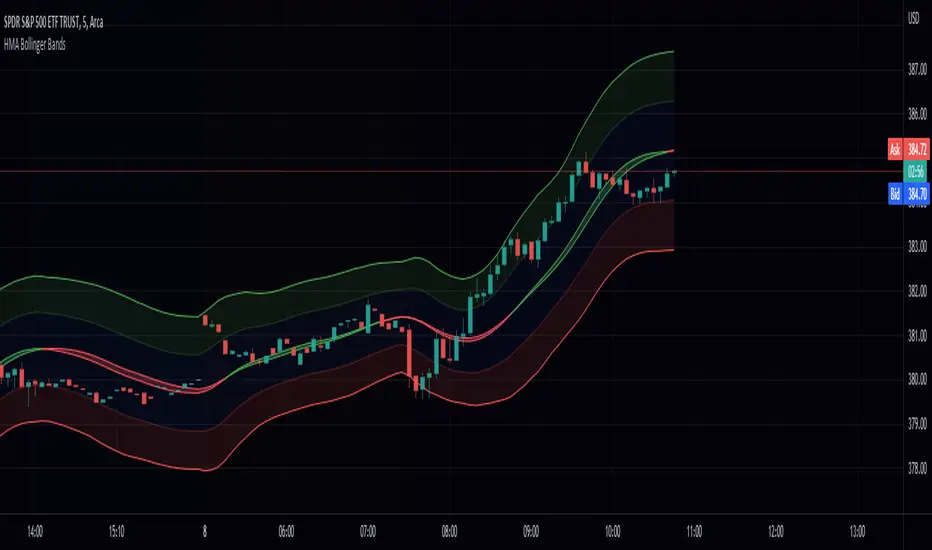
Hull Moving Average Bollinger Bands (HMABB)Hello! This is simply Bollinger Bands calculated with HMA! Heres a recap on both.
The Hull Moving Average (HMA) attempts to minimize the lag of a traditional moving average while retaining the smoothness of the moving average line. Developed by Alan Hull in 2005, this indicator makes use of weighted moving averages to prioritize more recent values and greatly reduce lag.
Bollinger Bands are envelopes plotted at a standard deviation level above and below a simple moving average of the price. Because the distance of the bands is based on standard deviation, they adjust to volatility swings in the underlying price. Bollinger Bands use 2 parameters, Period and Standard Deviations, StdDev.
볼린저 밴드 (BB)
[klemenxina] BB%+BB% based indicator. It tracks the percentage distance between price and its deviations. Using this it shows overbought and oversold levels, signalling a good chance for mean reversion.
While testing the new BB filter update on my original indi. I tested a few ways of input filtering and later found what became this indi. I decided to publish it separate since the core of the indi changed.
Includes everything that the other BB indi has:
- OB/OS zones
- soft signals
- realtime divs
- alerts
- 5 baseline MA optons
- indi trend
I also included the filter signal update in this one, but since there is less signals its off by default.

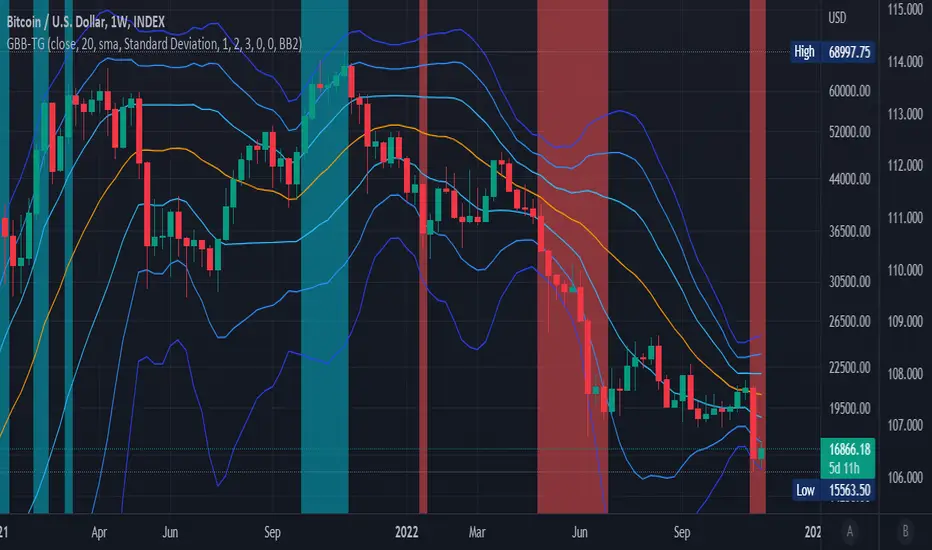
Generalized Bollinger Bands %B And Bandwidth (Tartigradia)Bollinger Band is simply a representation of the rolling average of price and its standard deviation around the average (called the "basis").
This indicator generalizes the Bollinger Band by implementing many different equations to calculate the Bollinger Bands beyond the standard deviation and sma, and then plot the %B (where the current price falls inside the Bollinger Band), Bandwidth (size of the Bollinger Band) as well as the Bollinger Band itself and a reproduction of the OHLC price candles in a separate pane.
Whereas other Bollinger Bands indicators often just change the basis but not the stdev calculation, the correct way to change the basis is to also change it inside the stdev calculation.
Advanced features such as temporal discounting (ie, newer bars can have more weights), median absolute deviation and multiple sigma bands (eg, 3-sigma) are available.
Up to 3 different Bollinger Bands can be displayed, and the background can be highlighted when price is overbought/oversold (beyond the Bollinger Band of choice). Tip: BB3, which is the bollinger band with standard deviation of 3, which represents 99% of observed values in the lookback period, is a good choice to highlight overbought/oversold conditions.
Three "Sentiment Bars" are provided to see at a glance the sentiments on the price action relative to the Bollinger Bands as reflected by the %B value.
Usage:
Use the %B as a measure of sentiment: bullish if > 0.5, bearish if < 0.5. You can use the Sentiment Bars at the bottom for a quick reference: aqua if bullish, red if bearish, gray if undefined (too close to the middle line).
Use the bandwidth as a measure of volatility: higher is more volatile, lower is less.
When overbought, it can be a good time to sell/short. Use a higher Bollinger Band Multiplier such as 3 or more to reduce false positives.
When oversold, it can be a good time to buy/long. Use a higher Bollinger Band Multiplier such as 3 or more to reduce false positives.
Consider setting a much tighter lookback period of 4 as recommended in backtested works (en.wikipedia.org), use zlma instead of sma, and finally set a higher timeframe for the Bollinger Bands than the one you are currently studying. Then, the Bollinger Bands can help in detecting overbought and oversold regions (price going "out of bands").
Note that I tried to automate the setting of a higher timeframe, but for some reason the output is different when I manually do it using request.security() than when it's in indicator(timeframe=""). If someone has any suggestion as to why it happens, please let me know! (You can try it for yourself by uncommenting the auto_timeframe parameter line).

Generalized Bollinger Bands (Tartigradia)Bollinger Band is simply a representation of the rolling average of price and its standard deviation around the average (called the "basis").
This indicator generalizes the Bollinger Band by implementing many different equations to calculate the Bollinger Bands beyond the standard deviation and sma.
Whereas other Bollinger Bands indicators often just change the basis but not the stdev calculation, the correct way to change the basis is to also change it inside the stdev calculation.
Advanced features such as temporal discounting (ie, newer bars can have more weights), median absolute deviation and multiple sigma bands (eg, 3-sigma) are available.
Up to 3 different Bollinger Bands can be displayed, and the background can be highlighted when price is overbought/oversold (beyond the Bollinger Band of choice).
Tip: BB3, which is the bollinger band with standard deviation of 3, which represents 99% of observed values in the lookback period, is a good choice to highlight overbought/oversold conditions.
Usage:
Use it as usual Bollinger Bands, as a measure of volatility, and to setup stop losses.
Use the bandwidth as a measure of volatility: higher is more volatile, lower is less.
When overbought, it can be a good time to sell/short. Use a higher Bollinger Band Multiplier such as 3 or more to reduce false positives.
When oversold, it can be a good time to buy/long. Use a higher Bollinger Band Multiplier such as 3 or more to reduce false positives.
Consider setting a much tighter lookback period of 4 as recommended in backtested works (en.wikipedia.org), use zlma instead of sma, and finally set a higher timeframe for the Bollinger Bands than the one you are currently studying. Then, the Bollinger Bands can help in detecting overbought and oversold regions (price going "out of bands").
Note that I tried to automate the setting of a higher timeframe, but for some reason the output is different when I manually do it using request.security() than when it's in indicator(timeframe=""). If someone has any suggestion as to why it happens, please let me know! (You can try it for yourself by uncommenting the auto_timeframe parameter line).
If you want to plot the indicator in a separate pane, and to also plot %B and bandwidth, I made another indicator "Generalized Bollinger Bands %B and Bandwidth by Tartigradia" that does that.
QQE Student's T-Distribution Bollinger Bands Oscillator Credit to all of the developers on this project (aka all of the places I got the code from lol) @eylwithsteph @storma @Fractured @lejmer @AlexGrover @Montyjus @Jiehonglim @StephXAGs @peacefulLizard50262 @gorx1 @above-c-level
This script utilizes @above-c-level 's Student's T-Distribution script to give us a great estimation of volatility. I took this idea and apply it to the QQE filter! That being said I have added a boat load of features as to make this script as useful to as many people as possible. This is the Osc version
Included averages: 'TMA', 'ALMA', 'EMA', 'DEMA', 'TEMA', 'WMA', 'VWMA', 'SMA', 'SMMA', 'HMA', 'LSMA', 'JMA', 'VAMA', 'FRAMA', 'ZLEMA', 'KAMA', 'IDWMA', 'FLMSA', 'PEMA', 'HCF', 'TIF', 'MF', 'ARMA', 'DAF', 'WRMA', 'RMA', 'RAF', 'A2RMA', 'QQE 1', 'QQE 2','Centroid',"Harmonic Mean","Geometric Mean","Quadratic Mean","Median","Trimean","Midhinge","Midrange","VWAP"
Included Features: Smoothing, Additional Moving Average, Log Space, Mean Momentum via Derivative, Normalization, Convergence DIvergence, Candle View
Use this just like macd/rsi but instead this directly reflects the band version! It also shows really valid support and resistance. Use this in combination with the band version for more power.

RSI & BB QQE Mod (highlight)This script is a combination of the RSI, QQE and BB
Here is an explanation on how I combined them, and how they are used:
- RSI (Relative Strength Index)
- Display a smoothed version of the RSI to identify "oversold" and "overbought" market phases
- Used to calculate a QQE
- QQE (Quantitative Qualitative Estimation)
- Used to identify trend direction and trend strength
- Used to set a basis for the BB
- BB (Bollinger Bands)
- Used with QQE as a basis to determine a relative definition of "high RSI" and "low RSI"
- Used with QQE as a basis to determine the volatility of the RSI at a given moment
- Used to predict pivot points
Here are the main signals:
- When "RSI Smoothed" line above the Upper BB then "RSI Smoothed" line turns green
- Also , display green background color highlight
- Also , and if "RSI Smoothed" is above the overbought line then display a second green background color highlight
- When "RSI Smoothed" line bellow the Lower BB then "RSI Smoothed" line turns red
- Also , display red background color highlight
- Also , and if "RSI Smoothed" is bellow the oversold line then display a second red background color highlight
A tool codded to be aesthetically pleasing and VERY customisable:
- Designed for both light theme and dark theme users
- Value can be easily modified in the settings
- Colors can be easily swapped in the settings
- Opacity of "fill" & "bgcolor" regrouped as a single input
A tool codded to be easy to read and to learn from:
- Sources and inspirations all listed within the script
- Structure easily identifiable (to understand with little to no effort how the script works)
Notes :
- This script is lagging, because of that I do recommend using it on relatively large timeframe
- This script is OpenSource, feel free to reuse it, but if so please remember to include a link to my script in your sources
- This script is not a magical tool, use at your own risk

Power Of Stocks - Bollinger Band & 5Ema Indicator - Keanu_RiTz
Power of Stocks - Bollinger band & 5ema Strategy
In this script you get to take Buy/Sell trades using the 3 options mentioned below.(Alerts with price levels for buy/sell at , SL & Target are included in this one)
1. Combined Strategy :- uses confirmation from both strategies to trade.
2. Bollinger band Strategy :- use the Bollinger band Strategy to trade.
3. 5ema Strategy :- use the 5ema Strategy to trade.
1. Combined Strategy :-
for Selling :- we will go short/sell only when conditions of both strategies are satisfied.
i.e. when a candle is completely above the upper Bollinger band & completely above the 5ema then it will be our Alert Candle.
We Short/Sell only when the low of the Alert candle is broken or when the candle closes below the close of the Alert Candle.
SL will be above high of the Alert Candle. Target will be minimum 1:3 or as per your emotions.
for Buying:- we will go Long/Buy only when conditions of both strategies are satisfied.
i.e. when a candle is completely below the lower Bollinger band & completely below the 5ema then it will be our Alert Candle.
We go Long/Buy only when the high of the Alert candle is broken or when the candle closes above the close of the Alert Candle.
SL will be below low of the Alert Candle. Target will be minimum 1:3 or as per your emotions.
2. Power of Stocks - Bollinger Band Strategy :-
Bollinger band with standard deviation = 1.5
when a candle is completely above the upper Bollinger band, that candle will be called a signal/alert candle.
Initiate a Sell trade when that alert candles low is broken. SL will be above high of that alert candle.
Risk to reward ratio will be 1:4 i.e. target will be 4 times the SL.
when a candle is completely below the lower Bollinger band, that candle will be called a signal/alert candle.
Initiate a Buy trade when that alert candles high is broken. SL will be below low of that alert candle.
Risk to reward ratio will be 1:4 i.e. target will be 4 times the SL.
other rules for Options buying:- minimum 15min timeframe
The day you initiate the position , you should be in profit above 10%-15% then only you should carry forward that position overnight, otherwise squareoff your trade on that day only.
Buy ATM or slightly OTM, SL max 100 points , target 1:4
for Long-term/Investing :- Minimum Weekly
If candle is outside the lower band then initiate a Buy trade when that candles High is broken. Sl will be below Low of that candle.
for Long-term Target will be according to your emotions.
3. Power of Stocks - 5ema Strategy (target minimum 1:3)
Timeframe -
5 min for Selling (Sell Futures/index/stocks or buy Put)
15 min for Buying (Buy Futures/index/stocks or sell Put)
for selling stocks :-
you should enter trade within 10am , don't look for entries after that time. take only 2 entries a day.
for selling Index(Banknifty) :-
you can take trade at anytime of the day whenever conditions get satisfied. you can take multiple entries in banknifty as it is very volatile.
for options choose atm strikes: selling trade
sl for premium between 200-300 :- 20-30 points SL
sl for premium between 400-500 :- 40-50 points SL
sl for premium between 500-600 :- 50-60 points SL
Subhashish Pani's (power of stocks) 5 EMA Strategy:-
It plots 5 EMA and Buy/Sell signals with Target & Stoploss levels.
What is Subhashish Pani's (power of stocks) 5 EMA Strategy :-
His strategy is very simple to understand. for intraday use 5 minutes timeframe for selling. You can sell futures, sell call or buy Puts in selling strategy.
What this strategy tries to do is , it tries to catch the tops, so when you sell at top & it turns out to be a reversal point then you can get good profit.
this will hit stop losses often, but stop losses are small and minimum target should be 1:3. but if you stay with the trend you can get big profits.
According to Subhashish Pani this strategy has 60% success rate.
Strategy for Selling (Short future/Call/stock or buy Put)
When ever a Candle closes completely above 5 ema (no part of candle should be touching the 5ema), then that candle should be considered as Alert Candle.
If the next candle is also completely above 5 ema and it has not broken the low of previous alert candle, Then the previous Alert Candle should be ignored and the new candle should be considered as new Alert Candle.
so if this goes on then continue shifting the Alert Candle, but whenever the next candle breaks the low of the Alert Candle we should take the Short trade (Short future/Call/stock or buy Put).
Stoploss will be above high of the Alert Candle and minimum target will be 1:3.
Strategy for Buying (Buy future/Call/stock or sell Put)
When ever a Candle closes completely below 5 ema (no part of candle should be touching the 5ema), then that candle should be considered as Alert Candle.
If the next candle is also completely below 5 ema and it has not broken the high of previous alert candle, Then the previous Alert Candle should be ignored and the new candle should be considered as new Alert Candle.
so if this goes on then continue shifting the Alert Candle, but whenever the next candle breaks the high of the Alert Candle we should take the Long trade (Buy future/Call/stock or sell Put).
Stoploss will be below low of the Alert Candle and minimum target will be 1:3.
Buy/Sell with extra conditions :
it just adds 1 more condition to buying/selling
1. checks if closing of current candle is lower than alert candles closing for Selling & checks if closing of current candle is higher than alert candles closing for Buyling.
This can sometimes save you from false moves but by using this, you can also miss out on big moves as you'll enter trade after candle closing instead of entering at break of high/low.
Note :- According to Subhashish Pani Timeframe for intraday buying should be 15 minutes Timeframe.
If you haven't understood the strategy by reading above description, then search for "Subhashish Pani's (power of stocks) 5 EMA Strategy" on YouTube to get a deeper understanding.
Note:- This is not only for Intraday trading , you can use this strategy for Positional/Swing trading as well. If you use this on Monthly Timeframe then it can be very good for Long Term Investing as well.
Rules will be same for all types of trades & Timeframes.

Regression Fit Bollinger Bands [Spiritualhealer117]This indicator is best suited for mean reversion trading, shorting at the upper band and buying at the lower band, but it can be used in all the same ways as a standard bollinger band.
It differs from a normal bollinger band because it is centered around the linear regression line, as opposed to the moving average line, and uses the linear regression of the standard deviation as opposed to the standard deviation.
This script was an experiment with the new vertical gradient fill feature.

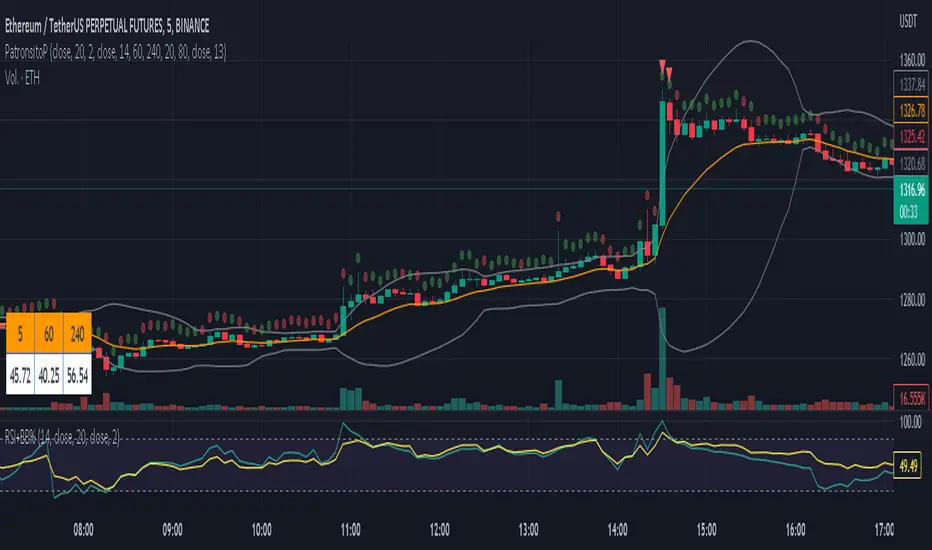
PatronsitoPIndicator for the "Patrón Poderoso" strategy.
This strategy is based on Bollinger Bands and RSI and try to determine overbought or oversold zones where you can trade. Both indicators are combined to provide a stronger signal.
By default, it is considered an overbought zone when price is over BB upper and RSI above 80. That would be a short signal. Price below BB lower and RSI below 20 means an oversold zone and therefore a long signal.
EMA 13 (by default) is included as a guide for exiting the operation.
Alarms for signals in any direction can be used.
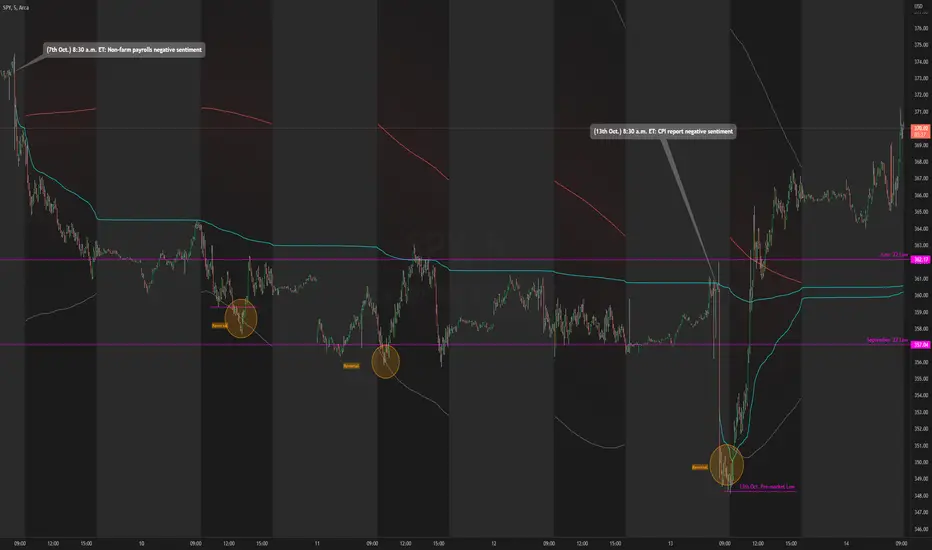
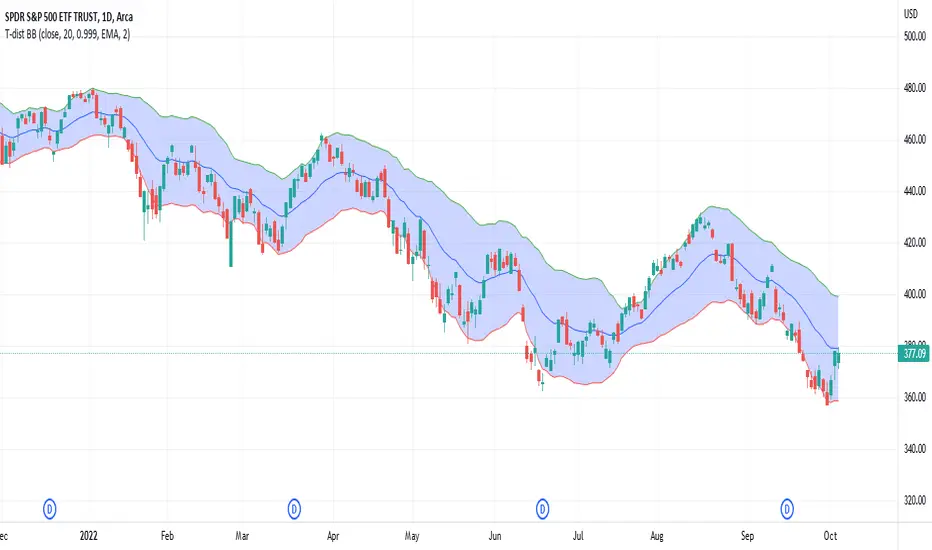
Daily RTH Moving Average On Intraday Timeframes [vnhilton]This indicator is intended for intraday use from the daily timeframe down to the 1 minute. Outside this range, the indicator won't work as intended.
Higher timeframe moving averages are step-lines as they use values from higher timeframes to calculate the moving average. To have a smoother moving average from higher timeframes plotted on lower timeframes, this indicator uses the chart timeframe's candles, allowing for a smooth higher timeframe moving average. This indicator also includes Bollinger Bands. Note that the indicator only uses values from regular trading hours, as to not give weighting to values from extended trading hours.
In the chart above, at October 7th, pre-market price action is bearish due to fundamentals around US employment data. This day led to an all-day-fader, stopping above the June low after attempting to break down the level again (previous breakdown attempts led to the September low). Note that the price is within the Bollinger bands of the 5 day moving average. We can see in the following days that $SPY trended downwards, staying below the anchored VWAP when the October 7th news released, & pay attention to October 10th, where price attempts to make a new low-of-day but ends up outside the 5 day period ma, leading to a reversal. Look at October 13th, where pre-market price action again shows bearish sentiment, but due to fundamentals around CPI data. $SPY opens below the September low, but also ends up outside the daily 5 period MA bands, meaning that the downside extension has extended too far, signalling for a reversion to the mean. This is why October 13th didn't lead to another all-day-fader, & instead trapped sellers trying to short the pre-market low, helping to fuel the relief rally to cause the upsides the June & September lows, & the anchored VWAPs from both significant pre-market events, to be reclaimed, where price pauses at the confluence of the 5 day moving average & the June low.

SUPER MACD📈 MACD Indicator Update - Version 2
🔹 New Features and Improvements:
1️⃣ New MACD Calculation Options:
Users can now choose from various Moving Averages to calculate the MACD. The default options are SMA (Simple Moving Average) and EMA (Exponential Moving Average), but there are 14 other versions available to experiment with:
SMA (Simple Moving Average)
EMA (Exponential Moving Average)
WMA (Weighted Moving Average)
RMA (Smoothed Moving Average)
HMA (Hull Moving Average)
JMA (Jurik Moving Average)
DEMA (Double Exponential Moving Average)
TEMA (Triple Exponential Moving Average)
LSMA (Least Squares Moving Average)
VWMA (Volume-Weighted Moving Average)
SMMA (Smoothed Moving Average)
KAMA (Kaufman’s Adaptive Moving Average)
ALMA (Arnaud Legoux Moving Average)
FRAMA (Fractal Adaptive Moving Average)
VIDYA (Variable Index Dynamic Average)
2️⃣ Improved Input Visibility and Organization:
We’ve reorganized the inputs so that the most commonly used ones are now placed at the beginning for quicker and more convenient configuration.
3️⃣ Bug Fixes and Code Improvements:
Minor bugs have been fixed, and the code has been optimized for better stability and performance. The code is now cleaner and fully functional in version 6.
4️⃣ Cometreon Public Library Integration:
To lighten the code and improve its modularity, we’ve integrated the Cometreon public library. This makes the code more efficient and reduces the need to duplicate common functions.
☄️ With this update, the MACD indicator becomes even more versatile and user-friendly, offering a wide range of calculation methods and an improved interface!

Student's T-Distribution Bollinger BandsThis study shows the prediction interval as Bollinger Bands using Student's T-distribution. This means that the bands will be wider when the data features higher variation, as well as when the sample size (in the form of length) is smaller. The bands will also be wider when the confidence level is lower. The opposite is also true. Assuming we set a confidence level of 0.99 and a source set to the close price, we could reasonably expect that 99% of the time the close price would fall between the upper and lower bounds. Because this is a general statistical method which requires a lot of math, the script has a tendency to be relatively slow, but should be eligible to be used in a wide variety of situations.
Bollinger Bands Width and Bollinger Bands %BThis script shows both the Bollinger Band Width(BBW) and %B on the same indicator window.
Both the BBW and %B are introduced by John Bollinger(creator of Bollinger Bands) in 2010.
Default Parameter values: Length = 20, Source = Close, Mult = 2
Bollinger Bands Width (BBW): Color = (Default: Green )
- I consider stocks with "BBW >= 4" are at a volatile state and ready for price contraction, but this depends on the parameter values of your choice.
Bollinger Bands %B (%B): Color = (Default: Blue )
1. %B Above 10 = Price is Above the Upper Band
2. %B Equal to 10 = Price is at the Upper Band
3. %B Above 5 = Price is Above the Middle Line
4. %B Below 5 = Price is Below the Middle Line
5. %B Equal to 0 = Price is at the Lower Band
6. %B Below 0 = Price is Below the Lower Band

Bolinger Band AnalysisBollinger Band Analysis
Objective - Use for entry action filter
Description - Bollinger Band Analysis Indicator is the introduction of value between basis moving average with standard deviation value
Applications - The principle of Bollinger Band Analysis Indicator is to use it as an order action filter when the value of the Bollinger Band under moving average by itself.
Recommendation - Bollinger Band Analysis should be used in conjunction with indicators used to filter trend. for example supertrend, parabolic sar

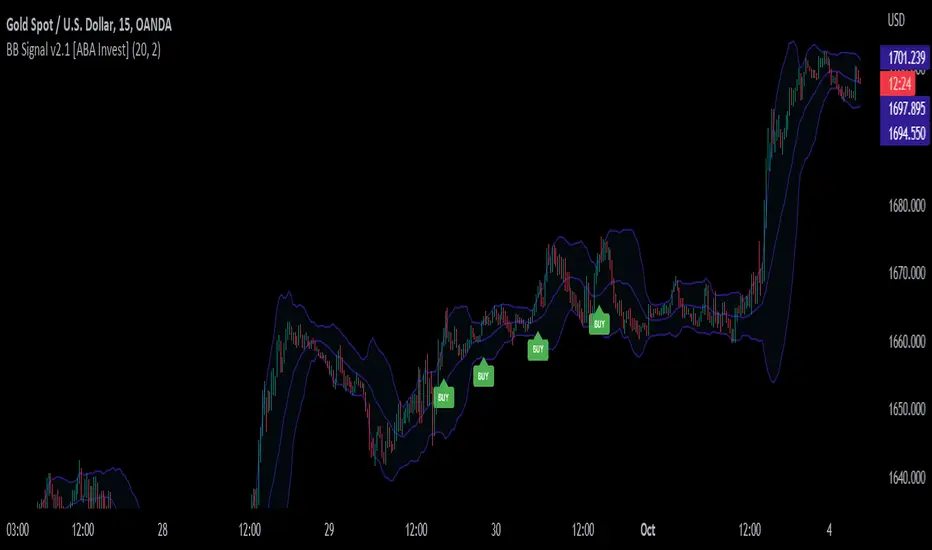
BB Signal v2.1 [ABA Invest]About
This signal appears based on 2nd candle break out of Bollinger Bands (called Momentum) with additional EMA 50 and EMA 200 as trend filters. so the concept is to take advantage of candle breakout by following trends.
How to use
Buy: When signal 'Buy' appears (following trend of upper timeframe)
Recommended stop loss: previous swing low
Sell: When signal 'Sell' appears (following trend of upper timeframe)
Recommended stop loss: previous swing high
Rules
1. use a good risk-reward ratio (minimum 1.5)
2. Please do backtest before using this signal
3. Don't always take every signal (must know when to stop)
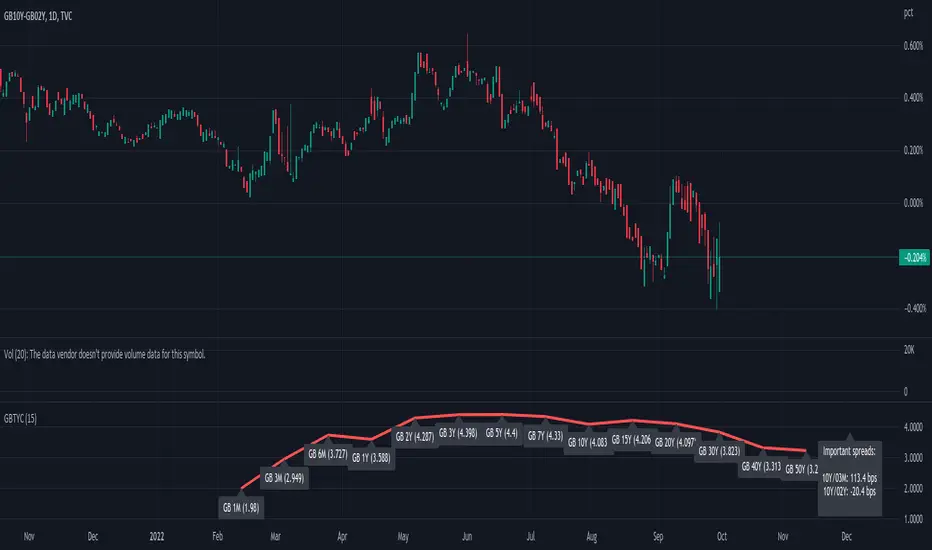
GB Gilt Yield CurveWith thanks to @longfiat whose US Treasury Yield Curve served as the basis for this indicator
This is created very quickly to provide a sense of the GB Gilt Yield curve in light of government induced market dysfunction as a result of an ill-conceived mini-budget.
Note that I omitted GB04Y, GB06Y, GB08Y, GB09Y and GB12Y to avoid overcrowding the chart with excess information and thereby render the indicator more readily usable.
Bollinger BandsThis strategy is inspired from Power of Stock aka Subhasish Panni.
Target is minimum 1:3 when you get this setup right.
Buy when:
1) Low is greater than upper band of BB and next candle breaks high of that candle, SL is Low of previous candle which is has low above upper band.
2) High is lower than lower band of BB and next candle breaks high of that candle, SL is low of previous candle which has high lower than lower band.
Sell when:
1) Low is greater than upper band of BB and next candle breaks low of that candle, SL is high of previous candle which is has low above upper band.
2) High is lower than lower band of BB and next candle breaks high of that candle, SL is high of previous candle which has high lower than lower band.
Disclaimer: this setup will cause many small stoploss hit, you have to accept that loss but you will be profitable because of R:R.

Indicateur C17V2 Not long ago I discovered the TDI(kiss Soxman),
but I needed to know where my market was framed so I started tampering with the open source indicators on TV to make one my way, I'm not not a developer, just a trader homeless.

Percentile Rank of Bollinger BandsThis simple indicator provides you three useful information with Bollinger Bands:
How wide the current width (standard deviation) of the Bollinger Band is.
Compared to the widths in the past, is the current width relatively small or big? Value is expressed in percentile format.
What the "relative position of current price" to the current Bollinger Band is.
This indicator can be useful to identify whether the Bollinger Band has substantially "expanded" or "squeezed."
First, divide the current standard deviation by the current price, we get the current width. The current width is displayed by the columns at the bottom. When the current width becomes wider, the column becomes taller, and the color is dark green. On the contrary, if the width becomes narrower, the column becomes shorter and the color is light green.
Next, compare the current width with the previous N widths, we get the percentile rank for the current width. The percentile rank is shown by the thicker line graph. When the percentile rank grows, it is green; whereas when the rank declines, the color is red.
Lastly, calculate (close - lower)/(upper - lower) and we get an idea of the relative height of the current price, compared to the upper and lower band. This is displayed by the thinner line graph. When the relative position becomes higher, the color is in aqua. It is in blue when the relative position becomes lower. Note that since closing prices can go above the upper band or go below the lower band, the values may be greater than 100 or less than 0.

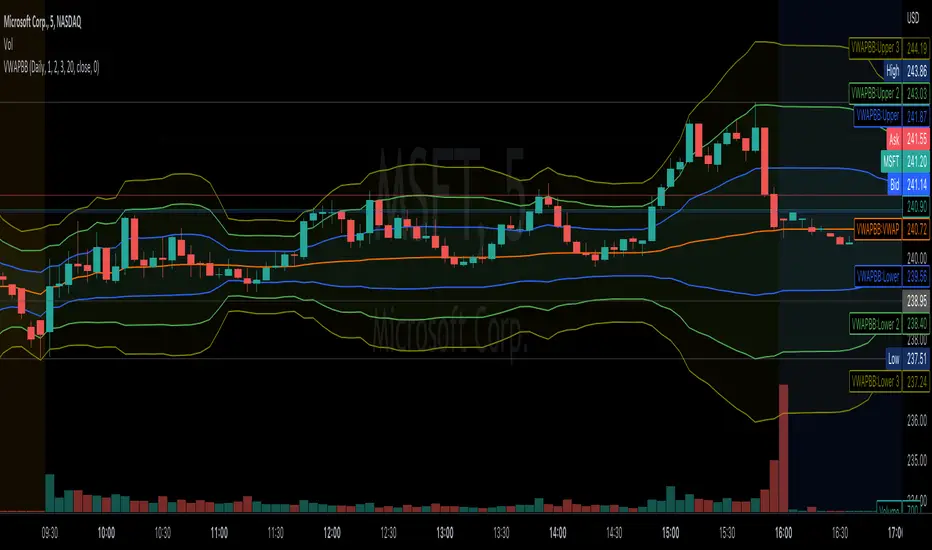
VWAP Bollinger BandsWhat makes this different from vwap bands / bollinger bands?
This indicator takes a bit of inspiration from bollinger but instead of utilizing built in pine script std dev that uses simple moving average internally, this version replaces that with vwap.
Also instead of traditional bollinger band basis of 20 period simple moving average, the basis here for the bands is the vwap.
How to use it?
Usage is similar to vwap itself, though the standard deviation bands will expand and contract like normal bollinger bands instead of vwap bands that just widen as the market movement continues. The bands tell a slightly different story from bollinger bands as the underlying data utilized is the vwap itself.
Which markets is this meant for?
Any market.
What conditions?
This aids in finding conditions of entry standard to vwap, but the bands could give key areas of focus for entries and exits better than standard bollinger bands or vwap bands.
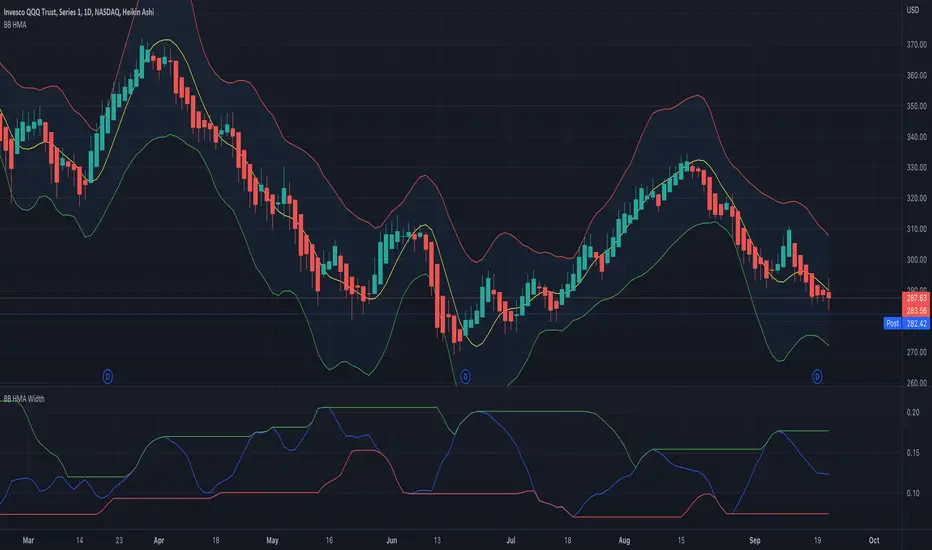
BB HMA WidthThe built-in Bollinger Band Width script modified to use the Hull Moving Average as the basis.
Hull Moving Averages have much less lag than a regular moving average.
Do not assume that regular BB interpretation rules apply to this.
This is an experimental indicator at this time.
Bollinger Bands %B using HMAThe built-in Bollinger Band %b script modified to use the Hull Moving Average as the basis.
Hull Moving Averages have much less lag than a regular moving average.
Do not assume that regular BB interpretation rules apply to this.
This is an experimental indicator at this time.
