Pi Cycle Bitcoin Top and Bottom (Daily)Pi Cycle Bitcoin Top and Bottom (Daily)
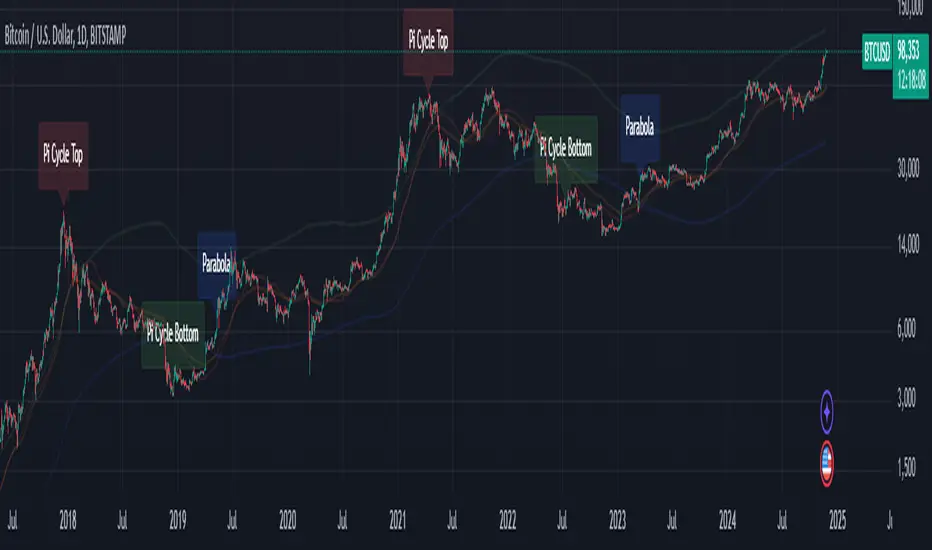
This indicator combines the renowned Pi Cycle Top and Pi Cycle Bottom indicators into one comprehensive tool designed to identify Bitcoin's market cycle tops and bottoms with precision.
Pi Cycle Top
The Pi Cycle Top indicator uses the 111-day moving average (111DMA) and a multiple of the 350-day moving average (350DMA x 2). Historically, this indicator has identified Bitcoin’s price cycle peaks with an accuracy of up to 3 days.
📈 When the 111DMA crosses above the 350DMA x 2, it signals a market cycle top.
Pi Cycle Bottom
The Pi Cycle Bottom indicator utilizes the 150-day exponential moving average (150EMA) and a multiple of the 471-day simple moving average (471SMA x 0.745). Over past cycles, this combination has effectively pinpointed Bitcoin’s market bottoms with the same level of accuracy.
📉 When the 150EMA crosses below the 471SMA x 0.745, it signals a market cycle bottom.
Parabola
As an additional feature, the indicator identifies moments when the 150EMA crosses back above the 471SMA x 0.745, suggesting a potential parabolic price movement.
Features
Precision: Both indicators have historically aligned with major market turning points.
Customizable settings: Adjust the short and long moving averages to fit your analysis needs.
Alerts: Real-time alerts can be enabled for identifying market tops and bottoms.
Clear visualization: Optional moving average lines and signal markers make it easy to track market trends.
Full credits to Philip Swift, PositiveCrypto, Tondy, BilzerianCandle.
Bitcoinidea
BTC Arcturus IndicatorBTC Arcturus Indicator: This indicator is designed to create buy and sell signals based on the market value of Bitcoin. It also predicts potential market tops with the Pi Cycle Top indicator.
How Does It Work?
1. MVRVZ (Market Value to Realized Value-Z Score) Calculation:
MC: Bitcoin's market cap (Market Cap) is pulled daily from Glassnode data.
MCR: Realized Market Cap of Bitcoin is taken daily from Coinmetrics data.
MVRVZ: It is calculated by dividing the difference between Bitcoin's market value and realized market value by one standard deviation. This value indicates whether the market is overvalued or undervalued.
2. Reception and Warning Signals:
Buy Signal: When MVRVZ falls below the -0.255 threshold value, the indicator gives a "Buy" signal. This indicates that Bitcoin is undervalued and may be a buying opportunity.
Warning Signal: A warning signal turns on when MVRVZ exceeds the threshold value of 2.765. This indicates that the market is approaching saturation and caution is warranted.
3. Tracking the Highest MVRVZ Value:
The indicator records the highest MVRVZ value in the last 10 candlesticks. This value is used to determine whether the market has reached its highest risk levels.
4. Warning Display:
If the MVRVZ value matches the highest value in the last 10 bars and this warning has not been displayed before, a "Warning" signal is displayed.
Once the warning signal is shown, no further warnings are shown for 10 candles.
5. Pi Cycle Top Indicator:
Pi Cycle Top: This indicator predicts Bitcoin tops by comparing two moving averages (350-day and 111-day). If the short-term moving average falls below the long-term moving average, this is considered a sell signal.
The indicator displays this signal with the label "Sell", indicating a potential market top.
User Guide:
Green Buy Signal: It means Bitcoin is cheap and offers a buying opportunity.
Yellow Warning Signal: Indicates that Bitcoin has reached possible profit taking points and caution should be exercised.
Red Sell Signal: Indicates that Bitcoin has reached market saturation and it may be appropriate to sell.

BTC hash rate oscillatorOVERVIEW:
This script looks to identify entry point opportunities when moving averages over Bitcoin's hash rate are indicative of Miner capitulation. The script implements an oscillator based on Charles Capriole's "Hash Ribbons & Bitcoin Bottoms" concept. It analyses the short-term and long-term moving averages of Bitcoin's hash rate and then identifies potential entry opportunities from this.
KEY FEATURES:
Signal Generation: The script identifies entry points when the short-term moving average crosses under the long-term moving average and the rate of change falls below a specified threshold. These conditions suggest potential trading opportunities.
Historical Signals: Optionally the script displays historical signals, indicating past instances where hash rate conditions suggested favourable entry points. Users can also assess the script's historical performance.
USAGE:
The generated opportunities can be used as potential entry points for BTC. The script provides visual cues on the chart (blue labels above the miner capitulation zones) for identification of signals. Customisable moving average lengths and threshold values are supported, which allow adaptation to various strategies.
CONSIDERATIONS:
Validation: It's recommended that careful backtesting over historical data be done before acting on any identified opportunities.
User Discretion: Trading decisions should not rely solely on this script. Users should exercise their judgment and consider market conditions.
Note: This script identifies opportunities based on historical data and should be used with caution, as past performance is not indicative of future results.

Bitcoin Economics Adaptive MultipleBEAM (Bitcoin Economics Adaptive Multiple) is an indicator that assesses the valuation of Bitcoin by dividing the current price of Bitcoin by a moving average of past prices. Its purpose is to provide insights into whether Bitcoin is under or overvalued at any given time. The thresholds for the buy and sell zones in BEAM are adjustable, allowing users to customize the indicator based on their preferences and trading strategies.
BEAM categorizes Bitcoin's valuation into two distinct zones: the green buy zone and the red sell zone.
Green Buy Zone:
The green buy zone in BEAM indicates that Bitcoin is potentially undervalued. Traders and investors may interpret this zone as a favorable buying opportunity. The threshold for the buy zone can be adjusted to suit individual preferences or trading strategies.
Red Sell Zone:
The red sell zone in BEAM suggests that Bitcoin is potentially overvalued. Traders and investors may consider selling their Bitcoin holdings during this zone to secure profits or manage risk. The threshold for the sell zone is adjustable, allowing users to adapt the indicator based on their trading preferences.
Methodology:
BEAM calculates the indicator value using the following formula:
beam = math.log(close / ta.sma(close, math.min(count, 1400))) / 2.5
The calculation involves taking the natural logarithm of the ratio between the current price of Bitcoin and a simple moving average of past prices. The moving average period used is a minimum of the specified count or 1400, providing a suitable historical reference for valuation assessment.
The resulting value of BEAM provides a standardized measure that can be compared across different time periods. By adjusting the thresholds for the buy and sell zones, users can customize BEAM to their preferred levels of undervaluation and overvaluation.
Utility:
BEAM serves as a tool for investors in the Bitcoin market, offering insights into Bitcoin's valuation and potential buying or selling opportunities. By monitoring BEAM, market participants can gauge whether Bitcoin is potentially undervalued or overvalued, helping them make informed decisions regarding their Bitcoin positions.
It is important to note that BEAM should be used in conjunction with other technical and fundamental analysis tools to validate signals and avoid relying solely on this indicator for trading decisions. Additionally, traders and investors are encouraged to adjust the threshold values based on their specific trading strategies, risk tolerance, and market conditions.
Credit: The BEAM (Bitcoin Economics Adaptive Multiple) indicator was originally developed by BitcoinEcon
