KZ One — Scalping Training StrategyKZ One is a scalping strategy developed for M1 and M5 timeframes. It is designed to help traders study and practice short-term market behavior by using structured zones to highlight potential entry and exit areas. The strategy allows customization of Risk (USD) and Take Profit (R multiple) parameters for flexible trade management. Additional tools include ATR-based filters to skip low-volatility conditions and a Pre-Alert Lead (bars) option that notifies users ahead of possible setups. KZ One is intended for educational and analytical purposes, promoting disciplined and consistent trading practice.
밴드 및 채널

RAFEN-G - Kill Zones & Institutional Gaps🔍 What It Does
Kill Zones (KZ1, KZ2, KZ3)
Automatically highlights the main intraday liquidity windows such as the London open, NY AM, and NY PM sessions — customizable by time, color, and transparency.
Perfect for timing setups, identifying liquidity sweeps, or backtesting session behavior.
Institutional GAP Detection (NY 11:00 → 03:00)
Anchored on the New York H1 clock, the script automatically draws the “institutional gap” between the 11:00 close and the 03:00 open of the next trading day.
Each gap is drawn as a transparent box with a label showing its size in price units.
Dynamic Cleanup & Color Updates
Automatically removes old boxes beyond your chosen history limit and keeps all visuals perfectly synchronized in real-time.
⚙️ Key Features
3 fully independent and editable Kill Zones
Adjustable timezone (default: America/New_York)
Works on all intraday timeframes
Auto-management of historical data
Clean and lightweight visuals (up to 2000 boxes)
Real-time color and transparency updates
Alerts when each Kill Zone starts
🧠 Ideal For
Traders using ICT, SMC, or institutional frameworks who want clear visual separation of market sessions and automatic tracking of session-to-session gaps for confluence or imbalance analysis.
🕐 Recommended Use
Apply on 5 min / 15 min / 1 h charts, align timezone to NYC, and combine with liquidity or FVG tools for maximum insight.

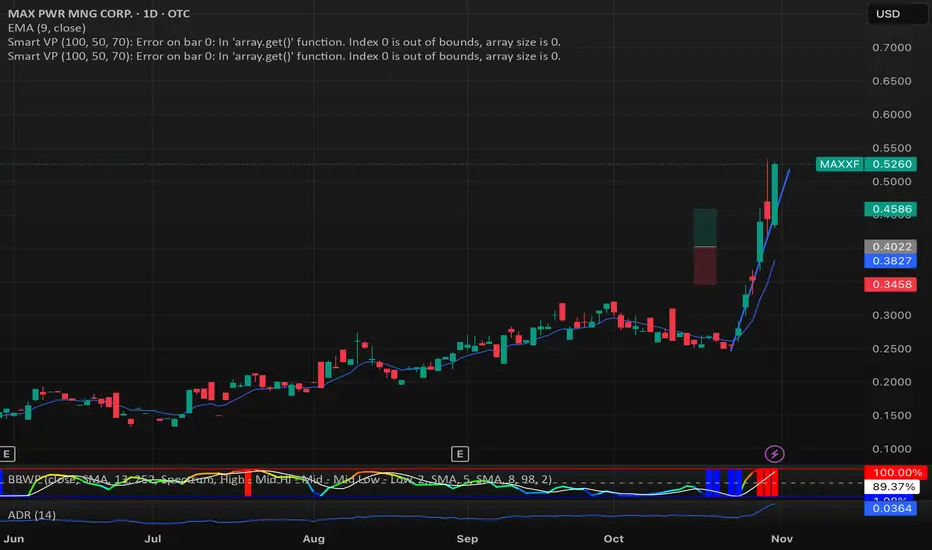
Short-Timeframe Volume Spike DetectorShort-Timeframe Volume Spike Detector
Description:
The Short-Timeframe Volume Spike Detector is an advanced multi-timeframe (MTF) indicator that automatically detects sudden volume surges and price expansion events on a lower timeframe and displays them on a higher (base) timeframe chart — helping traders identify hidden intraday accumulation or breakout pressure within broader candles.
⚙️ How It Works
Select a Base Timeframe (e.g., Daily, 4H, 1H).
The script automatically fetches data from a Lower Timeframe (e.g., Daily → 1H, 1H → 15m).
Within each base bar, it scans all the lower timeframe candles to find:
Volume Spikes: Volume exceeds average × multiplier or a custom threshold.
Price Strength: Candle shows upward movement beyond a minimum % change.
When both conditions are met, a spike signal is plotted on the higher timeframe chart.
🔍 Features
✅ Automatic Lower Timeframe Mapping — Dynamically selects the most relevant lower timeframe.
✅ Two Detection Modes:
Multiplier Mode: Volume spikes defined as multiple of average lower timeframe volume.
Manual Mode: Custom absolute volume threshold.
✅ Trend Filter Option: Show only signals during uptrends (configurable).
✅ Visual Markers:
Purple “X” = Volume Spike Detected
Dotted red & green lines = Candle range extension
✅ Custom Label Placement: Above High / Below Low / At Spike Price
✅ Debug Mode: Displays full diagnostic info including detected volume, threshold, and % change.
📊 Use Cases
Detect early accumulation in daily candles using hourly or 15-min data.
Identify institutional buying interest before visible breakouts.
Confirm strong continuation patterns after price compression.
Spot hidden intraday activity on swing or positional charts.
🧩 Inputs Overview
Input Description
Base Timeframe Main chart timeframe for analysis
Lookback Bars Number of recent candles to scan
Volume Mode “Multiplier” or “Manual Benchmark”
Volume Multiplier Multiplier applied to average lower timeframe volume
Manual Volume Threshold Fixed volume benchmark
Min Price Change % Minimum lower timeframe candle % move to qualify
Use Trend Filter Only show in uptrend (close > close )
Extend Bars Number of bars to extend dotted lines
Label Position Choose Above High / Below Low / At Spike Price
Debug Mode Show live internal values for calibration
🧠 Tips
Ideal for swing traders and multi-timeframe analysts.
Works best when base = Daily and lower = Hourly or 15m.
Combine with Volume Profile, VWAP, or RRG-style analysis for stronger confluence.
Use Multiplier 1.5–2.5 to fine-tune for your asset’s volatility.
⚠️ Notes
Works only when applied to the base timeframe selected in inputs.
May not display signals on non-standard intraday timeframes (like 3H).
Labels limited to max_labels_count for performance stability.

My Smart Volume Profile – Fixed
Title: 🔹 My Smart Volume Profile – Fixed
Description:
Lightweight custom Volume Profile showing POC, VAH, and VAL levels from recent bars. Highlights the value area, marks price touches, and supports optional alerts.
Developer Note:
Created with precision and simplicity by Magnergy


Margen de confianzaIt uses two moving averages (20 and 80). Based on their crossovers, you draw parallel bands.
The zone between these bands signals “confidence.” A downside break warns of risk; an upside break suggests price could push to new highs.
Son 2 medias moviles. Una de 20 y otra de 80. Utilizando los cruces se puede trazar lineas paralelas.
En las zonas que quedan entre estas lineas hay "confianza". Si el precio atraviesa para abajo hay peligro y si atraviesa para arriba puede ir a romper maximos

Power Law BTC IndicatorPOWER LAW BTC indicator:
A long-term price model that suggests Bitcoin's price follows a power law function over time. Unlike traditional stock market models that assume linear or exponential growth, the power law model suggests that Bitcoin's price scales in a predictable, non-random way over the long run

NY ORB - Full Dynamic SystemNY ORB - Full Dynamic Strategy Summary
1. Opening Range and Session Timing
Opening Range (ORB) Calculation: The strategy identifies the ORB High and ORB Low by tracking the highest high and lowest low during the specified New York pre-market window, which is set by default from 8:30 to 8:45 (New York time).
Entry Window: Trading activity is restricted to a specific entry period, typically starting shortly after the ORB is established (default: 8:50 to 12:00).
Hard Exit Time: Any remaining open positions are automatically closed at a fixed exit time (default: 13:25).
2. Trade Entry Logic and Filters
An entry (Long or Short) is generated when the price breaks out of the established ORB, provided it passes a series of optional filters:
Direction Control: The user can restrict the strategy to trade Long Only, Short Only, or Both.
Second Breakout Logic: An optional filter that requires the price to break out, reverse back into the range, and then break out again, confirming momentum after a consolidation.
Confirmation Candle Count: An optional filter that checks the close of a previous candle (e.g., 1 or 2 candles ago) to ensure the price was still inside the range, preventing premature entry.
Technical Filters (Optional): The entry is only executed if it aligns with selected indicators:
RSI: Filters for non-overbought (Long) or non-oversold (Short) conditions.
MACD: Requires the MACD line to be above/below the Signal line for alignment.
VWAP: Requires the price to be above/below the Volume-Weighted Average Price.
Trend Filter (SMMA): Requires the price to be above/below a 50-period Simple Moving Average.
3. Dynamic Risk and Exit Management
This strategy features highly configurable stop-loss and profit-taking mechanics:
Primary Stop Loss Methods: The Stop Loss distance can be dynamically chosen from four types:
Fixed: A fixed number of ticks.
ATR: Based on a multiple of the Average True Range (ATR).
Capped ATR: ATR-based, but with a hard maximum tick limit.
OR-Based: Based on a multiple of the actual ORB High-to-Low range.
Dynamic Profit Target: The Take Profit level is calculated dynamically based on a multiplier of either the ATR or the ORB Range.
Breakeven Stop:
If enabled, the Stop Loss automatically moves to the entry price (Breakeven) once the price moves a predetermined distance in the profitable direction.
An Adaptive Breakeven option allows the trigger distance to be calculated as a percentage of the overall ATR Profit Target.
Trailing Stop: The strategy uses a trailing stop, which can be custom-set (fixed ticks) or dynamically tied to the ATR. An optional feature Auto Tighten Trailing reduces the trailing multiplier once the breakeven level is hit.
MA Cross Exit: An alternative, counter-trend exit mechanism that closes the trade if the price crosses back over the chosen Moving Average (either SMMA or VWAP), overriding the pending profit target.
4. Daily Account Management
The strategy includes crucial daily risk controls to protect capital and lock in profits:
Daily Profit Limit: If the total daily PnL (realized and unrealized) hits a predefined maximum profit threshold (in ticks), all trades are closed, and new entries are blocked for the remainder of the trading day.
Daily Loss Limit: Conversely, if the total daily PnL hits a predefined maximum loss threshold, all trades are closed, and new entries are blocked for the remainder of the day.

Multi-Anchor VWAP | Trade Symmetry🧩 Multi-Anchor VWAP
Description:
Dynamic VWAP anchored to Session, Week, Month, Quarter, and Year — all in one view.
Full Description:
This indicator plots multiple VWAPs (Volume-Weighted Average Prices) simultaneously — each anchored to a different time period:
Session, Week, Month, Quarter, and Year.
💡 Ideal for traders who track institutional mean reversion and liquidity zones across multiple timeframes.
Features
✅ Session, Weekly, Monthly, Quarterly, and Yearly Anchored VWAPs
✅ Independent color and visibility controls for each anchor
✅ Adjustable label position and size
✅ Option to hide VWAPs on Daily or higher charts
✅ Clean and efficient performance
This tool helps you visualize volume-weighted mean levels where price often reacts — offering a clear map of bias and equilibrium across all major time horizons.

Addikro_V1📌 Description – Trend+Entry+Risk Indicator
This indicator combines statistically proven trading concepts into a complete trading framework:
✅ Trend Filter (EMA200)
All trades follow the higher-timeframe trend. Trend direction is clearly visualized.
✅ Entry Signals (you can choose):
EMA Crossover (EMA50 crossing EMA200) — classic trend-following entry
Breakout of recent highs/lows (20-bar range) — optionally only valid after a pullback to EMA50
✅ ATR-Based Risk Management:
Dynamic Stop Loss (SL) and Take Profit (TP1/TP2) levels using ATR
The last entry is saved — SL/TP lines stay visible on the chart
Optional position size suggestion based on % risk of account
✅ Smart Filters for Higher Accuracy:
RSI filter: e.g., only long if RSI > 50
Volume filter: signal only if volume is above SMA × multiplier
✅ Fixed Chart HUD (Table Overlay):
Displays live information anchored to the chart (does not move with candles)
Shows: Trend direction, entry mode, RSI, ATR, SL/TP multiplier, position size suggestion
Position can be set: top-left / top-right / bottom-left / bottom-right
✅ Signals & Alerts:
Visual arrows on the chart for long/short signals
Custom alert conditions included (works with mobile, email, webhook, bots)
🎯 Why this indicator works
It follows the same logic used by many successful systematic and hedge fund strategies:
Trend direction + statistically solid entries + strict risk management → no repainting, no guessing, no emotion.

Previous Week High & Low Flat Trendlines + Labels on Current weeks lower time frames which display Previous Week High & Low
Custom Checklist# Custom Checklist - Trading Preparation & Reminders
A fully customizable checklist overlay indicator for TradingView that helps traders maintain discipline and follow their trading routine systematically.
## 🎯 Purpose
This indicator serves as a visual reminder system on your charts to ensure you complete all necessary analysis steps before entering a trade. Perfect for traders who want to maintain consistency and avoid emotional or rushed trading decisions.
## ✨ Key Features
- **20 Customizable Lines**: Create your own checklist items with any text you need
- **Flexible Display Options**:
- Show/hide title header
- Toggle entire checklist on/off
- Position anywhere on chart (9 positions available)
- Adjustable text size (tiny to huge)
- **Symbol Filtering**: Option to show checklist only on specific symbols (BTC/USD, GOLD, SPX500, USOIL)
- **Customizable Appearance**:
- Background color
- Text color
- Border color
- Transparency controls
- **Clean Interface**: Empty by default - add only the items you need
## 📋 Use Cases
- **Morning Routine**: Daily market preparation checklist
- **Trade Entry Rules**: Verify all setup conditions are met
- **Risk Management**: Confirm stop-loss, position size, and exit strategy
- **Multi-Timeframe Analysis**: Ensure you checked all required timeframes
- **Technical Analysis**: Track which indicators and patterns you've reviewed
- **News & Events**: Remember to check economic calendar and news
- **Personal Rules**: Your custom trading rules and reminders
## 🎨 Customization
Every aspect is customizable:
- All 20 lines can be edited to your needs
- Only non-empty lines are displayed
- Table position adjustable to any corner or middle position
- Color scheme fully customizable to match your chart theme
- Text size scalable for different screen sizes
## 💡 How to Use
1. Add indicator to your chart
2. Open Settings > Checklist Items
3. Fill in your checklist items (Line 1, Line 2, etc.)
4. Customize colors and position in Display Settings
5. Optional: Enable "Show Only on Specific Symbols" to show on select instruments
## 🔧 Display Settings
- **Checklist Title**: Custom header for your checklist
- **Show Title Header**: Toggle title display
- **Show Checklist**: Master on/off switch
- **Symbol Filter**: Restrict display to specific trading instruments
- **Position**: 9 placement options (corners and middle positions)
- **Text Size**: 5 size options (tiny, small, normal, large, huge)
- **Colors**: Background, text, and border fully customizable
## 📝 Example Checklist Ideas
**Swing Trading:**
- Support/Resistance levels identified
- Trend direction confirmed
- Volume analysis completed
- RSI/MACD signals checked
- Risk/Reward ratio calculated
**Day Trading:**
- Pre-market review done
- Key levels marked
- Economic calendar checked
- Trading plan written
- Position size calculated
**Technical Analysis:**
- Multiple timeframe alignment
- Chart patterns identified
- Moving averages reviewed
- Fibonacci levels drawn
- Volume profile analyzed
## ⚙️ Technical Details
- Pine Script v6
- Overlay indicator (displays on main chart)
- Lightweight - no complex calculations
- No repainting
- Works on all timeframes and instruments
## 🎓 Perfect For
- Beginner traders learning systematic analysis
- Experienced traders maintaining discipline
- Anyone who wants visual trading reminders
- Traders following multi-step strategies
- Those prone to FOMO or emotional trading
---
**Note**: This is a visual tool only. It does not generate trading signals or perform analysis. It serves as a reminder checklist to help you follow your own trading process consistently.

Cipher B Free | WaveTrend (v6)Uh.. I call this.. Mona Lisa kek. Tried creating my own version of Cipher B with Grok. Feel free to tweak to your heart's content

Hurst Dual-Channel + ECDF Early Reentry (Single Trigger)Hello,
This indicator can be useful during ranging market phases, especially on short timeframes such as 5 minutes, within a statistically contrarian approach.
It combines two quantitative methodologies:
– Hurst-type adaptive channels, which measure short- and medium-term price deviations using the ATR (Average True Range);
– an Empirical Cumulative Distribution Function (ECDF), which locates the current price between its recent extremes (0 corresponding to the lower bound, 1 to the upper bound).
The goal is to identify relative overbought and oversold zones, where the price exceeds the channels and then begins to revert toward its statistical mean.
The indicator does not issue trading recommendations: it merely highlights specific statistical conditions for research and analytical purposes.
The “BUY” and “SELL” labels indicate such technical configurations:
– ECDF < 0.2 with price returning above the lower channels → bullish reentry.
– ECDF > 0.9 with price returning below the upper channels → bearish reentry.
The parameters (channel periods, ECDF window, smoothing) allow you to fine-tune the sensitivity of the analysis according to instrument volatility or chosen timeframe.
🟩 Buy Signal (BUY)
A buy signal is triggered when a strong downside deviation pushes the price below both channels, followed by a gradual reentry inside the bands.
More precisely:
– The low is below both channels (low < scb and low < mcb).
– The ECDF crosses back above 0.19 (exit from oversold).
– Both events occur within the last six bars.
– The price moves back above the lower channel (high > scb).
– No previous long signal is active.
This configuration represents a statistical reentry to the mean after an excessive drop.
🟥 Sell Signal (SELL)
Conversely, a sell signal appears when a strong upside deviation pushes the price above both channels, followed by a pullback below them:
– The high exceeds both channels (high > sct and high > mct).
– The ECDF crosses below 0.9 (exit from overbought).
– Both events occur within the last six bars.
– The price falls back below the upper channel (low < sct).
– No previous short signal is active.
This reflects a bearish reentry following a statistical overextension.
⚙️ Operating Logic
Each signal is triggered only once per cycle thanks to the variables triggered_long and triggered_short, preventing duplicates until a new extreme occurs.
The tool is designed for visual analysis and pattern research, not for automated execution.
🔍 ECDF Principle and Calculation
The ECDF is a non-parametric measure of a value’s position within its recent distribution:
ECDF(X)=number of values ≤XNECDF(X) = \frac{\text{number of values } \le X}{N}ECDF(X)=Nnumber of values ≤X
It expresses the empirical proportion of observations below the current value.
Example:
If, among the last 100 observations, 85 are below the current price, then
ECDF=0.85ECDF = 0.85ECDF=0.85
→ The price is at the 85th percentile, statistically high relative to recent history.
Strengths: robust, model-free, well-suited to asymmetric or non-normal market regimes.
Limitations: it does not measure amplitude and depends on the selected window size.
🌊 Intuitive Analogy: The River and the Gauge
Imagine a river with a depth gauge:
– The Z-Score tells you how many meters above the average level the water currently stands.
– The ECDF tells you in how many past cases the water level was lower than it is now.
The Z-Score assumes the river always follows the same symmetrical pattern.
The ECDF simply observes reality — adapting naturally, even when the current becomes unpredictable.
Final note:
This indicator is designed for visual and statistical exploration of price behavior.
The signals represent statistical states, not trade instructions.
Entering long or short positions based on them is entirely at your own discretion and risk.
